High-Resolution X-Ray Spectroscopy of the Galactic Supernova Remnant Puppis A with the XMM-Newton RGS
Abstract
We present high-resolution X-ray spectra of cloud-shock interaction regions in the eastern and northern rims of the Galactic supernova remnant Puppis A, using the Reflection Grating Spectrometer onboard the XMM-Newton satellite. A number of emission lines including K triplets of He-like N, O, and Ne are clearly resolved for the first time. Intensity ratios of forbidden to resonance lines in the triplets are found to be higher than predictions by thermal emission models having plausible plasma parameters. The anomalous line ratios cannot be reproduced by effects of resonance scattering, recombination, or inner-shell ionization processes, but could be explained by charge-exchange emission that should arise at interfaces between the cold/warm clouds and the hot plasma. Our observations thus provide observational support for charge-exchange X-ray emission in supernova remnants.
Subject headings:
atomic processes — ISM: abundances — ISM: individual objects: Puppis A — ISM: supernova remnants — X-rays: ISM1. Introduction
It has long been thought that the X-ray emission from supernova remnants (SNRs) is partly due to charge-exchange (CX) processes between neutrals and highly-ionized ions (e.g., Serlemitsos et al., 1973). Wise & Sarazin (1989) first performed a detailed theoretical calculation of CX-induced X-ray emission from SNRs. They found that the contribution of CX emission is typically 10-3 to 10-5 compared with that of thermal emission (i.e., electron collisional excitation lines). This means that CX emission is in general very minor. However, as the authors claimed, CX emission could play an enhanced role where neutrals are mixed with shocked hot gas because of hydrodynamic instabilities in SNRs and/or inhomogeneities of the interstellar medium. Subsequently, Lallement (2004) examined projected emission profiles for both CX and thermal emission in SNRs, and noted that CX X-ray emission could be comparable with thermal emission in thin layers at the SNR edge. It is also pointed out that the relative importance of CX X-ray emission to thermal emission is proportional to a quantity, , with being the cloud density, the relative velocity between neutrals and ions, and the electron density of the hot plasma. Thus, the higher the density contrast (/), the stronger the presence of CX X-ray emission would become.
Observational evidence of CX emission from SNRs was found at optical wavelengths more than 30 yrs ago (e.g., Kirshner & Chevalier, 1978), but is still lacking in the X-ray domain. So far, only marginal detections of CX X-ray emission were reported in the SMC SNR 1E0102.2–7219 (Rasmussen et al., 2001), and the Galactic SNR, the Cygnus Loop (Katsuda et al., 2011). The line intensity ratios of ()/() in H-like O (1E0102.2–7219) or He-like O (Cygnus Loop) seem to be higher than expectations from thermal emission models, and were interpreted as signatures of CX. However, the CX interpretation is still a matter of debate, because Chandra grating observations of 1E0102.2–7219 (Flanagan et al., 2004) did not confirm the XMM-Newton result, and uncertainties of Fe L line emissivities might cause the spectral anomaly in the Cygnus Loop (Katsuda et al., 2011).
One SNR that might show CX X-ray emission is Puppis A, a large (50′ in diameter) middle-aged (3700 yr: Winkler et al., 1988) SNR in our Galaxy. Its surface brightness is the highest among all Galactic SNRs in soft X-rays (1 keV). The X-ray image is inhomogeneous with particularly bright eastern and northern knots (hereafter, BEK and NK). These regions undoubtedly represent strong interactions between the SNR blast wave and dense clouds (e.g., Petre et al., 1982; Dubner & Arnal, 1988; Hwang et al., 2005), and thus they exhibit ideal conditions in which CX X-ray emission could be significant (Lallement, 2004). While indications of CX signatures have not yet been reported in this SNR, such signatures can be best obtained through high-resolution X-ray spectroscopy.
Here, we present high-resolution X-ray spectra of the BEK/NK features using XMM-Newton’s Reflection Grating Spectrometer (RGS: den Herder et al., 2001). From the RGS spectra, forbidden-to-resonance line ratios in He triplets are found to be anomalously enhanced, especially at the BEK. We show that this anomaly could
be naturally caused by the presence of CX emission.
2. Observations and Spectral Analysis
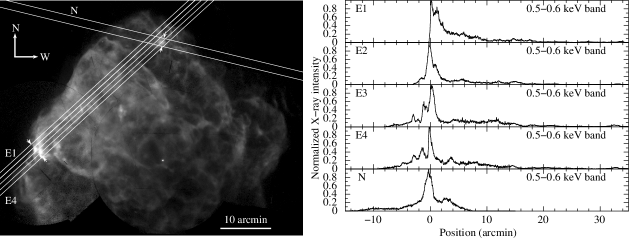
The NK and BEK were observed by XMM-Newton on 2003 April 17 (Obs.ID 0150150101) and 2003 May 21 (Obs.IDs 0150150201 and 0150150301), respectively, in order to obtain high-resolution spectra using the RGS. The dispersion directions of the RGS are 76∘.4 (NK) and 132∘.3 (BEK) counterclockwise from the north, as shown in Fig. 1, which is an X-ray image of Puppis A generated from existing XMM-Newton and Chandra data. In this paper, we mainly focus on the RGS data, while we also utilize data taken by the European Photon Imaging Camera (EPIC: Turner et al., 2001; Strüder et al., 2001) to support our RGS analyses. The exposure times after removing intervals affected by soft protons are 13.5 ks and 20.8 ks for the NK and BEK, respectively. All the raw data are processed using version 11.0.0 of the XMM Science Analysis Software and the latest calibration data files available at the time of the analysis.
Since the RGS is a slitless spectrometer, off-axis sources along the dispersion direction are detected at wavelength positions shifted with respect to the on-axis source. Spatial displacement of 1′ corresponds to a wavelength shift of 0.138 Å(or 4 eV/arcmin at 0.6 keV) for the first spectral order. Because the BEK and the NK are fairly compact (2′–3′) features with much higher surface brightness than their surroundings, the RGS is capable of producing high-resolution spectra for them, with an order-of-magnitude better resolution than nondispersive CCDs. In fact, there are a number of successful RGS observations not only of moderately extended SNRs in the LMC/SMC (e.g., Rasmussen et al., 2001), but also of a bright knot along the northwestern rim of SN 1006 (Vink et al., 2003).
As shown in Fig. 1, we divide the eastern RGS field of view into four sectors spaced by 0′.8 along the cross-dispersion axis, while we extract one spectrum from the 1′.6-width region for the north. In this way, we mitigate the photon number difference between the BEK and the NK. Also, slicing the BEK region allows us to generate more accurate RGS response files than the response file for the entire BEK region as we describe below. We smooth RGS responses originally designed for point sources, based on emission profiles along the dispersion direction with the rgsrmfsmooth software. For the input to the software, we arrange the X-ray images such that Chandra covers regions around the BEK/NK while XMM-Newton covers the remaining regions, and we take account of vignetting effects of XMM-Newton’s X-ray telescope. We generate energy-dependent RGS responses using energy-band images in 0.35–0.4 keV, 0.4–0.5 keV, 0.5–0.6 keV, 0.6–0.7 keV, 0.7–0.85 keV, 0.85–0.97 keV, 0.97–1.2 keV, and 1.2–1.5 keV. Figure 1 right shows the X-ray emission profiles in 0.5–0.6 keV for the five regions. These profiles, smoothed by the point spread function of the telescope, become the RGS responses themselves for the corresponding energy band. We note from this figure that the contribution from the NK in BEK spectra is almost negligible due to vignetting effects (the NK is slightly seen around x33′ in the upper four panels in Fig. 1 right).
For RGS background (BG), we use a blank sky observation (Lockman hole: Obs.ID 0147511601) for which the RGS spectrum is free from apparent line emission. In addition, we need to subtract local BG, since the Vela SNR is superposed on Puppis A. To estimate local BG, we simulate RGS spectra based on plasma parameters derived by modeling EPIC spectra outside Puppis A. The simulated local BG is added to the blank sky spectrum, resulting in a total BG. The total BG is dominated by local BG, and is less than 1% of the source emission. As for the EPIC BG, we use blank-sky data prepared by Read & Ponman (2003). Since X-ray emission from Vela is much weaker than the BEK/NK features, especially in the higher energy band, we do not take account of local BG for the EPIC spectra.
Figure 2 shows BG-subtracted spectra for the five regions. To make the best use of XMM-Newton’s capability, three different data sets are analyzed together: the first order RGS spectra below 0.6 keV, the second order RGS spectra in the 0.65–1.5 keV band, and the MOS spectra above 1.1 keV. Note that the second order RGS spectra, which show the best spectral resolution among all the X-ray spectrometers onboard XMM-Newton, do not cover the energy range below 0.65 keV, and that above 1 keV the signal-to-noise ratio of the EPIC is much better than that of the RGS. We sum spectra from two co-aligned RGS spectrometers, RGS1 and RGS2, to improve photon statistics. We extract MOS spectra from the same sliced regions as the RGS, limiting around the BEK or the NK. As expected from previous X-ray observations, the RGS spectra are dominated by a number of emission lines, including C Ly @0.375 keV, N He triplet @0.42 keV, N Ly+N He @0.5 keV, O He triplet @0.57 keV, O Ly @0.654 keV, O He @0.666 keV, Fe L (3s2p) complex @0.73 keV, O Ly @0.775 keV, Fe L (3d2p) complex @0.83 keV, Ne He triplet @0.92 keV, Mg He triplet @1.35 keV, and Si He triplet @1.85 keV. In particular, as shown in the right (and left) panels of Fig. 2, forbidden and resonance lines in the He triplet of O (N and Ne as well) are clearly resolved for the first time for the two knots. We also note that this is the first clear detection of C and N lines from Puppis A.
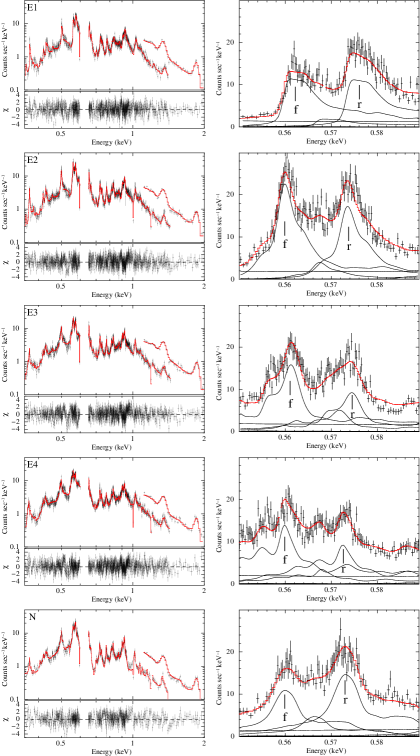
We fit the spectra with an absorbed bremsstrahlung component plus 49 Gaussian components. Free parameters are the H column density , the electron temperature , and the normalization of the bremsstrahlung component. We also allow normalizations of most Gaussians to vary freely. Since O Ly and O Ly lines fall in the Fe L line forest, we fix the normalization ratios of O Ly/O Ly and O Ly/O Ly to 0.3 and 0.1 as are expected at 0.5 keV (Hwang et al., 2005). We note that the values of the bremsstrahlung component are mainly determined by continuum emission above 1.5 keV. Thus, fixing ratios of Gaussian normalizations does not affect the measurements. Line centers of the most prominent 21 Gaussians are left as free parameters, while those for C He and two Fe L lines (G111We use the same labeling for Fe XVII L lines as in Gillaspy et al. (2011). and D) are systematically shifted with respect to those of their neighboring lines (H and E). Other weak Gaussians’ centers are fixed to the theoretically expected values (Smith et al., 2001). The widths of all Gaussians are fixed to zero, since significant broadening is not required from a statistical point of view; note that apparent line widths seen in the RGS spectra in Fig. 2 are due to spatial extent of the source as described in the second paragraph in this section. With this fitting strategy, we obtain fairly good fits for all the spectra as shown in Fig. 2. The fit results are summarized in Table 1, where we omit weak Gaussians.
The values of are consistent with recent X-ray measurements (Hwang et al., 2005, 2008; Katsuda et al., 2010). The values are somewhat lower than previous results. However, prominent line intensities, which are essential for the discussion below, are not affected by the temperature difference, as the fraction of underlying continuum is very small. Line intensity ratios are basically reproduced by thermal emission models having plausible plasma parameters (i.e., electron temperature of 0.5 keV and ionization timescale of 1011 cm-3 s: Hwang et al., 2005).
On the other hand, as summarized in Table 2, the intensity ratios of forbidden line to resonance line in He triplets (hereafter, F/R ratios) are inconsistent with model predictions, for which we assume a plane-parallel shock model with a distribution of ionization timescales appropriate for a plane-parallel shock (vpshock model in conjunction with augmented NEI version 2.0: Borkowski et al., 2001); this emission model is often used to describe X-ray spectra from Puppis A. In calculating the model F/R ratio, we take a reasonable range of plasma conditions in the BEK ( = 0.3–0.7 keV and = 1010–51011 cm-3 s: Hwang et al., 2005), given that the RGS spectra are integrated along the dispersion direction as well as the line of sight. From Table 2, we see that the F/R-ratio anomaly for O and Ne ions is particularly evident in the E2–E4 regions compared with that in the E1 and NK regions, while the F/R ratios for N ions are marginally consistent among the five regions. The discrepancy can not be solved by multiple plasma components, since the model predictions already consider various (reasonable) plasma conditions. Although the ratios could be reproduced at a very low value of 109 cm-3 s, in such a low ionization condition, no Ne-like Fe L lines nor H-like Ne lines can be emitted, which is in stark contrast to the observed X-ray spectra. Thus, the F/R ratios cannot be reproduced by thermal emission models.
We next investigate whether the anomalous F/R ratio is due to reduction of the resonance line or increase of the forbidden line, by comparing the observed line intensities with model expectations. To this end, we fit the X-ray spectra (in the E2 region) with an absorbed vpshock model, excluding the particularly anomalous O He triplets. After fitting, we recover the O He triplet lines to compare the data with the model. We find that the intensity of the forbidden line inferred from the vpshock model is weaker than the data and that the model intensity of the resonance line is stronger. This result suggests both reduction of the resonance line and increase of the forbidden line. However, we need to be careful about limitations of our spectral modeling. This is because the X-ray emission other than the O He triplets may also not be interpreted in the frame of pure thermal emission models, due to contamination of CX emission, effects of resonance line scattering, or some other processes. If this is the case, the plasma parameters including O abundance, the electron temperature, and the ionization timescale inferred by our thermal emission modeling should have some systematic uncertainties, leading to an incorrect model intensity of the O He triplet. Therefore, it is difficult to infer the model O He intensity accurately enough at this point. We will revisit this issue in our future work that will include developments of more sophisticated emission models.
3. Discussions
We have presented high-resolution X-ray spectra of the BEK/NK features in the Galactic SNR Puppis A. The forbidden and resonance lines in the He triplets are clearly resolved, and their intensity ratios (F/R) are found to be generally higher than predictions from thermal plasma models. This anomaly is particularly evident in the BEK, while the RGS spectrum of the NK as well as the Einstein FPCS spectra of the northeastern portion (Winkler et al., 1981a, b) are closer to predictions of thermal models.
There are two ways to enhance the F/R ratio: (1) an increase of the forbidden line flux or (2) a reduction of the resonance line flux. Possible mechanisms for the former are either H-likeHe-like recombination/CX processes or inner-shell ionization of Li-like ions due to the higher statistical weight. As for the latter, we consider resonance-scattering effects; only resonance lines are scattered out of the line of sight because of their higher optical depths. Among several SNRs for which high-resolution spectroscopy has been performed, anomalous F/R ratios have only been reported in two LMC SNRs, DEM L71 (van der Heyden et al., 2003) and 0506–68 a.k.a N23 (Broersen et al., 2011). In these cases, the authors attributed the anomaly to recombination and/or resonance scattering, paying little or no attention to CX. Below we discuss which mechanism mainly works for the case of Puppis A.
| Component | Parameter | Region | ||||
|---|---|---|---|---|---|---|
| E1 | E2 | E3 | E4 | N | ||
| Absorption | (cm-2) | 2.700.01 | 2.800.01 | 2.800.01 | 2.850.01 | 2.580.01 |
| Bremsstrahlung | e (keV) | 0.32 | 0.31 | 0.33 | 0.32 | 0.30 |
| Normalizationa | 526493 | 9124133 | 6744117 | 7808117 | 539790 | |
| Gaussian: C Ly+Si L+S L | Center (eV) | 366.8 | 367.2 | 366.7 | 365.4 | 367.4 |
| Normalizationa | 82280 | 1486118 | 1257139 | 1723139 | 38052 | |
| N He (f) | Center (eV) | 419.2 | 419.20.3 | 418.40.5 | 419.70.5 | 420.5 |
| Normalizationa | 10018 | 20126 | 14526 | 24333 | 8216 | |
| N He (i) | Center (eV) | 426b | 426b | 426b | 426b | 426b |
| Normalizationa | 15 | 5723 | 7224 | 57 | 1815 | |
| N He (r) | Center (eV) | 429.7 | 430.1 | 429.90.5 | 429.70.5 | 430.60.5 |
| Normalizationa | 14617 | 22324 | 16923 | 19927 | 7215 | |
| C Ly | Center (eV) | 434.9 | 435.1 | 435.2 | 434.7 | 435.2 |
| Normalizationa | 6014 | 8718 | 5518 | 8722 | 5113 | |
| C Ly | Center (eV) | 459b | 459b | 459b | 459b | 459b |
| Normalizationa | 258 | 3110 | 2410 | 1412 | ||
| N Ly+He | Center (eV) | 499.40.2 | 500.2 | 499.8 | 499.6 | 499.6 |
| Normalizationa | 1439 | 25413 | 22212 | 25214 | 16211 | |
| O He (f) | Center (eV) | 559.8 | 560.70.1 | 560.50.5 | 560.20.5 | 561.20.2 |
| Normalizationa | 70527 | 116736 | 104236 | 111938 | 41723 | |
| O He (i) | Center (eV) | 566.8 | 568.3 | 570.7 | 568.5 | 567.5 |
| Normalizationa | 10724 | 19030 | 29831 | 25534 | 16822 | |
| O He (r) | Center (eV) | 573.10.2 | 574.1 | 573.40.1 | 572.90.1 | 574.3 |
| Normalizationa | 60125 | 77130 | 52731 | 64633 | 49221 | |
| O Ly | Center (eV) | 652.7 | 653.40.2 | 653.00.2 | 652.80.2 | 653.40.4 |
| Normalizationa | 97938 | 122347 | 115446 | 132951 | 63136 | |
| O He | Center (eV) | 664.40.8 | 665.0 | 665.4 | 666.0 | 667.01 |
| Normalizationa | 16124 | 28529 | 19727 | 13629 | 11017 | |
| O He | Center (eV) | 699.0 | 700.70.6 | 698.9 | 698.2 | 700.71.1 |
| Normalizationa | 688 | 7410 | 6511 | 7413 | 429 | |
| Fe L (G+H) | Centerc (eV) | 724.9 | 725.1 | 724.9 | 725.2 | 725.2 |
| Normalizationa | 247 | 362 | 331 | 332 | 156 | |
| Fe L (F) | Center (eV) | 739.3 | 738.5 | 739.3 | 738.1 | 738.9 |
| Normalizationa | 8911 | 15613 | 9412 | 9912 | 658 | |
| O Ly | Center (eV) | 773.5 | 773.80.3 | 773.3 | 772.9 | 773.70.5 |
| Normalizationa | 1517 | 1878 | 1607 | 1698 | 976 | |
| Fe L (D+E) | Centerc (eV) | 810.60.8 | 810.10.2 | 810.00.4 | 810.00.4 | 810.10.7 |
| Normalizationa | 74 | 110 | 98 | 90 | 50 | |
| Fe L (C) | Center (eV) | 826.6 | 826.10.5 | 825.60.5 | 826.10.5 | 826.2 |
| Normalizationa | 1056 | 1730.8 | 1357 | 1528 | 785 | |
| Ne He (f)+Fe L | Center (eV) | 902.00.6 | 903.3 | 902.6 | 902.6 | 903.5 |
| Normalizationa | 1226 | 1857 | 1566 | 1757 | 754 | |
| Ne He (i)+Fe L | Center (eV) | 915b | 915b | 915b | 915b | 915b |
| Neormalizationa | 636 | 537 | 686 | 507 | 184 | |
| Ne He (r)+Fe L | Center (eV) | 921.2 | 921.6 | 921.2 | 921.8 | 922.40.2 |
| Normalizationa | 1416 | 2247 | 1686 | 1887 | 1115 | |
| Ne Ly+Fe L | Center (eV) | 1023.6 | 1022.5 | 1020.5 | 1022.1 | 1020.4 |
| Normalizationa | 835 | 976 | 965 | 1026 | 353 | |
| /d.o.f. | 1423/968 | 1740/1151 | 1698/1114 | 1664/1181 | 949/612 | |
Note. — aIn units of photons cm-2 s-1.
bFixed values.
cLine centers of H and E are shown, while those of G and D are systematically shifted by +2 eV from H and E, respectively.
| Element | Thermal predictionsa | Region | ||||
|---|---|---|---|---|---|---|
| E1 | E2 | E3 | E4 | N | ||
| N F/R | 0.38–0.52 | 0.680.15 | 0.900.15 | 0.860.19 | 1.220.23 | 1.140.33 |
| O F/R | 0.42–0.56 | 1.170.07 | 1.510.08 | 1.980.13 | 1.730.11 | 0.850.06 |
| Neb F/R | 0.44–0.71 | 0.870.06 | 0.830.04 | 0.930.05 | 0.930.05 | 0.680.05 |
| N F/I | 5.8–6.4 | 7.9 | 3.491.46 | 2.020.76 | 3.7 | 4.483.73 |
| O F/I | 4.2–5.1 | 6.581.49 | 6.140.99 | 3.490.38 | 4.390.60 | 2.480.35 |
| Neb F/I | 3.3–4.9 | 1.920.20 | 3.450.47 | 2.300.22 | 3.460.50 | 4.010.87 |
| (N Ly + N He) / N He | 0.12–0.9 | 0.580.07 | 0.530.05 | 0.580.06 | 0.540.06 | 0.940.13 |
| O Ly / O He | 0.01–1.03 | 0.690.03 | 0.570.03 | 0.620.03 | 0.660.03 | 0.590.04 |
| Neb Ly / Neb He | 0–0.83 | 0.250.02 | 0.210.01 | 0.240.01 | 0.250.02 | 0.170.02 |
| Fe L (F+G+H)/C | 1.4–2.6 | 3.190.26 | 2.980.14 | 3.150.23 | 2.840.21 | 2.830.26 |
Note. — aPredictions by the vpshock model at (, ) (0.3–0.7 keV, 1010–51011 cm-3 s Hwang et al., 2005). bThe observed values could be affected by Fe L lines.
Effects of resonance scattering can be evaluated for each emission line from its optical depth, (e.g., Kaastra & Mewe, 1995). We calculate the value of using the BEK’s typical plasma parameters; i.e., 0.5 solar abundances, 0.5 keV, 1011 cm-3 s, and the hydrogen column density of the X-ray–emitting plasma 1019 cm-2 from 4 cm-3 (Arendt et al., 2010) multiplied by an assumed plasma depth of 3.2 pc, which corresponds to the 3′ size of the BEK at a distance of 2.2 kpc (Reynoso et al., 2003, we refer to this distance hereafter). To derive oscillator strengths and ion fractions, we utilize the data bases from CHIANTI (Dere et al., 2009) and SPEX (specifically, the neij code: Kaastra, et al., 1996), respectively. Then, assuming no microturbulence, we calculate and the escape probability, . The escape probabilities for resonance lines in He triplets of N, O, and Ne are obtained to be 1, 0.92, and 0.92, respectively, while those for forbidden lines are all unity because of their very small oscillator strengths. Therefore, we find that effects of resonance line scattering likely play a modest role, if any, in explaining the observed F/R ratios for N and O in all the five regions, while the F/R anomaly for Ne could be explained by the effects. Whereas optical depths could differ with changing the assumed plasma depth and microturbulence velocity, the difference seems small in our case. For example, in order to reproduce the observed F/R ratio in the E3 region, we need a plasma depth of 77 pc (or 2∘) which is obviously too long for this region. Also, a microturbulence velocity of 100 km s-1 (which is statistically allowed by our RGS spectral analysis) would reduce to 0.12 and increase to 0.95 for a reasonable plasma depth of 3.2 pc. It should be noted that the Fe L line ratio, (F+G+H)/C, should be more sensitive to resonance scattering than the O VII F/R ratio: we expect 0.02 and 0.99 for F+G+H and 0.43 and 0.84 for C for the plasma conditions in the BEK. We find in Table 2 that the observed (F+G+H)/C ratios are indeed slightly higher than those of the vpshock prediction. While the measured line ratios suggest the presence of resonance scattering for the Fe L lines, the degree of the effect is not as significant as what is expected from the anomaly of O VII F/R ratios. Therefore, we are required to examine other possibilities.
X-ray–emitting recombining plasmas have been recently found in several SNRs (e.g., Yamaguchi et al., 2009; Uchida et al., 2012, and references therein). The recombining plasma is characterized by strong radiative recombination continua (RRC) and enhanced Ly/He ratios. We find that signatures of RRCs (i.e., strong recombination edges) are not evident in the RGS and MOS spectra in Fig. 2 (and also Suzaku XIS spectra which are not shown in this paper), although the Fe L and/or other line emission might make it difficult for us to detect such signatures. Also, the Ly/He ratios for N, O, and Ne in the five regions are all well within thermal predictions as can be seen in Table 2, while the BEK regions show somewhat larger ratios than those in the NK. In addition, recombination processes would enhance the Fe L line ratio (F+G+H)/(C+D+E) to 25 (Liedahl et al., 1990), which is inconsistent with our RGS measurements of 1.2–2.4 in the BEK and the NK. Furthermore, our spectral fitting of the combined RGS and MOS spectra with a recombining plasma model (the cie model in SPEX: Kaastra, et al., 1996) failed to reproduce the entire X-ray spectrum; the model requires too low an electron temperature to explain emission above 1 keV. These investigations indicate that the plasma here is not recombining.
Signatures of inner-shell ionization processes of Li-like ions can be found as Li-like satellite lines as well as an enhanced forbidden-to-intercombination (F/I) ratio compared with collisionally excited emission (e.g., Porquet et al., 2010). In the RGS spectra, there is no indication of satellite lines, however. Also, the measured F/I ratios of He triplets in Table 2 are all marginally consistent with thermal expectations; we need to take account of considerable systematic uncertainties on the intensity of the intercombination line due to its weakness compared to the surrounding forbidden and resonance lines. These facts led us to conclude that inner-shell ionization processes are not working efficiently in this region. We note that, whereas line emission from Li-like O is seen in the far-ultraviolet spectrum of the BEK (Blair, et al., 1995), the abundance of Li-like O would be small in the X-ray–emitting region.
We next assess the feasibility of the CX scenario by calculating the expected CX flux, following Lallement (2004). The volume emissivity of CX is expressed as = . We let be the CX cross section between neutral H and ions of interest, the neutral H density, the ion density, and the relative H-ion velocity. We first consider the O VII forbidden line, so that is 3.310-15 cm-2 (Bodewits, et al., 2007). The value of can be taken from the density of cold/warm clouds immersed in X-ray–emitting plasma, which is 50 cm-3 (Teske & Petre, 1987). The value of is the density of O VIII in the hot plasma, which is 210-4 cm-3 for the BEK (Hwang et al., 2008; Arendt et al., 2010). We assume that = 500 km s-1, roughly the shock velocity that can produce the X-ray–emitting plasma in the BEK. These parameters give 1.710-9 photons cm-3 s-1. The CX-emitting volume is calculated by the thickness of the CX layer, , times the interface area between the clouds and the hot plasma. The value of is equated to the mean free path for H-proton CX. Thus, is of the order of 1/, with being the H-proton CX cross section (10-15 cm-2: McClure, 1966) and being the proton density in the plasma (4 cm-3: Arendt et al., 2010). Considering that only 30% neutral H can charge-exchange before getting collisionally ionized (Lallement, 2004) for the BEK’s plasma condition, we obtain an effective CX thickness of 7.51013 cm. An assumed cylindrical interface with a diameter of would give a surface area of the CX layer of 31037 cm2 for each region, resulting in a CX-emitting volume of 2.31051 cm3. With and the emitting volume estimated, and an assumption of a uniform , we obtain an unabsorbed CX flux for the O VII forbidden line of 610-3 photons cm-2 s-1 for each region in the BEK. Next, we repeat the calculation for forbidden lines of He-like N and Ne. Using the relation that is proportional to the atomic number, Z, and the ion number densities of cm-3 and cm-3 (which are based on plasma parameters in Hwang et al., 2005), we estimate the unabsorbed CX fluxes of the N VI and Ne IX forbidden lines to be 10-4 photons cm-2 s-1 and 10-3 photons cm-2 s-1, respectively.
We should keep in mind that the uncertainty of the CX flux estimate is fairly large. For example, we implicitly assume that hydrogen in the cold/warm clouds is entirely neutral due to rapid recombination caused by radiative cooling in the dense cloud. The hydrogen must be partially ionized, however, resulting in a lower CX flux. On the other hand, hot neutral hydrogen formed after H-proton CX reactions, dust destruction, and unshocked cold neutrals going through the (collisionless) shock would all provide additional neutrals in the hot plasma, increasing the CX flux. Also, the area of the interface region is quite uncertain. These factors suggest that our CX flux estimate should only be considered accurate to an order of magnitude.
To compare the expected CX flux with our measurements in Table 1, we need to correct for the spatial-integration factor. This is because the expected flux is estimated for the BEK feature, whereas the fluxes in Table 1 are integrated along the RGS dispersion direction. To estimate the correction (reduction) factors, we extract EPIC spectra from 3′-long regions including the BEK, and normalize the RGS flux to equalize the EPIC flux in each region. In this way, the correction factors are derived to be 3.7–4.5 for the four BEK regions. The fluxes of the N, O, and Ne He forbidden lines are, respectively, derived to be 510-3 photons cm-2 s-1, 310-2 photons cm-2 s-1, and 510-3 photons cm-2 s-1 for each region in the BEK. We thus find order-of-magnitude agreement with the expected CX fluxes. Given the considerable uncertainty of the expected CX flux, we cannot rule out the CX scenario with this level of agreement. In addition, there are two pieces of observational evidence supporting the CX scenario. First, optically-emitting clouds, which we think are the major electron donors, are seen only in the BEK, whereas such clouds are not detected in the other regions including the NK and the Einstein FPCS field of view. Second, the N/O and Ne/O abundance ratios based on CX fluxes in the He triplets for the BEK region are consistent with previous X-ray measurements (N/O1 and Ne/O2, respectively). Here, we applied the same method used in Liu et al. (2011) who modeled He triplets with a thermal emission model plus Gaussians to represent the CX emission for the starburst galaxy M82. In this context, we conclude that CX emission is a promising mechanism for explaining the anomalous F/R ratios observed in Puppis A.
One might expect to find other spectral signatures of CX in addition to the He line ratios. However, CX spectral properties are strongly dependent on and the target neutrals (e.g., Beiersdorfer, et al., 2001, 2003), and investigation of CX emission is still ongoing. Therefore, further discussion calls for more sophisticated CX emission modeling, which is beyond the scope of this paper and is left as future work.
4. Conclusions
High-resolution X-ray spectra of the cloud-shock interaction regions, the BEK and the NK, in Puppis A have revealed anomalous He triplet ratios: in particular, the O He F/R line ratios are found to be 2 in the BEK. This anomalous ratio can be naturally interpreted as the result of the presence of CX emission, although resonance-scattering effects might be non-negligible.
Future observations with the non-dispersive Soft X-ray Spectrometer (SXS: Mitsuda et al., 2010) onboard the Astro-H satellite (Takahashi et al., 2010) will allow for further tests for the CX scenario and other possibilities. While the RGS can perform high-resolution spectroscopy only for bright knotty features, the SXS with expected spectral resolution of 4 eV FWHM and spatial resolution of 1′ HPD (Serlemitsos et al., 2010) will enable us to reveal a spatial distribution of the F/R ratios of the knotty features and their surroundings. The CX scenario can then be examined by seeing if there is a spatial correlation between the F/R ratios and optical clouds which we here consider to be main electron donors. We expect that other large Galactic SNRs, especially the Cygnus Loop introduced in Section 1, would be also promising sites to check the presence of CX X-ray emission.
References
- Arendt et al. (2010) Arendt, R. G., Dwek, E., Blair, W. P., Ghavamian, P., Hwang, U., Long, K. S., Petre, R., Rho, J., & Winkler, P. F. 2010, ApJ, 725, 585
- Beiersdorfer, et al. (2001) Beiersdorfer, P., Lisse, C. M., Olson, R. E., Brown, G. V., Chen, H. 2001, ApJ, 549, L147
- Beiersdorfer, et al. (2003) Beiersdorfer, P., et al. 2003, Science, 300, 1558
- Blair, et al. (1995) Blair, W. P., Raymond, J. C., Long, K. S., & Kriss, G. A. 1995, ApJ, 454, L35
- Bodewits, et al. (2007) Bodewits, D., et al. 2007, A&A, 469, 1183
- Borkowski et al. (2001) Borkowski, K. J., Lyerly W. J., & Reynolds, S. P. 2001, ApJ, 548, 820
- Broersen et al. (2011) Broersen, S., Vink, J., Kaastra, J., & Raymond, J. 2011, A&A, 535, 11
- den Herder et al. (2001) den Herder, J. W., et al. 2001, A&A, 365, L7
- Dere et al. (2009) Dere, K.P., Landi, E., Young, P.R., Del Zanna, G., Landini, M., & Mason, H.E. 2009, A&A, 498, 915
- van der Heyden et al. (2003) van der Heyden, K. J., Bleeker, J. A. M., Kaastra, J. S., & Vink, J. 2003, A&A, 406, 141
- Dubner & Arnal (1988) Dubner, G. M., & Arnal, E. M. 1988, A&AS, 75, 363
- Flanagan et al. (2004) Flanagan, K. A., et al. 2004, ApJ, 605, 230
- Gillaspy et al. (2011) Gillaspy, J. D., Lin, T., Tedesco, L., Tan, J. N., Pomeroy, J. M., Laming, J. M., Brickhouse, N., Chen, G.-X., & Silver, E. 2011, ApJ, 728, 132
- Hwang et al. (2005) Hwang, U., Flanagan, K. A., & Petre, R. 2005, ApJ, 635, 355
- Hwang et al. (2008) Hwang, U., Petre, R., & Flanagan, K. A. 2008, ApJ, 676, 378
- Kaastra & Mewe (1995) Kaastra, J. S., Mewe, R., 1995, A&A, 302, L13
- Kaastra, et al. (1996) Kaastra, J. S., Mewe, R., Liedahl, D. A., Singh, K. P., White, N. E., & Drake, S. A. 1996, A&A, 314, 547
- Katsuda et al. (2010) Katsuda, S., Hwang, U., Petre, R., Park, S., Mori, K., & Tsunemi, H. 2010, ApJ, 714, 1725
- Katsuda et al. (2011) Katsuda, S., et al. 2011, ApJ, 730, 24
- Kirshner & Chevalier (1978) Kirshner, R. P., & Chevalier, R. A. 1978, A&A, 67, 267
- Lallement (2004) Lallement, R. 2004, A&A, 422, 391
- Liedahl et al. (1990) Liedahl, D., Kahn, S. M., Osterheld, A. L., & Goldstein, W. H. 1990, ApJ, 350, L37
- Liu et al. (2011) Liu, J., Mao, S., & Wang, Q. D. 2011, MNRAS, 415, L64
- McClure (1966) McClure, G. W. 1966, Physical Review, 148, 47
- Mitsuda et al. (2010) Mitsuda, K., et al. 2010, SPIE, 7732, 773211
- Petre et al. (1982) Petre, R., Kriss, G., A., Winkler, P. F., & Canizares, C. R. 1982, ApJ, 258, 22
- Porquet et al. (2010) Porquet, D., Dubau, J., & Grosso, N. 2010, Space Sci. Rev., 157, 103
- Rasmussen et al. (2001) Rasmussen, A. P., Behar, E., Kahn, S. M., den Herder, J. W., & van der Heyden, K. 2001, A&A, 365, L231
- Reynoso et al. (2003) Reynoso, E. M., Green, A. J., Jhonston, S., Dubner, G. M., Giacani, E. B., & Goss, W. M. 2003, MNRAS, 345, 671
- Read & Ponman (2003) Read, A., M., & Ponman, T. J. 2003, A&A, 409, 395
- Serlemitsos et al. (1973) Serlemitsos, P. J., Boldt, E. A., Holt, S. S., Ramaty, R., & Brisken, A. F. 1973, ApJ, 184, L1
- Serlemitsos et al. (2010) Serlemitsos, P. J., Soong, Y., Okajima, T., & Hahne, D.J. 2010, SPIE, 7732, 77320
- Smith et al. (2001) Smith, R. K., Brickhouse, N. S., Liedahl, D. A., & Raymond, J. C. 2001, ApJ, 556, L91
- Strüder et al. (2001) Strüder, L., et al. 2001, A&A, 365, L18
- Takahashi et al. (2010) Takahashi, T., et al. 2010, SPIE, 7732, 77320Z
- Teske & Petre (1987) Teske, R. G., & Petre, R. 1987, ApJ, 314, 673
- Turner et al. (2001) Turner, M. J. L., et al. 2001, A&A, 365, L27
- Uchida et al. (2012) Uchida et al. 2012, PASJ submitted.
- Vink et al. (2003) Vink, J., Laming, J. M., Gu, M. F., Rasmussen, A., & Kaastra, J. S. 2003, ApJ, 587, L31
- Winkler et al. (1981a) Winkler, P. F., Clark, G. W., Markert, T. H., Petre, R., & Canizares, C. R. 1981a, ApJ, 245, 574
- Winkler et al. (1981b) Winkler, P. F., Clark, G. W., Markert, T. H., Kalata, K., Schnopper, H. W., & Canizares, C. R. 1981b, ApJ, 246, 27
- Winkler et al. (1988) Winkler, P. F., Tuttle, J. H., Kirshner, R. P., & Irwin, M., J. 1988, in IAU Colloq. 101: Supernova Remnants and the Interstellar Medium, ed. R. S. Roger & T. L. Landecker, 65
- Wise & Sarazin (1989) Wise, M. W., & Sarazin, C. L. 1989, ApJ, 345, 384
- Yamaguchi et al. (2009) Yamaguchi, H., Ozawa, M., Koyama, K., Masai, K., Hiraga, J. S., Ozaki, M., & Yonetoku, D. 2009, ApJ, 705, L6