Flow and clogging in a silo with an obstacle above the orifice
Abstract
In a recent paper [Zuriguel et al., Phys. Rev. Lett. 107, 278001 (2011)] it has been shown that the presence of an obstacle above the outlet can significatively reduce the clogging probability of granular matter pouring from a silo. The amount of this reduction strongly depends on the obstacle position. In this work, we present new measurements to analyze different outlet sizes, extending foregoing results and revealing that the effect of the obstacle is enhanced as the outlet size is increased. In addition, the effect of the obstacle position on the flow rate properties and in the geometrical features of arches is studied. These results reinforce previous evidence of the pressure reduction induced by the obstacle. In addition, it is shown how the mean avalanche size and the average flow rate are not necessarily linked. On the other hand, a close relationship is suggested between the mean avalanche size and the flow rate fluctuations.
pacs:
45.70.-n, 45.70.Mg, 89.40.-aI Introduction
When a group of particles flow through a narrow bottleneck –an opening not much larger than the particle size– the dissipative interactions among the particles may lead to the spontaneous development of clogs. These kind of jams can be observed in grains discharging from a silo to1 , people escaping from a room Helbing or vehicle traffic in a highway. Although the nature of the particles is wildly different in each one of these instances, they share interesting resemblances which suggest that a general theory could describe at least the most important features of the phenomenon Helbingexponential . One of the most striking similarities among people escaping from a room and beads passing through a narrowing is that the distribution of avalanche sizes (or bursts) displays an exponential behavior.
Generally speaking, the avalanche size is defined as the number of particles passing through the bottleneck between two consecutive clogs. For the case of inert beads, the avalanche size is easily determined, as the flow is halted permanently and for good by arches formed just above the exit orifice iker1 ; to2 ; janda1 . The flow can only be restored by breaking such arches with an external energy input. At that moment, a new avalanche begins. Therefore, the avalanche size is defined as the number of particles that get out of the silo from the instant when such an energy input is applied, till the moment when an arch blocks the orifice and ends the outpouring. For the case of people, or other live beings, the definition of avalanche is more problematic due to the fact that the clogs, left to their own, last just for a short time. Hence, the only way to define a clog is to choose a certain time lapse during which no individual has come out from the enclosure Saloma . Once the clogs are thus specified, the avalanche sizes are just measured as the number of individuals that get out between two consecutive clogs. Obviously, in this case the avalanche sizes depend on the time lapse chosen to determine whether clogging has occurred, whereas in the case of inert particles this arbitrariness is absent. This difference in the nature of the clogs may be at the hearth of a remarkable fact: while the exponential behavior is general in the case of granular flows iker1 ; to2 ; janda1 , it is only observed for very small door sizes in crowd dynamics Helbing ; Saloma .
The exponential distribution of avalanche sizes for inert beads was explained in iker1 in terms of the probability that a particle passes through the outlet without getting stuck. Assuming that this probability remains constant during the whole avalanche, the distribution of avalanche sizes was written as
| (1) |
where is, of course, the probability that a particle blocks the orifice. The mean avalanche size , i.e. the first moment of the distribution described by Eq. 1, can be written as:
| (2) |
As expected, if the probability of clogging increases, then the mean avalanche size decreases.
In both cases –people escaping from a room and particles outpouring from a silo– the enlargement of the outlet leads to an increase in the size of bursts (or avalanches). A lingering question is whether there exists an outlet size above which clogging is impossible. For the case of a silo filled with grains, debate still goes to2 ; janda1 . Nevertheless, outlet sizes larger than or times the particle size generate immense avalanches, so in practical terms two regimes can be distinguished: one of clogging for small outlet sizes, and another one of no clogging for big outlet sizes.
Another feature of clogging that is shared by people in a crowd and particles in a silo is the role of pressure. In humans, an increase of pressure caused by panic seems to be a key ingredient for the appearance of clogging Helbing . Parisi and Corso Parisi have shown that the evacuation time for a room as a function of the pedestrians’ desired velocity (which is a variable considered in the model) presents a minimum for intermediate velocities. A very high desired velocity leads to an increase in the evacuation time due to clogs. In granular matter, a low pressure (which can be attained in shallow layers of grains) is found to effectively prevent clogging prlinsert . Low pressure is also behind an ingenious idea sometimes used when trying to improve the flow of pedestrians through a bottleneck: the placement of an obstacle before the exit Kirchner ; prlinsert ; Parisi ; Yanagisawa ; Frank ; Shiwakoti . The size of the column –the obstacle– is typically of the order of a pedestrian and the position varies from one study to another, although it is generally close to the exit (at most at a distance of 2 or 3 pedestrian sizes). In the case of silos, the placement of an obstacle above the outlet has also been used, but its relationship with clogging remains scantily explored. Instead, the placement of obstacles is usually aimed to improve the flow and to the reduction of undesirable wall stresses. Indeed, most of the studies about silos and obstacles are performed with such a large outlet size that clogging is practically impossible Tuzun ; Zelinski ; Yang_insert_silos ; Marroquin .
In a previous work we reported experimental evidence of the silo clogging reduction induced by the presence of an obstacle prlinsert . It was shown that the clogging probability could be reduced by almost two orders of magnitude if the obstacle position is properly selected. This important effect was attributed to a pressure reduction in the outlet neighborhood. Notably, the presumed pressure variation induced by the obstacle affects very little the flow rate. This result is in agreement with previous works, where it was proved that the pressure in a silo does not have a significant influence on the flow rate Pacheco ; Aguirre_belt . In this manuscript, we extend the range of previous results by analyzing the effect of the obstacle position for different sizes of both the outlet and the obstacle. Furthermore, we investigate the effect of the obstacle in the features of the flow rate and its fluctuations. Finally, the comparison between the arches formed in silos with and without an obstacle reveals meaningful geometrical differences which seem to be related to the pressure variation. The manuscript is structured as follows. First, we will explain the experimental setup and procedure. Then, we will show the generality of the effect caused by the obstacle regardless of outlet size. In the next two sections we will analyze the flow rate properties, in connection with clogging. Finally, we will relate the pressure reduction induced by the obstacle with the arch shape and we will draw some conclusions.
II Experimental procedure.
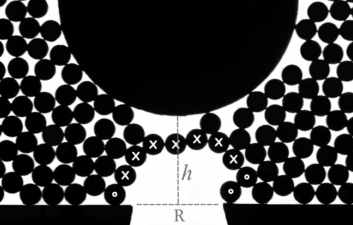
The experimental setup consists of a two dimensional rectangular silo 800 mm high and 200 mm wide. It is made of two glass sheets separated by two flat metal strips thick and 800 mm high. These metal bands are the side walls, so the distance between them (200 mm) fixes the width of the silo. The silo bottom is flat and formed by two facing metal flanges, so that their edges define the outlet size , which can be varied at will (Fig. 1). Above the bottom, a disk of diameter is placed vertically above the outlet center. In most of the experiments is set at , although in chapter V this value has been modified in order to study its effect in the discharge phenomenon. The distance from the bottom of the obstacle to the outlet (see Fig. 1) can be varied and is carefully measured with an accuracy of . As in a previous work prlinsert , the case of a silo without obstacle will be referred to as .
The silo is filled with a sample of monodisperse stainless steel beads with a diameter of . Hence, the grains are disposed between the two glass sheets conforming a monolayer. The silo filling is performed by pouring the grains along its whole width through a hopper at the top. After the silo filling, grains start to flow through the outlet until an arch blocks it. The particles are collected in a cardboard box placed on top of a balance. As the weight of one particle is known, the size of the avalanche –the number of particles fallen between two consecutive clogs– is easily calculated. Then, a picture of the region above the orifice is taken with a standard video camera and further analyzed in order to detect the position of every particle in the image. From these, the particles forming the blocking arch are obtained as explained in Garcimartin_arches . The experiment is resumed by blowing a jet of compressed air aimed at the orifice that starts a new avalanche. The experimental setup is automated and controlled by a computer. This allows us to register a large number of avalanches (between and ) and the corresponding arches at each run. Let us note that the silo is refilled whenever the level of grains falls below a preset lower limit of around ( times the width of the silo). The reason for this is to avoid pressure variations at the bottom due to the amount of grains in the silo; recall that the pressure at the base of a silo saturates and is therefore independent on the filling level as long as the height of the granular layer exceeds a certain level Duran .
Additionally, for each experimental condition, a number of movies were recorded of the region above the outlet with a high speed camera at frames per second during a total time lapse of seconds. These recordings allowed to accurately measure the moment at which each particle crosses the outlet (with a precision better than ms). From this, the flow rate (in number of particles per second) is calculated within time intervals of ms. It should be noted that the flow rate measurements were always performed well inside the avalanches. In particular, we always wait seconds after the beginning of the avalanche and we stop the measurement at least second before the end of the avalanche. In this way we intend to avoid any possible influence of a transient regime at the beginning or the end of the avalanche. We remark that, as reported before Janda_fluctus , it is possible to find values of within the avalanche. Such events were proposed to correspond to unstable clogs: arches that interrupt the flow of the particles for a short time but were not strong enough to durably clog the silo. From all the values of obtained (typically measurements for each experimental conditions) we calculated the average flow rate as well as its coefficient of variation.
III Clogging reduction. Dependence on the outlet size.
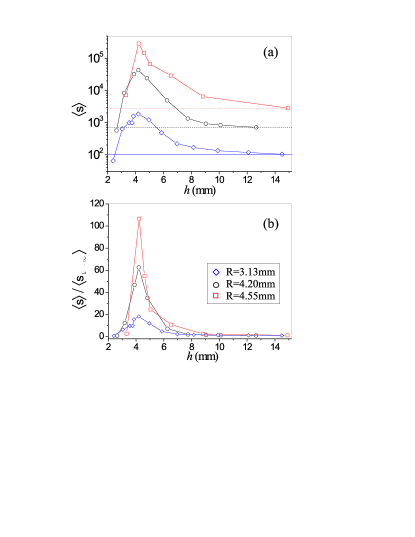
In a previous work, it was shown that the avalanche size distribution displays an exponential decay for all the obstacle positions prlinsert . Hence, the mean avalanche size can be defined and used as a characteristic parameter of the distribution. Let us now focus on the behavior of as a function of the obstacle height above the outlet () for different outlet sizes. In Fig. 2 (a) we plot the experimental values of versus for three different outlet sizes (, , and mm). For these values of , the mean avalanche size if the obstacle is absent () extends over a wide range: from to particles. These values are represented by dashed horizontal lines in Fig. 2 (a). This plot manifests that the mean avalanche size as a function of displays the same trend independently of the outlet size. In all the cases, for positions of the obstacle above mm or so, the value of is very similar to the value obtained without obstacle. This indicates that for such values of the obstacle effect nearly vanishes. When the obstacle approaches the orifice from , increases, displaying a maximum for mm. For smaller values of the mean avalanche size decreases, because arches begin to build up between the obstacle and the bottom (before that, arches just span over the exit orifice without touching the obstacle) prlinsert .
Despite the similar behavior displayed in Fig. 2 (a) for different outlet sizes, it is evident that the consequence of the peak is enhanced as increases. This result is more obvious if we plot divided by the values of corresponding to each (Fig. 2b). This behavior makes sense, because as increases and approaches values of ‘no clogging’, arches are composed of more particles and are weaker Mankoc ; Lozanosubmitted . Hence, a similar decrease of pressure can result in a stronger reduction of the clogging probability (or enhancement of the mean avalanche size) as increases. Another interesting fact observed in Fig. 2b is that the position of the peak does not depend significatively on the outlet size. This result can be understood if we assume that the decay of for small values of is due to clogs developed between the orifice and the obstacle. Thus, in this region, the parameter that governs clogging is not but the distance between the bottom of the obstacle and the bottom of the silo. In any case, the mechanisms causing clogging for such small values of –which should be closely related to clogging in inclined orifices Sheldon ; ThomasandDurian – are not the focus of this paper. In brief, if we just consider the domain where arches are not formed between the outlet and the obstacle (), it can be stated that the bigger the outlet, the stronger the effect of the obstacle in the clogging reduction.
IV Flow rate
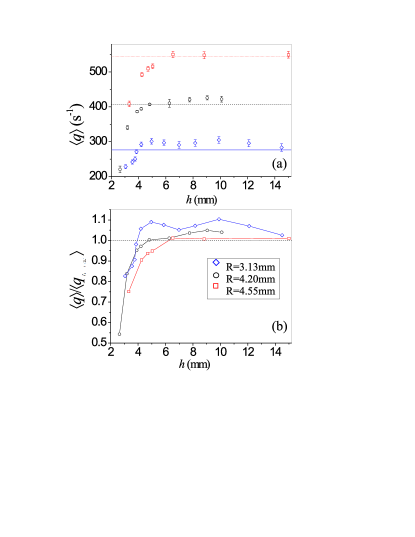
In this section we will analyze the effect of the obstacle on the flow rate (calculated as explained in section II). We first show in Fig. 3a the results of the average flow rate obtained for different obstacle positions . Clearly, the behavior is similar for the three outlet sizes () studied in this work. When is too small, the flow rate is smaller than the one obtained without obstacle (which is marked with dashed horizontal lines in Fig. 3a). This is due to the short distance between the outlet and the obstacle, that strongly affects the flow rate. If the obstacle position is moved upwards, far from the orifice, the flow rate can be increased, reaching values up to higher than in the silo without obstacle. This result is in agreement with recent results obtained for large outlet sizes where clogging did not appear Yang_insert_silos ; Marroquin . The measurements displayed in Fig. 3a also indicate that the flow rate enhancement is more conspicuous for the smallest outlet size. In addition, it seems that the transition point from flow rate reduction (at small values of ) to flow rate enhancement (at high values of ) moves towards higher values of as is increased. This is more clearly seen if we represent the results of the flow rate rescaled by the flow rate obtained without obstacle corresponding to each outlet size, i. e. (see Fig. 3 b).
We remark that no obvious relationship can be perceived between the average flow rate and the mean avalanche size measurements. Indeed, the effect of the obstacle on the avalanche size is more prominent as is increased, whereas the effect on the flow rate is stronger for small . At the same time, the obstacle positions at which the maximum flow rate is obtained do not coincide with the positions at which the avalanche size is maximized. All these facts suggest the different nature of two processes: the flow of particles through the outlet, and the clogging due to arch formation Jandasubmitted .
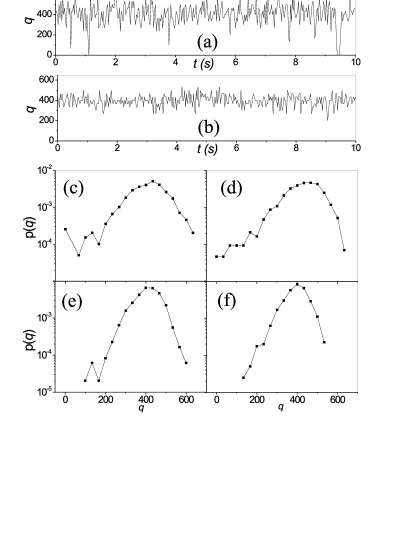
On the other hand, it has been recently proposed that some connection does exist between the mean avalanche size and the fluctuations of the flow rate Janda_fluctus . Indeed, it was shown that in a 2D silo the values of display a Gaussian distribution if the outlet size is large. On the contrary, as was reduced and the region of clogging approached, there was an increase on the number of events with , so that the distribution was no longer Gaussian. Those events were attributed to the existence of partial clogs that were not strong enough to permanently halt the flow. In Fig. 4a we present the time series of obtained for a silo with orifice size without obstacle. In agreement with Janda_fluctus , the trace displays downward spikes in which the flow goes to zero. These events are consequence of temporal (not definitive) interruption of the flow. If the same results are presented for the case of a silo with an obstacle of 10 mm diameter placed at (Fig. 4 b) it becomes clear that the downward spikes disappear. Recall that is the obstacle position for which the avalanche size is maximum and hence, the clogging probability is minimum. In addition, from Fig. 4 b, it seems that placing an obstacle also minimizes the upward fluctuations making the flow rate more homogeneous while its average value is practically unaltered.
In Figs. 4c-f we present the normalized distributions of for four different obstacle positions. Fig. 4a shows the distribution for without obstacle, where the existence of a large number of events with is rather obvious. As the position of the obstacle is moved toward the outlet, the number of events corresponding to is reduced, to the point of being almost absent when (Fig. 4d). In addition, decreasing , the histograms become narrower implying that the placement of the obstacle helps to avoid fluctuations of the flow rate. The results obtained for the distributions of for the two other outlet sizes (not shown) display the same behavior.
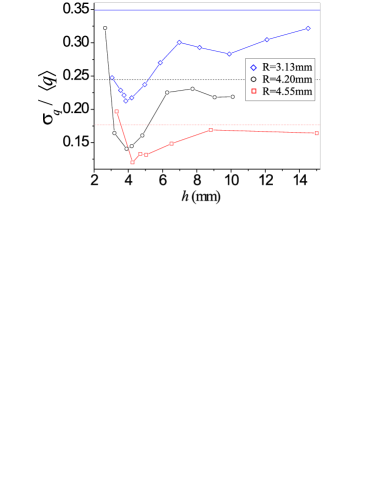
The effect of the obstacle position in the flow rate fluctuations is quantified by means of the standard deviation of the distribution divided by the average, i. e. the coefficient of variation . The results obtained for different obstacle positions and the different values of are presented in Fig. 5. Interestingly, the global behavior obtained can be easily related to the one reported in Fig. 2 a for the mean avalanche size. For all the outlet sizes studied, high values of display values of close to the ones seen in the absence of an obstacle. As is reduced, the fluctuations decrease just as the probability of clogging does (which implies an increase in the mean avalanche size). In all the cases, the minimum of is reached at values of similar to those for which the maximum avalanche size is obtained. These results exhibit the close relationship between clogging reduction and the fluctuations of the flow rate: reducing the clogging probability is always associated with a reduction in the fluctuations of the flow rate.
Let us finally stress that by placing an obstacle above the outlet, the flow rate fluctuations can be reduced without an associated increase of the outlet size and average flow rate. This implies a clear advantage with respect to the work of Janda et al. Janda_fluctus , where the reduction of fluctuations was always associated with an increase of the flow rate.
V Obstacle size
In order to further explore the possible relationship between clogging and flow rate fluctuations, we have performed some experiments where the diameter of the obstacle () has been varied. We choose a fixed outlet size ( mm) and obstacle position ( mm). The election of is based in practical terms as the mean avalanche size is small, with the consequent time savings that this implies. The reason for choosing mm is that, for such values of , both the avalanche size and the average flow rate depend on the obstacle position (Fig. 2 and Fig. 3 respectively). Therefore, we expect that the change of obstacle size has also an effect on these variables. We suspect that choosing a higher value of could lead to values of the flow rate and avalanche size less dependent on the obstacle size. In any case, this hypothesis remains to be confirmed in future works.
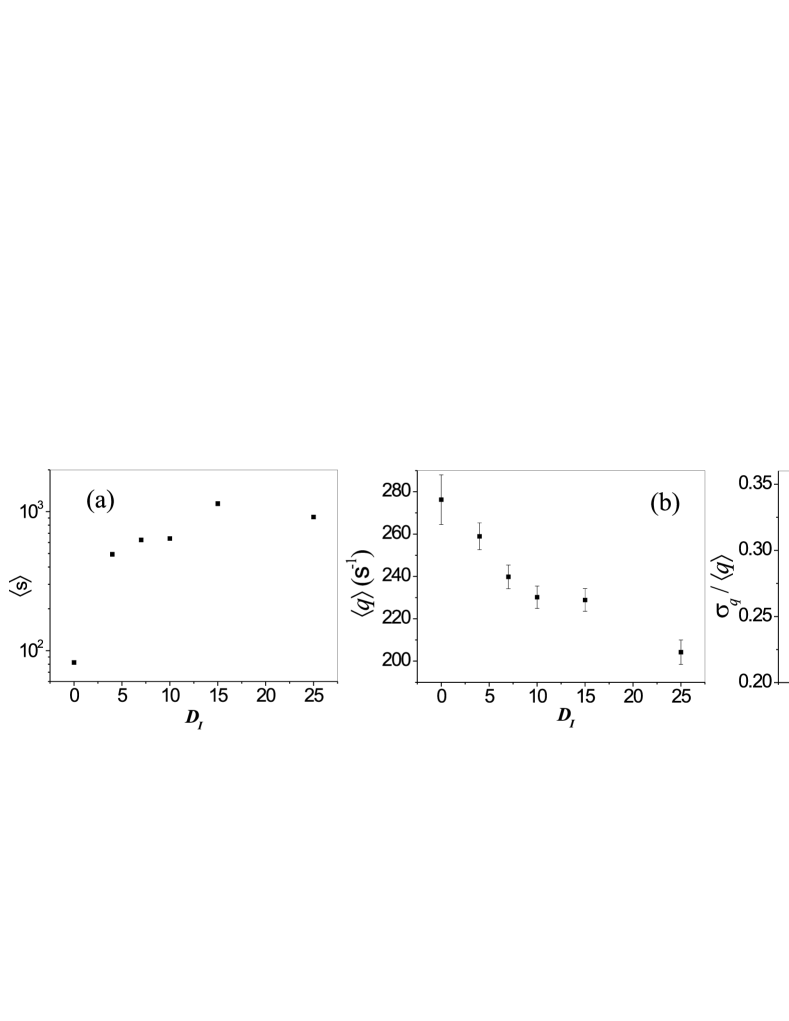
In Fig. 6a the results of the mean avalanche size are displayed for five different diameters of the obstacle and compared with the case without obstacle (which is presented as ). The first result that becomes evident is that the obstacle, whatever its size, causes an important increase of the mean avalanche size. The mere presence of the obstacle, even when it is small, prevents the clogging of particles passing through a bottleneck –at least for the outlet size and the obstacle position used here. In addition, it seems that there is a obstacle size ( mm) for which the avalanche size is maximum. This result can be understood as follows: for small obstacle sizes, the bigger the obstacle, the stronger its effect preventing clogging. Hence, enlarging the obstacle leads to an increase of the avalanche size. This tendency is reversed for very big obstacle sizes, a fact which is attributed to an enhancement of the clogging between the obstacle and the bottom of the silo. Intuitively, an exceedingly large obstacle would lead to a situation where the flow would be impossible, as the angle of repose of the material imposes a limit at which the particles are sustained by themselves ThomasandDurian .
We also analyzed if the flow rate depends on the obstacle size; measurements are presented in Fig. 6b. It can be seen that the larger the diameter of the obstacle, the smaller the average flow rate. This behavior can be understood if we think that increasing the obstacle size leads to a reduction of the distance between the obstacle and the static region of grains at the bottom corners of the silo imposed by the angle of repose. This process is analogous to moving the obstacle towards the orifice (decreasing ). Let us recall that the obstacles of different diameter were placed at a position ( mm) for which the average flow rate decreases as the obstacle approaches the outlet (as shown in Fig. 3).
Finally, in Fig. 6c we show the variation coefficient as a function of . Interestingly, the highest value of is obtained for the silo without obstacle, where the minimum value of the mean avalanche size is also found. In addition, the coefficient of variation also displays the non-monotonic dependence on that was observed for the mean avalanche size, supporting the suggestion of Sect. IV about the relationship of reduced clogging probability and lessened flow rate fluctuations. On the contrary, the average flow rate and the mean avalanche size (or the clogging probability) do not seem to be related in any recognizable way.
VI Arch shape
From the pictures recorded in the experiment (Fig. 1) the position of the beads in the arches that block permanently the silo can be accurately obtained. As reported in a previous paper Garcimartin_arches , the particles forming the base of the arch are not considered to belong to it, in compliance with the definition of arch given in numerical works Pugnaloni_arches . In practical terms, the particles in the base are those whose centers are at the extreme positions in the horizontal direction. In Fig. 1 the centers of the particles belonging to the arch are marked with crosses and the particles of the base are marked with circles. Once the particles forming the arch have been identified, a number of arch properties can be analyzed (the size, measured in number of beads; span; height; and aspect ratio). The span is defined as the distance, projected on the horizontal direction, between the two outermost particles of the arch. Accordingly, the height is defined as the distance between the vertical coordinates of the centers corresponding to the highest and the lowest beads of the arch. Finally, the aspect ratio () is calculated as the quotient between half the span and the height of the arch. All these parameters will allow to explore if the presence of an obstacle induces any kind of difference in the geometrical properties of the arches. In this work, we will compare the arch features in a silo with an orifice of mm in two different situations: without obstacle and with an obstacle at mm. We note that for this value of , the obstacle placed at mm yields the maximum avalanche size observed (Fig. 2 a).
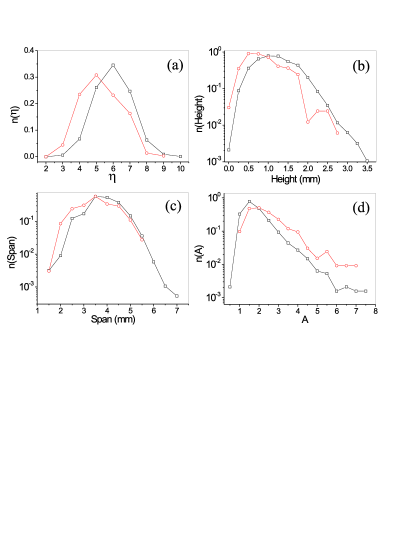
For these two cases, namely, no obstacle and an obstacle placed at mm, let us compare the arch size, measured in number of beads (). In Fig. 7a we present the two arch size distributions. Clearly, smaller arches (with fewer particles) are formed when there is an obstacle. The arch height distribution (Fig. 7b) and the arch span distribution (Fig. 7c) confirm this result: in the presence of an obstacle the arches are shorter and narrower. The aspect ratio , plotted in Fig. 7d, shows how arches are flatter (higher ) when there is an obstacle. In addition, it seems that both distributions present an exponential decay in the aspect ratio probability.
The aspect ratio of an arch is a especially important variable, as it is used as a key ingredient in one of the few models linking the silo clogging probability to the arch properties to1 ; To_semicircle . In this model the arch is proposed to be semicircular, i.e. an aspect ratio equal to one. In an experimental work performed afterwards, the validity of this assumption was demonstrated for large arches (broader than the outlet by more than one bead diameter) Garcimartin_arches . In addition, the aspect ratio of the arches is appealing because it may reflect interesting features related with the loads sustained by them. Thus, an aspect ratio smaller than one (pointed arch) would indicate that the arch is optimized to sustain a vertical pressure. On the contrary, an arch optimized to sustain a horizontal load would be flatter, exhibiting an aspect ratio larger than one. A semicircular arch (aspect ratio one) is the preferred shape to optimize an isotropic pressure Osserman ; Ochsendorf . Based on these assumptions, the results presented in Fig. 7d are consistent with the fact that an obstacle above the outlet screens the pressure of the particles in the silo. If so, the flatter arches (higher aspect ratio) obtained when an obstacle is present could be the consequence of the load reduction in the vertical direction caused by the obstacle.
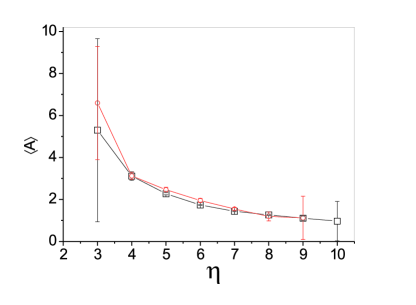
Once we have seen that the arches developed in the presence of an obstacle are smaller (in number of particles, height and span) and flatter, we can consider if those are independent effects or else if one effect is caused by the other. Indeed, in a previous work Garcimartin_arches it was suggested that all these variables are strongly related. In Fig. 8 we present the values of the aspect ratios averaged over all the arches formed by a given number of particles. The results obtained for silos without an obstacle and with an obstacle at mm are almost identical and confirm that the aspect ratio of the arches is one when they are sufficiently large. The only difference between both situations is that arches in the silo without obstacle are formed by a higher number of particles –reaching maximum values of 10 instead of 9– something that was expected from Fig.7. The fact that the obtained results in both situations are so far indistinguishable, seems to indicate that the arches of a given number of particles have the same geometrical properties regardless of the presence of an obstacle. The only effect of placing an obstacle is to prevent the formation of pointed arches (aspect ratio smaller than one) which, in general, consist of more particles. It cannot be conclusively asserted whether the aspect ratio is responsible for this behavior –the cause could instead be ascribed to other variable–, but the above mentioned relationship between the aspect ratio and the load distribution makes it a likely candidate.
VII Conclusions
We have presented a detailed analysis of the effect that placing an obstacle above the outlet of a silo has on the flow and clogging processes. The measurement of the dependence of the avalanche size on the obstacle position, and this for different outlet sizes, reveals that the clogging reduction caused by the obstacle is enhanced as the outlet size is increased, thereby approaching the region of ‘no clogging’. This phenomenon can be understood in terms of the robustness of the arches. If we assume that arches become weaker as their size increases, it seems plausible that a similar pressure reduction has a stronger effect in greater arches than in smaller ones. Although it is still not clear if there is a critical outlet size above which clogging is forbidden to2 ; janda1 , if we assume that this boundary does exist in practical terms, then it makes sense that small perturbations have more consequence as the critical point is approached.
We have also presented results of the flow rate properties for different outlet sizes and obstacle positions. Concerning the average flow rate, it is shown that the obstacle can cause an increase up to around . This increase of the flow rate is shown to be relatively more pronounced as the outlet size is reduced. In other words, the placement of the obstacle has a stronger effect in the flow rate for small outlets. This trend is opposite to the one observed for the avalanche size (or the clogging probability). Indeed, it seems that there is not any relationship between the average flow rate and the probability of clogging. On the contrary, we report a clear and strong relationship between the clogging reduction (increasing of avalanche size) and a decrease of the coefficient of variation in the flow rate fluctuations. This could be of practical interest as it suggests that the measurement of this coefficient of variation would be enough to estimate the mean avalanche size. The relationship among these two parameters may be signaling that the number of stable and unstable clogs is correlated. Increasing the number of stable clogs leads to a decrease of the avalanche size, while increasing the number of unstable clogs provokes an enhancement of the fluctuations. This behavior was already observed in previous works Janda_fluctus by varying the outlet size in a silo without an obstacle: by increasing the outlet size, the probability of clogging was reduced, as well as the fluctuations, but the price to pay was a corresponding increase of the average flow rate. The interesting fact observed when placing an obstacle is that fluctuations and average flow rate are not necessarily linked. The use of different obstacle sizes has allowed us to check that this effect is robust.
Finally, we have performed an exhaustive comparison of the shape of the arches developed in a silo in the two situations where the pressure difference is apparently more significant: the silo without an obstacle and the silo with an obstacle placed at mm. The results reveal that smaller and flatter arches are obtained in the silo with an obstacle –the case in which the pressure at the outlet is reduced. This can be qualitatively understood if we recall that pointed arch shapes optimize vertical loads (which seem to be more important in the absence of an obstacle) and flatter arches are the optimal response to horizontal loads (which seem to be more important in the silo with obstacle).
In summary, the experimental results presented in this work show that the placement of an obstacle has a robust effect in the silo clogging reduction. In addition, we report convincing evidences that the mechanism by which this effect is attained is a pressure reduction near the orifice. However, other possibilities –such as a modification of the flow streamlines similar to the one reported in Kolb – should not be discarded. Another interesting analogy of this work can be drawn with experiments where a big obstacle moves slowly within a granular media Albert ; Reddy . Indeed in Reddy it is suggested that the stress fluctuations induced by an obstacle in a dense granular flow close to the jamming transition, may help to overcome the flow threshold. Further experiments and simulations would be interesting in order to characterize the pressure exerted by the granular media on the obstacle, as well as its fluctuations.
VIII acknowledgments
This work has been financially supported by Projects FIS2008-06034-C02-01 and FIS2011-26675 (Spanish Government) and by PIUNA (Universidad de Navarra). C.L. thanks Asociación de Amigos de la Universidad de Navarra for a scholarship.
References
- (1) K. To, P.-Y. Lai and H. K. Pak, Phys. Rev. Lett. 86, 71 (2001).
- (2) D. Helbing, L. Buzna, A. Johansson, T. Werner, Transportation Science 39, 1 (2005).
- (3) D. Helbing, A. Johansson, J. Mathiesen, M. H. Jensen, and A. Hansen, Phys. Rev. Lett. 97, 168001 (2006).
- (4) I. Zuriguel, A. Garcimartín, D. Maza, L. A. Pugnaloni and J. M. Pastor, Phys. Rev. E 71, 051303 (2005); I. Zuriguel, L. A. Pugnaloni, A. Garcimartín, and D. Maza, Phys. Rev. E 68, 030301 (R) (2003).
- (5) K. To, Phys. Rev. E 71, 060301 (R) (2005).
- (6) A. Janda, I. Zuriguel, A. Garcimartín, L. A. Pugnaloni and D. Maza, Europhys. Lett. 84, 44002 (2008).
- (7) C. Saloma, G. J. Perez, G. Tapang, M. Lim, C. Palmes-Saloma, Proc. National Acad. Sci. USA (PNAS) 100, 11947 (2003).
- (8) D.R. Parisi, and C.O. Dorso, Physica A 354, 606 (2005).
- (9) I. Zuriguel, A. Janda, A. Garcimartín, C. Lozano, R. Arévalo, and D. Maza, Phys. Rev. Lett. 107, 278001 (2011).
- (10) A. Kirchner, K. Nishinari, and A. Schadschneider, Phys. Rev E 67, 056122 (2003).
- (11) D. Yanagisawa, A. Kimura, A. Tomoeda, R. Nishi, Y. Suma, K. Ohtsuka, and K. Nishinari, Phys. Rev. E 80, 036110 (2009).
- (12) G.A. Frank, C.O. Dorso, Physica A 390, 2135 (2011).
- (13) N. Shiwakoti, M.Sarvi, G. Rose, M. Burd, Transportation Research Part B: Methodological 45, 1433 (2011); N. Shiwakoti, M.Sarvi, G. Rose, M. Burd, Transportation Research Record 2137, 31 (2009).
- (14) U. Tüzün and R. M. Nedderman, Chem. Eng. Sci. 40, 325 (1985).
- (15) B. Zelinski, E. Goles and M. Markus, Physics of Fluids 21, 031701 (2009).
- (16) S. C. Yang and S. S. Hsiau, Powder Technol. 120, 244 (2001).
- (17) F. Alonso-Marroquin, S.I. Azeezullah and S.A. Galindo-Torres and L.M. Olsen-Kettle, Phys. Rev. E 85, 020301(R) (2012).
- (18) M. A. Aguirre, J. G. Grande, A. Calvo, L. A. Pugnaloni, and J.-C. Géminard, Phys. Rev. Lett 104, 238002 (2010); M. A. Aguirre, J. G. Grande, A. Calvo, L. A. Pugnaloni, and J.-C. Géminard, Phys. Rev. E 83, 061305 (2011).
- (19) H. Pacheco-Martinez, H.J. van Gerner, and J. C. Ruiz-Suárez, Phys. Rev E 77, 021303 (2008).
- (20) A. Garcimartín, I. Zuriguel, L.A. Pugnaloni, and A. Janda, Phys. Rev. E 82, 031306 (2010).
- (21) J. Duran, Sables, Poudres et Grains (Eyrolles, Paris, 1997).
- (22) C. Mankoc, A. Garcimartín, I. Zuriguel, D. Maza and L. A. Pugnaloni, Phys. Rev. E 80, 011309 (2009).
- (23) C. Lozano, G. Lumay, I. Zuriguel, R.C. Hidalgo, and A. Garcimartín, Phys. Rev. Lett 109, 068001 (2012).
- (24) H. G. Sheldon and D. J. Durian, Granular Matter 12, 579 (2010).
- (25) C. C. Thomas and D. J. Durian, arXiv:1206.7052v1 (cond-mat.soft).
- (26) A. Janda, I. Zuriguel, D. Maza, Phys. Rev. Lett 108, 248001 (2012).
- (27) A. Janda, R. Harich, I. Zuriguel, D. Maza, P. Cixous, and A. Garcimartín, Phys. Rev. E 79, 031302 (2009).
- (28) L. A. Pugnaloni and G. C. Barker, Physica A 337, 428 (2004).
- (29) K. To and P.-Y. Lai, Phys. Rev. E 66, 011308 (2002).
- (30) R. Osserman, Not. Am. Math. Soc. 57, 220 (2010).
- (31) J. Ochsendorf (private communication).
- (32) E. Kolb, J. Cviklinski, J. Lanuza, P. Claudin, and E. Clément, Phys. Rev. E 69, 031306 (2004).
- (33) R. Albert, M.A. Pfeifer, A.-L. Barabási, and P. Schiffer, Phys. Rev. Lett 82, 205 (1999).
- (34) K.A. Reddy, Y. Forterre, and O. Pouliquen, Phys. Rev. Lett 106, 108301 (2011).