Infrared emission from novae–References
Infrared emission from novae
Abstract
We review infrared observations of classical and recurrent novae, at wavelengths m, including both broad-band and spectroscopic observations. In recent years infrared spectroscopy in particular has revolutionised our understanding of the nova phenomenon, by revealing fine-structure and coronal lines, and the mineralogy of nova dust. Infrared spectroscopic facilities that are, or will be, becoming available in the next 10–20 years have the potential for a comprehensive study of nova line emission and dust mineralogy, amd for an unbiassed assessment of the extragalactic nova populations.
keywords:
classical novae – recurrent novae – infrared observations – circumstellar matter1 Introduction
In many ways the 1970s marked the beginning of a golden age in our understanding of the nova phenomenon, as in this decade ultraviolet (UV) and infrared (IR) observations became available to complement the already well-observed (if not fully understood) optical observations. Indeed, it can be argued that this pan-chromatic view of the nova phenomenon was (as in many other areas of astrophysics) the key to understanding the bigger picture.
The IR window on novae was opened by the seminal observations by Geisel et al. (1970), who obtained broadband photometric observations of Nova Serpentis 1970 (FH Ser) from 1–25m. The sharp rise in the flux longward of m, coinciding with the deep decline in the visual light curve, finally confirmed an hypothesis that had been gathering dust (so to speak) since 1935. In 1934 the nova DQ Her – one of the best observed novae of all time – erupted and displayed a deep ( mag) minimum in the visual light curve (see Martin (1989a) for a schematic light curve, based on AAVSO observations). With extraordinary insight, McLaughlin (1935) suggested that the deep minimum might have arisen as a result the formation of dust in the material ejected in the 1934 eruption, but the technology to make the IR observations required to confirm the dust hypotheses did not exist at the time.
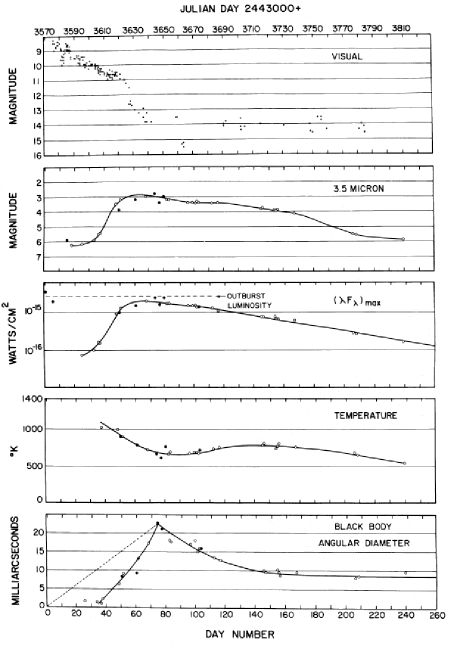
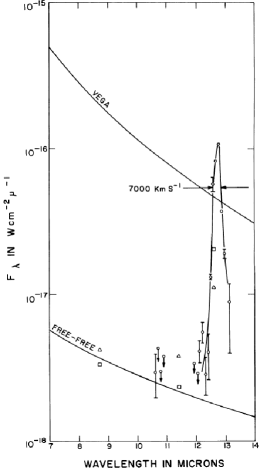
The pan-chromatic view of the nova phenomenon has shown that the circumstellar environment of an erupting nova is extraordinarily hostile, not conducive to the chemistry required to go from a plasma, via small molecules to dust grains. An alternative proposal to dust formation was proposed by Bode & Evans (1980), who suggested that the dust giving rise to the IR emission pre-dates the eruption, by producing an “infrared echo”. However, with one or two exceptions – in which there is clear evidence for such “pre-existing” dust – it now seems clear that chemistry and dust-formation do indeed proceed in the winds of erupting novae. The coincidence of the minimum in the visual light curve and rise in the IR, as the newly-formed dust reradiates the absorbed visual light, is well illustrated in the case of the novae NQ Vul (Ney & Hatfield, 1978) and LW Ser (see Fig. 1; Gehrz et al., 1980). This is now regarded as irrefutable evidence that the dust forms in the newly-ejected material.
However there is more to IR observations of novae than the detection and characterisation of dust. As the eruption proceeds, from the expanding fireball, through the free-free phase, to the nebular and (in some cases) coronal phases, the ionisation and excitation of the dispersing ejecta by the still-hot white dwarf results in a rapidly evolving emission line spectrum. The continuum (free-free) emission can be used to estimate the ejected mass, while the emission lines can be used to determine elemental abundances in the ejecta if the state of the still-hot central engine is known. In the case of fine-structure and coronal emission, abundances can be in some cases be determined using relatively simple atomic physics.
In this contribution we review the IR properties of classical and recurrent novae at wavelengths longward of m; a companion paper in this issue (Banerjee & Ashok, 2012) is devoted to IR observations of novae shortward of 3m.
2 The nova phenomenon: some context
As is well known (see Bode & Evans, 2008, for a recent review), a nova explosion occurs in a semi-detached binary system in which a white dwarf (WD) accretes material from a cool star via an accretion disc. The base of the accreted material is compressed and heated, and becomes (electron) degenerate. A Thermonuclear Runaway (TNR) eventually occurs and, as degeneracy is lifted, the accreted material is ejected in a nova explosion. Mass transfer then resumes and in time further nova explosions occur; this may be on a timescale years (a classical nova), or on a human timescale, years (a recurrent nova). Indeed, it may be that the recurrence time is not so markedly bimodal, and that there is a spectrum of recurrence times, which has not yet become manifest. In any case, whether a classical or a recurrent, a nova system undergoes many eruptions.
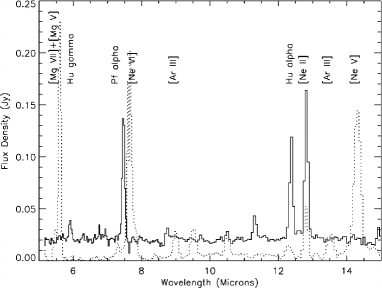
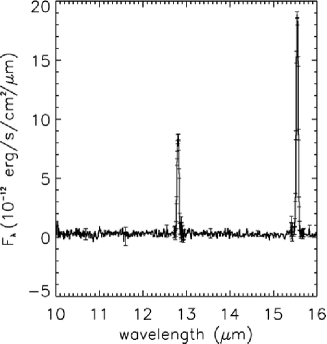
In the course of the explosion some to M⊙ of material is ejected, at speeds ranging from a few hundred to several thousand km s-1. By virtue of the fact that the explosion has its origin in a TNR the ejected material is enriched in CNO (and other elements). Some species observed in nova ejecta are unlikely to have been generated in the TNR, and it is clear that some of the WD must be dredged up into the accreted material, as first suggested by Ferland & Shields (1978b) to account for the large neon over-abundance in V1500 Cyg. This led to the realisation that the compact object in the nova binary may be either be a CO WD or a more massive ONe WD. Nova eruptions on the former tend to have ejecta masses at the lower end of the mass range and to be the prolific dust producers, while novae in systems containing ONe WD tend to be faster – as the violence of the explosion depends on the WD mass – eject higher masses, and seem generally incapable of forming much dust. Nova explosions on ONe WD are often termed “neon novae”, on account of the great strength of neon lines in their optical and IR spectra; novae originating on CO WDs are termed “CO novae”. The difference in their spectra over the wavelength range m, where there is a number of neon lines, is well illustrated (see Fig. 2) in the cases of V1186 Sco (a CO nova) and V1187 Sco (a neon nova).
The energetics of a nova explosion are well parametrised by the time (or ) that the nova’s visual light curve takes to decline by 2 (or 3) magnitudes from maxium, although the (extremely) erratic nature of some nova light curves makes this parameter not only difficult to determine but also to define. Faster novae (i.e. smaller ) have greater bolometric luminosities and ejection velocities. A key point is that fact that the bolometric luminosity remains constant throughout the early part of the eruption (the TNR “switches off” after about 1…10 years; see Krautter, 2008) and so as the mass-loss declines, the effective temperature of the stellar remnant increases as the pseudophotosphere collapses back onto the WD (Bath & Harkness, 1989). This has implications for the evolution of both the line and dust emission.
3 Broad-band IR observations
The earliest IR observations consisted of broad-band photometry, most often in the (and sometimes ) bands111m, m, m, m, m, but also at longer wavelengths. Despite the limitations of broad-band observations, they were key to revealing three important aspects of the nova phenomenon: the formation of dust, the presence of spectral features in the IR, and the determination of the ejected mass.
As already mentioned, some of the early broad-band observations revealed the condensation of significant quantities of dust in the ejected material (e.g. Geisel et al., 1970; Ney & Hatfield, 1978; Gehrz et al., 1980). However even now, more than 40 years on, the very rapid grain growth in novae remains a poorly understood aspect of the dust formation process. For example, in the proto-typical heavy dust formers such as V705 Cas (Mason et al., 1998; Evans et al., 2005) and LW Ser (see Fig. 1 Gehrz et al., 1980), the grains grow to maximum size (typically m) as judged from the optical extinction event, in only 20–40 days. The inference is that grains grow with extremely high efficiency once they have nucleated. A possible mechanism has been proposed by Shore & Gehrz (2004), who argued that photo-ionisation of condensates by the hard radiation field of the central engine can induce runaway grain growth. Dust formation may also be facilitated by the clumpiness of nova ejecta, and the fact that the cores of the clumps are shielded from the hardest radiation. H- and thermal IR images of the circum-binary ring around the hot, luminous, over-contact binary RY Sct clearly demonstrate that dust can form behind an ionisation front that has blocked the ionising photons from the dust formation zone (Smith et al., 2001, 2011).
The nature of the broad-band data meant that little could be deduced about the nature of the dust, although the expected overabundance of CNO elements in the ejecta hinted at carbon. As the bolometric luminosity of the nova remains constant during the early eruption (predicted by the TNR model of the nova eruption, and confirmed by multi-wavelength observations) a simple interpretation gives
for the dust condensation time , in terms of the ejecta speed and condensation temperature . The parameter is defined such that the IR emissivity of the dust is , and is the absorptivity of the dust, averaged over the spectral energy distribution (SED) of the stellar remnant.
As the dust flows away from the site of the explosion the dust temperature is expected to decline with time as but in some particularly dusty novae (such as NQ Vul), the dust temperature remains roughly constant with time (see e.g. Ney & Hatfield, 1978; Gehrz et al., 1980, this is well illustrated in Fig. 1 for LW Ser ) – the so-called “isothermal” stage – indicating that the dust physics is rather more complex than indicated above. However as noted by Evans & Rawlings (1994) the luminosity as seen by the grains is not constant, because of the way in which ionisation fronts sweep through the ejecta. The isothermal phase has been interpreted in terms of grain destruction, by chemisputtering of carbon grains (Mitchell & Evans, 1984; Mitchell et al., 1984), and the photo-processing of carbon dust (Evans & Rawlings, 1994). Indeed, the chemisputtering of amorphous carbon dust by hydrogen led Mitchell & Evans (1984) to predict the presence of aromatic infrared (AIR)222The aromatic and aliphatic hydrocarbon features seen in a wide variety of astrophysical sources – including novae – have been variously referred to as HAC features, PAH features, UIR features and AIR features; we use the latter designation here. features in novae, subsequently discovered in V842 Cen (Hyland & McGregor, 1989) and V705 Cas (Mason et al., 1998; Evans et al., 2005, see Section 4.2.3 below).
Broad-band observations were also sufficient to hint at the presence of the CO molecule early in the IR development of NQ Vul (e.g. Gehrz et al., 1976; Ney & Hatfield, 1978); the bandhead of the CO fundamental vibrational transition is at 4.6m, which elevates the band flux. Indeed the data presented by Gehrz et al. (1976) clearly show that lines (probably the CO bandhead) contributing to the 5m excess were present before the dust formed. This molecule is key to understanding the chemistry that leads to dust formation. While the conventional paradigm is that the C:O ratio (by number) in the ejected material determines the nature of the dust formed, this assumes that CO formation goes to saturation so that whichever of C and O has the lower abundance is locked up in CO; this seems not to apply to nova ejecta, in which CO formation does not go anywhere near saturation, giving rise to the production of a variety of dust types. An alternative explanation for the latter is that there are strong abundance gradients within the ejecta.
Early broad-band observations also hinted at the presence of the [Ne ii]12.81m fine-structure line, in the IR observations of V1500 Cyg (Ennis et al., 1977; Ferland & Shields, 1978a), giving rise (as noted above) to the neon nova concept. As we discuss below, the IR fine-structure (and coronal) lines provide a means of estimating ejecta temperature and abundances.
The mass ejected () in a classical nova eruption is a key parameter. It is central to the understanding of the TNR, to the determination of abundances, and to the contribution that novae make to the chemical evolution of the Galaxy (see e.g. Bode & Evans, 2008, and chapters and references therein, for a full discussion of ejected masses). It is also key to the fate of the WD in the nova system. If is less than the mass accreted by the WD then the mass of the latter must increase with time, with implications for a potential link between nova systems and the progenitors of Type Ia supernovae; but if exceeds the accreted mass then novae are likley greater contributors to Galactic chemical evolution than hitherto thought. Either way this one parameter lends novae a great significance in the bigger picture.
The ejected mass may be determined by multi-wavelength broad-band IR observations during the free-free phase; the observations fix the wavelength at which the free-free emission becomes optically thick, a measure of the shell density (see Gehrz, 2008, and references therein). Masses can also be determined using a Thomson scattering model when IR observatons show that the fireball is becoming optically thin (Gehrz, 2008). Ejected masses determined by these two methods agree when applied to the same nova and are typically in the range 0.5 M⊙ (see Gehrz et al., 1998; Gehrz, 2008, for a summary); ejected masses determined from radio observations are comparable (see Seaquist & Bode, 2008, for a summary), although IR and radio observations sample different regions of the ejected material (Gehrz, 2008). These observationally-determined masses are significantly greater than those expected from the TNR theory (e.g. Starrfield et al., 2008), and the discrepancy is all the greater when it is noted that neither IR nor radio observations include any neutral material.
4 IR spectroscopy
IR spectroscopy (with spectral resolution ) became widespread in the 1980s and it is at this time that IR observations of novae began to rival optical observations in their diagnostic capability. In particular spectroscopic observations from observatories in space, especially the Infrared Space Observatory (ISO; Kessler et al., 1996) and more recently the Spitzer Space Telescope (Werner et al., 2004; Gehrz et al., 2007), have been pivotal in advancing our understanding of the circumstellar environments of novae.
4.1 Line emission
As is well known, when the visual light curve has declined by about 3 magnitudes, the optical spectrum of a classical nova makes the dramatic “transition” from absorption to emission (see Payne-Gaposchkin, 1957, for a very nice illustration of this in the case of DQ Her). Much else happens around this time, such as the formation of dust in the ejected material. Thereafter, the ionisation states of the emission lines increase as the pseudophotosphere collapses onto the white dwarf (see above), with specific ionisation states appearing at well-defined epochs in the evolution of the eruption (see Bath, 1978, especially Figure 5, for an early discussion of this point). As the nova eruption progresses, a number of fine-structure lines appear longward of 3m and, in some cases, coronal lines appear as well.
4.1.1 The nebular phase
The evolution of the nebular spectrum of novae is well observed and hydrogen recombination lines appear very early in the development of the nebular spectra; prominent series with lines in the wavelength range of the Spitzer Infrared Spectrograph (IRS; Houck et al., 2004) include the Humphreys (, ), () and () series, where is the principal quantum number of the upper level.
The nebular phase offers the potential to determine elemental abundances in the ejected material (and hence of the material produced in the TNR). However the determination of abundances can be fraught with difficulties, including (a) the poorly known interstellar extinction (and its wavelength-dependence) to novae in general, (b) the possible wavelength dependence of any circumstellar extinction (but in the case of V705 Cas this was known to be neutral, at least in the UV; Shore et al., 1994), (c) the clumpiness of nova ejecta, and (d) the physical state of the ionising and/or exciting mechanism. In general the ejected material is in general likely to be highly asymmetric (e.g. displaying equatorial rings and polar caps) and to have abundance gradients.
However, longward of 3m the reddening becomes a lesser issue, and observations with the Spitzer IRS have played a prominent role in the determination of elemental abundances in nova ejecta. Determinations of nebular abundances generally make use of well-tested photoionisation codes such as cloudy (Ferland et al., 1998, and earlier papers), which necessarily make simplifying assumptions, e.g. regarding the geometry of the ionised material, although nebu (Norriset et al., 2005) allows for a range of nebular geometries. Given the prominence of hydrogen recombination (and other) lines it is relatively straight-forward to express abundances relative to H, and then compare this with an assumed solar abundance333Care should be exercised in comparing nova abundances relative to solar as the latter are occasionally revisited; see José & Shore (2008) for a discussion of this point. (e.g. Asplund et al., 2009).
A summary of abundances in nova ejecta, including some values obtained with ISO and Spitzer, is given by Gehrz (2008), while compilations of abundances deduced using ISO and Spitzer data (as well as data at shorter wavelengths) are given by José & Shore (2008) and Helton et al. (2012). Caution should be exercised in comparing these abundances as they are expressed relative to differently-assumed solar abundances.
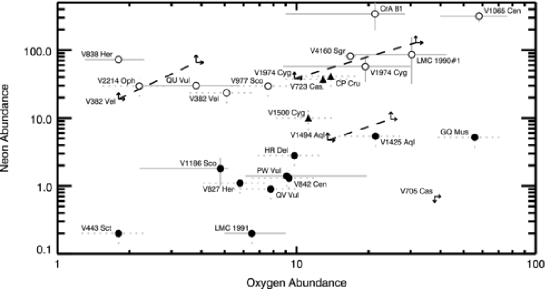
In Fig. 3, we show the relative abundances of neon and oxygen in nova ejecta, as determined from ISO and Spitzer observations, together with observations at shorter wavelengths (Helton et al., 2012); note that the Ne abundance for QU Vul in this Figure is from Schwarz (2002) rather than the more recent determination by Gehrz et al. (2008). Also the abundances in this figure have been adjusted to a standard solar value). Note that the novae in this figure do not form a homogeneous sample: they are generally selected on the grounds that they happened to trigger a target-of-opportunity programme. However there is a clear demarcation between CO and neon novae, the latter having neon overabundance relative to solar of .
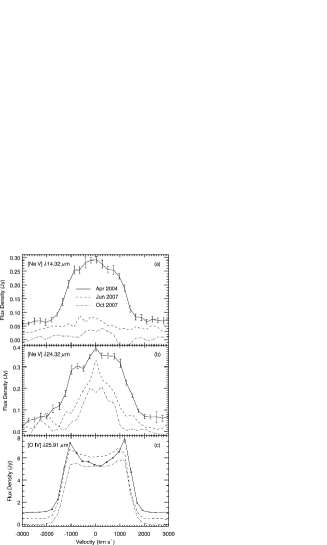
Line profiles during the nebular phase have long been known to be complex and this is also the case for IR emission lines. A selection of line profiles for V1494 Aql is shown in Fig. 4 (from Helton et al., 2012). The saddle-shaped profile of the [O iv]25.91m line resembles that of the optical emission lines seen early in the outburst, and indicates an equatorial cap/polar cap structure in the ejecta. The profiles of the neon lines, on the other hand, are less complex, and may indicate that the emission arises in a geometrically thick, but optically thin, shell (Helton et al., 2012). Such differences may indicate that these ions reside in different regions of the ejecta (this may also be suggested by the range of dust types formed in nova ejecta; see Section 4.2 below).
4.1.2 Fine structure emission
The ground states of heavy elements may have fine structure having the same and quantum numbers but different . The upper level is easily populated (usually by electron collision) and radiative de-excitation may then occur giving rise to fine structure line emission; the transitions are highly forbidden, and the upper level is collisionally de-exited if the electron density exceeds a specific value . Such transitions may act as extremely efficient coolants in low density nebulae (see Ferland et al., 1984, who made an early prediction of the likely strength of [O iv]25.89m and other far-IR fine-structure lines in novae).
[Ne ii] was the first IR fine-strucure line to be observed in a nova (V1500 Cyg) and on this basis Ferland & Shields (1978a) suggested that both [Ne ii]15.56m and [O iv]25.89m would also be strong. QU Vul (Fig. 5) was subsequently discovered to have the strongest [Ne ii]12.8m relative to the continuum ever observed in an astrophysical source (Gehrz et al., 1985), thus becoming the “quintessential” example of a neon nova. [O iv] was subsequently found to be very prominent in the spectra of V1974 Cyg (Salama et al., 1996), V705 Cas (Salama et al., 1999) and V1425 Aql (Lyke et al., 2003) in data obtained with ISO; see also below. More recently observations of novae with the Spitzer IRS have also found prominent [O iv], and also [Ne ii]12.81m, [Ne iii]15.55m, [Ar iii]8.99m and [S iv]10.51m (see Fig. 5).
The importance of these lines is that they may provide a relatively elementary estimate of the abundance of the emitting ion. The ion may be treated as a simple two-level system and detailed balance then requires that the total number of emitting ions is
where is the wavelength of the transition, is the luminosity in the transition and is the (temperature-dependent) collisional excitation rate (Gehrz et al., 2008). In the low density limit (i.e. ), every collisional excitation is followed by a radiative de-excitation.
This technique has been used by Gehrz et al. (2008) to determine a lower limit on the neon abundance in the ejecta of the neon nova QU Vul. Fig. 5 shows the spectrum of this nova, obtained from the ground in the m window in 1984, 140 days after outburst (Gehrz et al., 1985), and in 2004 – over a similar wavelength range – with the Spitzer IRS. Strong emission in the [Ne ii] fine structure line is evident, as is (in 2004) emission by [Ne iii]15.55m. Gehrz et al. (2008) concluded that QU Vul was over-abundant in neon (relative to solar) by a factor of at least 168 some 19 years after eruption. Such large overabundances, combined with the observed ejected masses, suggest that novae are not insignificant contributors to the chemical evolution of the Galaxy.
A list of fine-structure lines longward of 3m expected to be observed in novae is given in Table 1, in which E.P and I.P. are respectively the excitation potential of the upper level and the ionisation potential needed to form the ion respectively. The list includes a number of lines that are commonly seen in the IR spectra of novae, such as [Ca iv]3.20m and [Ne ii]12.81m. Also included are various sodium lines, such as [Na iii]7.31m. 22Na is predicted to be produced in the TNR, particularly on high-mass WDs. This isotope is radioactive and undergoes decay to 22Ne with half-life 2.6027 years; this decay should be observable as the line spectrum evolves. However, while a number of neon lines are well-observed in the IR spectra of novae, the sodium lines have so far proved elusive.
| Species | Transition | (m) | E.P. (eV) | I. P. (eV) |
|---|---|---|---|---|
| [Ca iv] | 2PP3/2 | 3.2067 | 50.91 | 67.27 |
| [Ca v] | 3PP2 | 4.1594 | 67.27 | 84.50 |
| [Ar vi] | 2PP1/2 | 4.5295 | 75.02 | 91.01 |
| [Na iii] | 2PP3/2 | 7.3177 | 47.29 | 71.62 |
| [Ar v] | 3PP1 | 7.9016 | 59.81 | 75.02 |
| [Ar iii] | 3PP2 | 8.9914 | 27.63 | 40.74 |
| [Na iv] | 3PP2 | 9.0410 | 71.62 | 98.91 |
| [S iv] | 2PP1/2 | 10.5105 | 34.79 | 47.22 |
| [Ca v] | 3PP1 | 11.4820 | 67.27 | 84.50 |
| [Ne ii] | 2PP3/2 | 12.8136 | 21.56 | 40.96 |
| [Ar v] | 3PP0 | 13.1022 | 59.81 | 75.02 |
| [Ne iii] | 3PP2 | 15.5551 | 40.96 | 63.45 |
| [S iii] | 3PP1 | 18.7130 | 23.34 | 34.79 |
| [Na iv] | 3PP1 | 21.2900 | 71.62 | 98.91 |
| [Ar iii] | 3PP1 | 21.8302 | 27.63 | 40.74 |
| [O iv] | 2PP1/2 | 25.8903 | 54.93 | 77.41 |
| [S iii] | 3PP0 | 33.4810 | 23.34 | 34.79 |
| [Ne iii] | 3PP1 | 36.0135 | 40.96 | 63.45 |
| [O iii] | 3PP1 | 51.8145 | 35.12 | 54.93 |
| [N iii] | 2PP1/2 | 57.3170 | 29.60 | 47.45 |
| [O i] | 3PP2 | 63.1837 | 0.00 | 13.62 |
| [O iii] | 3PP0 | 88.3560 | 35.12 | 54.93 |
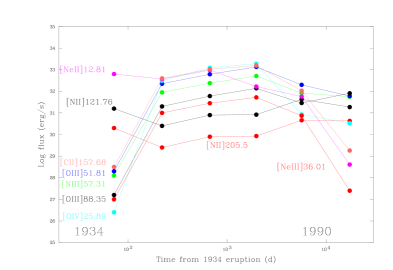
In a careful and thorough discussion of the evolution of the emission line spectrum of DQ Her, Martin (1989a, b) has predicted the variation of the emission line fluxes from days to years after eruption, for emission lines in the UV, optical and IR/far-IR. With the caveat that this calculation is for the elemental abundances, physical conditions and the stellar remnant of DQ Her, the expected variation with time is shown in Fig. 6. Note that some lines, such as [Ne iii]36.01m, decline significantly with time; others, such as [O iv]25.89m, are expected to remain strong for many years, even decades, after outburst. The observed strength of the [O iv] line is borne out by ISO and Spitzer observations of V1974 Cyg (Salama et al., 1996; Helton et al., 2012), V705 Cas (Salama et al., 1999), V1425 Aql (Lyke et al., 2001), CP Cru (Lyke et al., 2003), V1187 Sco (Lynch et al., 2006), QU Vul (Gehrz et al., 2008), V2362 Cyg (Lynch et al., 2008), DZ Cru (Evans et al., 2010), V1065 Cen (Helton et al., 2010), V328 Vel and V1494 Aql (Helton et al., 2012), and in the recurrent nova RS Oph (Evans et al., 2007b, c)
4.1.3 Coronal emission
A working definition of coronal emission is given by Greenhouse et al. (1990) as emission lines “arising from ground-state fine-structure transitions in species with ionisation potential (I.P.) eV”. The distinction from fine structure lines is in the high energy needed to form the ions concerned. From the nova perspective, coronal emission was first observed optically in the recurrent nova RS Oph (see Wallerstein, 2008, for a retrospective). Coronal lines are often observed in the IR spectra of novae, but not all novae undergo a coronal phase.
The high ionisation states observed in coronal emission may arise from photoionisation (e.g. novae are known X-ray emitters during and after eruption, Krautter, 2008). Alternatively, they may be excited by collisional ionisation if there are strong shocks in the nova environment, either between ejecta moving at different speeds or by the interaction of ejected material with a pre-existing wind. The required strong interaction between ejecta and a stellar wind is well established in the case of the recurrent nova RS Oph (see Section 5 below). A list of actual and potential coronal lines longward of 3m that may be present in the IR spectra of novae is given in Table 2.
A discussion of IR coronal line emission in novae is given by Greenhouse et al. (1990). These authors use coronal line intensity ratios to determine that the electron temperatures in the coronal zones in novae are K. Abundances are then estimated from individual line intensities and by summing over ionisation states; this latter step has to assume a specific form for the collisional ionisation equilibrium as a function of temperature. As noted by Greenhouse et al. (1990) the outcome is very dependent on the plasma model assumed.
| Species | Transition | (m) | E.P. (eV) | I. P. (eV) |
|---|---|---|---|---|
| [Mg viii] | 2PP1/2 | 3.0279 | 224.95 | 265.96 |
| [Al vi] | 3PP2 | 3.6597 | 153.83 | 190.48 |
| [Al viii] | 3PP1 | 3.6900 | 241.44 | 284.60 |
| [Si ix] | 3PP0 | 3.9357 | 303.17 | 351.10 |
| [Ca vii] | 3PP1 | 4.0858 | 108.78 | 127.20 |
| [Mg iv] | 2PP3/2 | 4.4867 | 80.14 | 109.24 |
| [Na vii] | 2PP1/2 | 4.6847 | 172.15 | 208.44 |
| [Mg vii] | 3PP1 | 5.5032 | 186.51 | 224.95 |
| [Mg v] | 3PP2 | 5.6099 | 109.24 | 141.27 |
| [Al viii] | 3PP0 | 5.8500 | 241.44 | 284.60 |
| [Ca vii] | 3PP0 | 6.1540 | 108.78 | 127.20 |
| [Si vii] | 3PP1 | 6.4922 | 205.05 | 246.52 |
| [Ne vi] | 2PP1/2 | 7.6524 | 126.21 | 157.93 |
| [Na vi] | 3PP1 | 8.6106 | 138.39 | 172.15 |
| [Mg vii] | 3PP0 | 9.0090 | 186.51 | 224.95 |
| [Al vi] | 3P1 | 9.1160 | 153.83 | 190.48 |
| [Mg v] | 3P1 | 13.5213 | 109.24 | 141.27 |
| [Ne v] | 3PP1 | 14.3217 | 97.12 | 126.21 |
| [Na vi] | 3PP0 | 14.3964 | 138.39 | 172.15 |
| [Ne v] | 3PP0 | 24.3175 | 97.12 | 126.21 |
4.2 Dust emission
As noted in Section 1 the idea of dust formation in nova winds has been around since the 1930s and it is now a well-observed phenomenon in the IR. A review of dust formation in novae is given by Evans & Rawlings (2008) and Gehrz (2008); see also José & Shore (2008).
There have been several attempts to correlate the dust-forming capabilities of novae with other parameters, such as speed class, outburst luminosity, ejected mass, and outflow velocity; see Gehrz & Ney (1987), Gehrz (1988) and Evans & Rawlings (2008) for discussions. However it is likely that whether or not a nova forms dust depends on the complex interaction between a number of parameters, but it is apparent from Fig. 3 that there is an anti-correlation between the presence of strong coronal lines and the nova’s ability to form dust.
While the early (broad-band) IR observations found evidence for dust, they were not sufficiently detailed to say anything about the composition of the dust (although carbon was a strong candidate). However IR spectroscopy has been able to reveal spectral features of dust, including silicates and hydrocarbons.
4.2.1 Nature of the dust
Several cases exist showing that multiple types of astrophysical grains can form in the ejecta of a single nova. V842 Cen is known to have formed amorphous carbon, silicates, and hydrocarbons (see Gehrz, 1990), while QU Vul formed amorphous carbon, SiC, silicates, and hydrocarbons as the ejecta evolved (Gehrz et al., 1992).
V705 Cas was a particularly well-observed dusty nova (Mason et al., 1998; Evans et al., 2003, 2005), and displayed the characteristic deep minimum in the visual light curve. Ground-based IR spectroscopy was obtained for this object, from m (Fig. 7). The dust in this nova typifies many of the unusual (even anomalous)
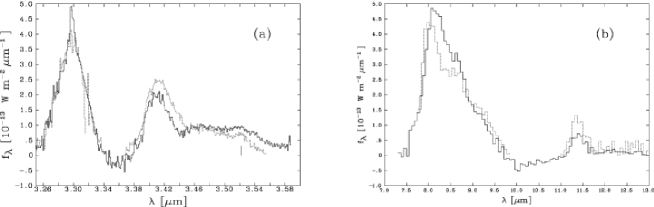
facets of nova dust, including the condensation of both oxygen- and carbon-rich dust, and the presence of AIR features. The presence of the silicate dust signature at 9.7m – normally indicative of an oxygen-rich environment for grain formation – and carbon/AIR emission – indicative of a carbon-rich environment – is at first sight paradoxical and contrary to the “CO paradigm” (see Section 3). The paradox may be resolved by the possibility that, in nova winds, the pre-dust chemistry does not enable CO formation to proceed to saturation, thus allowing the formation of both oxygen- and carbon-rich grain types. Alternatively, there may be significant abundance gradients in the ejected material, for example between the polar plumes and the equatorial ejecta in systems where rotation is high (see Gehrz et al., 1992). Such gradients are also suggested by emission line profiles (see Section 4.1.1 above).

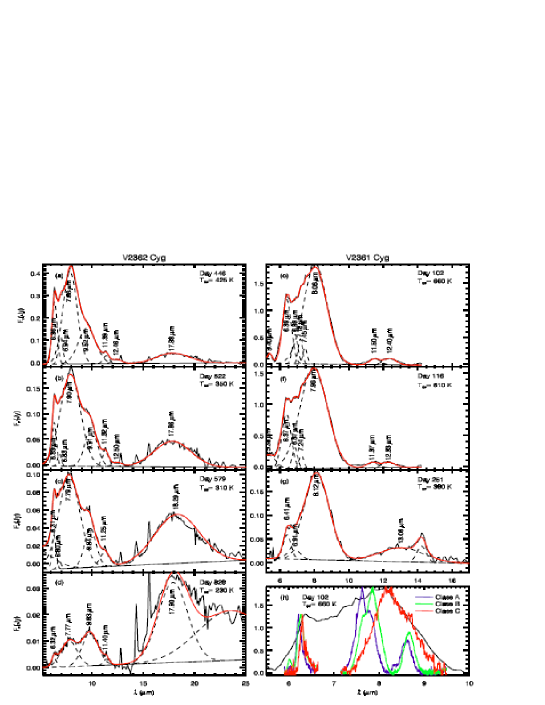
Observations with Spitzer have further transformed our view of dust formation and emission in novae. Fig. 8 shows two contrasting novae observed with Spitzer: V1065 Cen, which formed primarily silicate dust (Helton et al., 2010), and DZ Cru, which produced amorphous carbon dust and no (or negligible) silicate (Evans et al., 2010). In both cases the presence of nebular and fine-structure lines is evident but in the case of DZ Cru, there are additional broad features due to AIR emission (see below).
The broad dust continuum seen in Figs 7 and 8 is generally attributed to carbon and the presence of AIR features is consistent with this. It is likely that the dust is some form of hydrogenated amorphous carbon (HAC), in which H atoms are attached to the surface of amorphous carbon particles of size m, or polycyclic aromatic hydrocarbons (PAH) in which H atoms are attached to fused aromatic rings. However, as noted by Evans & Rawlings (1994), the lifetime of free-flying PAH molecules in the hard radiation field of novae is extremely short and if such exist in the nova environment, they may originate from the fragmentation of larger HAC particles.
4.2.2 The silicate features
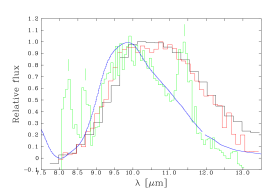
The 9.7m silicate feature arises from the stretching of the Si–O bond, while the 18m feature arises from bending of the O–Si–O bonds. These features do not therefore provide any diagnostic information (e.g. as to whether the silicate is forsterite, Mg2SiO4, or fayalite, Fe2SiO4), which requires observations at longer wavelengths. However the 9.7m feature in V1370 Aql and V838 Her (Gehrz et al., 1984; Smith et al., 1995, respectively) was broader than was the case in V705 Cas and in evolved oxygen-rich stars such as Cep, and peaks at longer wavelengths (see Fig. 9). This may be the result of annealing of the silicate in the strong, hard radiation field of the nova.
Note the relative weakness of the 18m silicate feature in V705 Cas 320 days after eruption (see Figs 7 and 9). While this tends to be less prominent than the 9.7m feature, it is normally seen in the IR spectra of evolved oxygen-rich stars (cf. the 18m silicate feature in Cep in Fig. 9). Laboratory work by Nuth & Hecht (1990) suggests that the 18m feature is relatively weak in freshly-condensed dust. Their experiments showed that the ratio of the integrated absorption strength of the 9.7m feature to that of the 18m feature decreases monotonically with increased processing by annealing and oxidation; they suggested that this ratio could therefore be an indicator of the age the silicate. Thus the relative weakness of the 18m feature in the young ejecta of V705 Cas is likely a pointer to the fact that the dust is “fresh”, and does indeed form in material ejected in the nova explosion. That the “9.7:18” ratio is a potential indicator of silicate age is consistent with the Spitzer IRS observations of V2362 Cyg, in which the 18m feature is initially (446 days after eruption) weak, but increases in strength over the subsequent 400 days (see Fig. 8).
4.2.3 The AIR features
AIR emission is frequently seen in novae (such as V842 Cen and V705 Cas; see Fig. 7, lower frames) displaying a deep minimum in the visual light curve; they were first seen in a nova in the case of V842 Cen (Hyland & McGregor, 1989). In most astrophysical sources (such as H ii regions, planetary nebulae, AGB stars etc.), AIR emission is attributed to PAH molecules (e.g. Tielens, 2008), or HAC, although each might represent the extreme ends of a size spectrum of carbonaceous dust grains.
Prominent AIR features are seen at 3.28m, 3.4m, 6.25m, 7.7m, 8.6m and 11.25m444There are other features at other, particularly longer, wavelengths but we do not discuss these here. and are much broader than emission lines originating in the gas phase. The 3.28m feature is attributed to C–H stretch in aromatic () hydrocarbons, the 3.4m feature to aliphatic (); the 7.7m feature is a blend of several C–C stretching modes, while the 11.25m feature is due to C–H out-of-plane bending (see Tielens, 2008, for a review).
In novae in which AIR features have been observed, the 3.4m feature is much stronger than the 3.28m feature (in contrast to the case in other astrophysical sources), while the “7.7” and “11.25” features appear at 8.1m and 11.4m respectively. In view of the large over-abundance of nitrogen in nova ejecta, the AIR carrier in novae will almost certainly be “contaminated” by N, which will have a significant effect on the properties of the AIR features (see e.g. Evans et al., 2005).
Peeters et al. (2002) have classified AIR features according to their relative strengths and novae AIR features seem to fit Peeters et al.’s “Class C”. Objects in this class show no 7.7m feature but instead a feature at 8.2m; moreover they also display a weak 6.25m feature, and an extremely weak 11.25m feature; these characteristics are very reminiscent of those seen in novae. In evolved and Herbig Ae/Be stars the wavelength of the “7.7” feature is highly environment-dependent, with a clear dependence of wavelength on the effective temperature of the exciting star (e.g. Peeters et al., 2002; Tielens, 2008, and references therein).
Objects in Peeters et al.’s Class C are cool K) evolved stars, in stark contrast to the effective temperature of stellar remnant of novae (expected to be K). It is curious that novae display AIR features that are reminsicent of cool stars rather than of the hot environment that one would expect. Evans et al. (2010) have suggested that this situation arises because the AIR carrier in novae has only recently been exposed to the hard radiation field of the nova, having been hitherto been protected within the dense clumps needed to form the dust in the first place, thus limiting the photo-processing it has experienced. Alternatively, it may be that only photons having lower energy ever penetrate deeply into the clumps, those of higher energy being converted to lower energy by Lyman and similar scattering at the clump surface, thus mimicking a low temperature environment.
The anomalous AIR features in novae are discussed by Helton et al. (2011), who present a detailed examination of the Spitzer spectra of V2361 Cyg and V2362 Cyg (see Fig. 10). In the case of V2362 Cyg the broad features around 9.5m and 18m may be due to silicates, which are absent in V2361 Cyg (see also above).
An alternative interpretation of the AIR features in novae is given by Kwok & Zhang (2011), who note that the features appear in novae as the dust is formed. They too have examined the Spitzer spectra of the two dusty novae V2361 Cyg and V2362 Cyg and conclude that the AIR features in novae (and in other sources) arise in complex organic solids which have a mixed composition. These materials (e.g. coals, kerogens) are present as an insoluble residue in carbonaceous chondrite meteorites and display not only the usual AIR features but also very broad “plateau” features.
5 The recurrent novae
A nova system that is observed to undergo a second eruption becomes a recurrent nova: the difference between classical and recurrents is the selection effect that a recurrent is a classical that has undergone more than one eruption (see Anupama, 2008; Evans et al., 2008, for recent reviews). Few recurrents are known, and those that are known form a very heterogeeous group. Other potential recurrents have been identified, on the basis of the nature of their secondaries and the amplitude at outburst (see e.g. Weight et al., 1994; Darnley et al., 2012, and references therein).
Since the widespread availability of IR in the 1970s there have been few RN eruptions and so few IR observations of RNe in outburst exist, especially longward of 3m. The first extensive IR observations were those of the 1985 eruption of RS Oph (Evans et al., 1988). In recent years, observations longward of 3m of the eruptions of RS Oph (2006) and T Pyx (2011) have been obtained and we describe these here.


5.1 RS Oph (2006)
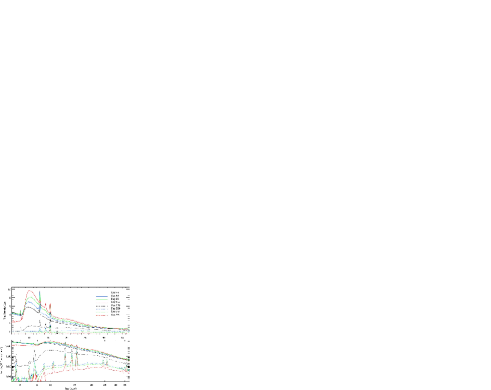
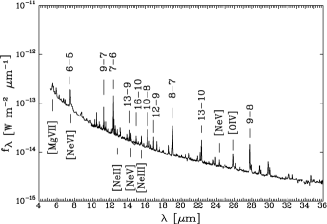
Spitzer IRS observations of the 2006 eruption of RS Oph are described by (Evans et al., 2007b, c, see Fig. 11). An observation 62.5 days after outburst shows a rich emission line spectrum (including fine-structure and coronal lines) super-imposed on a free-free continuum (Evans et al., 2007b). The presence of coronal lines is not unexpected as the ejected material from the 2006 eruption runs into and shocks the red giant wind (Bode & Kahn, 1985). However, unlike the case for classical novae, it is not straight-forward to use the fine-structure and coronal lines to determine abundances as the observed lines are a mix of shocked wind and ejecta. A first requirement is the determination of abundances in the wind, either by determining abundances in the atmosphere of the red giant (e.g. Pavlenko et al., 2008), or in the red giant wind (e.g. by analysing the IR spectrum of the flash-ionised wind; Evans et al., 2007a). Analysis of the coronal lines after the 2006 eruption indicates that there are two regions in the emitting gas, with temperatures K and K.
As the free-free emission declined the Spitzer observations of RS Oph revealed a major surprise: a substantial amount of silicate dust in the circumstellar environment (see Fig. 11, from Evans et al., 2007c). Note the strong 18m silicate feature, which indicates that the dust observed cannot be freshly condensed as this would show a weak 18m feature (see above; Nuth & Hecht, 1990). The relatively strong 18m feature indicates that the dust is “old”, and that there is a substantial amount of dust in the environment of the RS Oph binary that is completely oblivious to the nova eruption.
RS Oph was observed in the course of the IRAS survey in 1983, and Spitzer observations that show the silicate emission in the aftermath of the 2006 eruption are super-imposed on the IRAS data in Fig. 11 (van Loon, 2008). That the IRAS data were obtained before either the 1985 or the 2006 eruptions reinforces the fact that the dust is pre-existing, and a constant feature of the RS Oph system; a substantial fraction of the red giant wind must (as noted by Woodward et al., 2008), be “blissfully unaware” of the violent events that occur near it. This silicate dust presumably originates in the wind of the red giant star in the RS Oph binary system and its discovery has major implications for the evolution of the underlying binary, and for mass-loss from the system. Given that the 2006 observations were the the first to see the silicate, it is not known whether the 2006 erupion (and indeed previous eruptions) affected the amount of dust (or indeed its nature) in the circumstellar environment; observations of the next outburst in the same wavelenth range will be valuable to see if the eruptions have any effect on the dust.
5.2 T Pyx (2011)
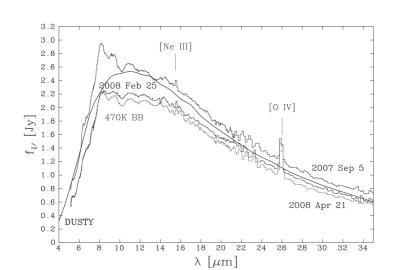
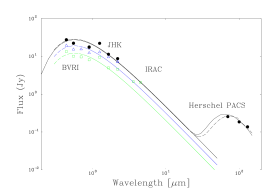
T Pyx was the first nova to be identified as a recurrent, and has undergone 6 nova eruptions since 1890. Its most recent eruption (2011) was observed with Spitzer and Herschel. The SED 26.2 days after the eruption is shown in Fig. 12 (black curve) and is consistent with emission by dust longward of m. Evans et al. (2012) conclude that the emission is due to pre-existing dust in the environment of T Pyx, the result of the sweeping up of interstellar dust, either by winds or by material ejected in the course of previous recurrent nova eruptions.

T Pyx is the first nova in which an “infrared echo” – postulated by Bode & Evans (1980) to account for the dust emssion – has been observed. If this is indeed the case the reverberation effect means that the far-IR emission should be detectable for several years after the 2011 eruption (Evans et al., 2012).
T Pyx is detected in the 2MASS (Skrutskie et al., 2006) and WISE (Wright et al., 2010) sky surveys and the SED based on these is also shown in Fig. 12. There seems to be an excess at 22m, although observations at other wavelengths would be valuable to confirm this. If so, the quiescent data seem consistent with the presence of cool dust in the environment of T Pyx between outbursts.
6 Future prospects
6.1 The Stratospheric Observatory for Infrared Astronomy (SOFIA)
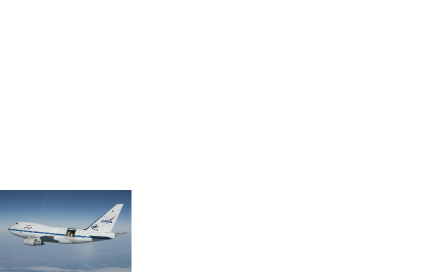
The US/German Stratospheric Observatory for Infrared Astronomy (SOFIA), a joint project of NASA and the Deutsches Zentrum für Luft und Raumfahrt (DLR), is a gyro-stabilized 2.5-meter clear aperture IR telescope mounted in the aft fuselage of a Boeing 747-SP aircraft (see Fig. 13 and Young et al., 2012). The observatory will make sensitive IR spectroscopic measurements at wavelengths from 0.3m to 1.6 mm. SOFIA, which will fly until the mid-2030s, will be a key facility for chemical/dynamical studies of classical and recurrent novae. The characteristics of the initial suite of spectrometers are summarized in Table 3.
SOFIA will fly at altitudes as high as 45,000 feet (13.7 km), above 99.8% of the remaining atmospheric water vapour. At this altitude, the precipitable atmospheric water typically has a column depth of less than 10m, 20–100 times lower than at good terrestrial sites. The atmospheric transmission averages 80% or better across SOFIA’s wide wavelength range.
| Nameb | Description | PI | Institution | Wavelengths | Spectral |
|---|---|---|---|---|---|
| (m) | Resolution | ||||
| FORCAST | Mid-Infrared Camera and Grism Spectrometer | T. Herter | Cornell | 5–40 | 90–1200 |
| GREAT | Heterodyne Spectrometer | R. Güsten | MPIfR | 60–240 | 106–108 |
| FLITECAM | Near-Infrared Camera and Grism Spectrometer | I. McLean | UCLA | 1–5 | 900–1700 |
| EXES | Mid-Infrared Spectrometer | M. Richter | UC Davis | 5–28 | 3000, 104, 105 |
| FIFI-LS | Integral Field Far-Infrared Spectrometer | A. Krabbe | U Stuttgart | 42–210 | 1000–3750 |
(a) Details available at http://www.sofia.usra.edu/Sciecnce/instruments;
(b) Earliest availability for GI programmes:
Cycle 1 (2013): FORCAST with grisms, and GREAT; Cycle 2 (2014): EXES and
FIFI-LS.
SOFIA has several features that will make it an outstanding facility for observing nova explosions (Gerhrz et al., 2009):
-
1.
Its mobility – the ability to travel to any airfield that can handle a 747 on short notice – will facilitate the timely monitoring of the temporal development of nova events anywhere in the sky. Coverage of the entire development of a single nova requires observational cadences that cover events that develop on time-scales of days, weeks, and months.
-
2.
The spectroscopic capabilities of the instruments summarised in Table 3 will enable the recording of many forbidden lines obscured by the atmosphere from ground-based observatories and unavailable to the spectrometers of other space missions. An assessment of the strengths of these lines is necessary to determine accurate elemental abundances in nova ejecta.
-
3.
High resolution spectroscopy of these lines will provide a powerful probe of the physical conditions (e.g., density and temperature), ionisation state, energetics, mass, and kinematics of the ejected gas through studies of the atomic fine structure lines of [O i] (63m and 145m), [O iii] (52m, 88m), [O iv] (25.9m), [C ii] (158m), [S i] (26m), [Si ii] (34m), and [S iii] (18.7m); see also Tables 1 and 2. Furthermore, many forbidden lines of neon, whose abundance is an indicator of progenitor mass and WD type, lie in obscured atmospheric bands that can be observed by SOFIA.
-
4.
SOFIA is unique in that the spectral coverage and resolution of its spectrometers is perfect for assaying the detailed mineralogy of nova dust, a task that was only cursorily begun by Spitzer IRS observations. In particular it will be possible to make a detailed study of silicate crystallinity (see e.g. Fabian et al., 2002; Molster et al., 2002) in novae that produce silicate dust (see Section 4.2), and of AIR fetaures at wavelengths not reached by the Spitzer IRS (see Tielens, 2008). Of particular interest are the far-IR AIR features expected to be associated with the low-lying vibrational modes corresponding to the “drum-head” modes of large PAH molecules.
SOFIA observing time for General Investigator (GI) programmes will be competed for and awarded on annual cycles. Proposal awards for Cycle 1 will be announced in late August, 2012 and observations will occur during 2012 December – 2013 December. Cycle 2 proposals will be solicited in 2012 December – 2013 Janurary, and will be harvested in 2013 April for flight during 2014 January – 2014 December. By 2014, the SOFIA programme expects to be doing up to hours of science observations per year (12% of the total time). Observing opportunities will be announced from time to time on the SOFIA website at www.sofia.usra.edu.
6.2 The James Webb Space Telescope
NASA’s James Webb Space Telescope (JWST Gardner et al., 2006) is now working to a 2018 launch, with an expected ten year lifetime. It will have two spectrometers capable of following the temporal spectral development of classical and recurrent novae. The near-IR spectrometer (NIRSPEC) will cover 1–5m with spectral resolutions of , and the mid-IR instrument (MIRI) will cover 5–28m at . These instruments have integral field units and are not especially efficient for viewing single point sources like Galactic novae.
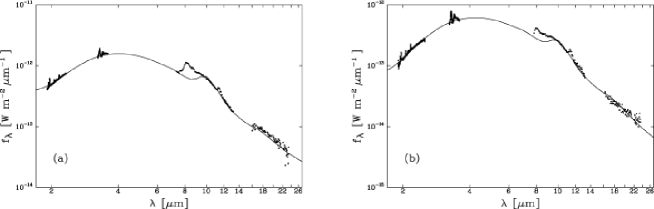
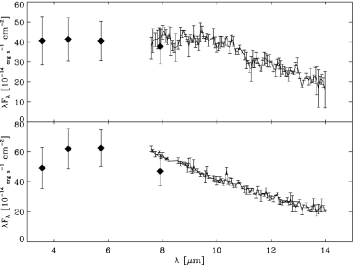
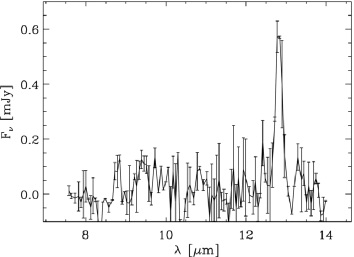
However, the very high sensitivity of these instruments make them well suited for discovering nova populations in external galaxies. Their potential in this regard is well illustrated by Spitzer InfraRed Array Camera (Fazio et al., 2004) and IRS observations of novae in M31 by Shafter et al. (2011). Fig. 14 shows the IR SEDs of the two novae M31N 2006-09c and 2006-10a. The IR excess, peaking in at m, is evident in the case of M31N 2006-10a; this nova had days (in the band), characteristic of dust-forming novae in the Galaxy. The nova M31N 2007-11e showed clear evidence for emission in the [Ne ii]12.81m fine-structure line, the Humphreys 12.37m line being very weak or absent. While the presence of the [Ne ii] line is a necessary, but not sufficient, condition for classification as a neon nova, there is clearly the potential to undertake unbiassed population studies of extragalactic novae with JWST. This is all the more so as extinction – even less well known in extragalactic environments than it is in the Galaxy – is a relativley minor irritant in the IR.
On the other hand, viewing constraints imposed by the L-2 orbit will likely prevent JWST from making timely target of opportunity observations of many novae. The spectral coverage limits JWST nova observations to wavelengths shorter than 28m.
6.3 Other Facilities
A number of very large aperture telescopes capable of 3–25m ground-based follow-up of nova events have recently come into operation or will soon begin full-time operations. These include 8–10 m telescopes such as Gemini (Roche et al., 2001), VLT (Merkle & Schneermann, 1986), Keck (Nelson, 1989), and the Large Binocular Telescope (LBT; Hill, 1997). In addition to their sensitive spectroscopic capabilities, several of these telescopes are equipped with laser guide stars and adaptive optics that can achieve spatial resolutions of at wavelengths m that may enable them to image young nova ejecta in some cases.
Future very large ground-based giant segmented mirror telescope (GSMTs) such as the Giant Magellan Telescope (GMT; Johns, 2004), the Thirty Meter Telescope (TMT; Nelson, 2008), and the European Extremely Large Telescope (E-ELT; Monnet, 2007) will extend the spectroscopic and imaging capabilities even further.
Prospective observers should consult the websites of all of these facilities for information about progress and observing opportunities
7 Concluding remarks
Over the past years IR observations have proven to be pivotal in advancing our understanding of the nova phenomenon, and pan-chromatic observations – combining IR with optical, UV and X-ray observations – has been especially effective (as in the case of RS Oph for example). It is highly desirable that future novae (both classical and recurrent) continue to be observed over as broad a wavelength range as possible, particularly as systematic observations of extragalactic novae will soon be a real possibility.
While great strides have been made in recent years, there remain some substantial gaps in our understanding (and IR observational coverage) of novae. For example we have little IR spectroscopy of molecules in novae, with CO being the only molecule securely detected in the IR to date (see above, Evans & Rawlings, 2008, and references therein); molecular rotational/vibrational can provide crucial information about isotope ratios, critical to TNR modelling.
However we can expect that, in the next decade, SOFIA will fill in the IR spectroscopic gaps tantalisingly opened up by Spitzer. In particular fine-structure lines beyond the Spitzer IRS range will become accessible, particularly in old, low density, remnants (such as DQ Her). Furthermore, it will be possible for the first time to undertake a detailed mineralogical study of nova dust, particularly nova silicates, and the way in which the silicate evolves as it is processed.
To paraphrase Winston Churchill: Spitzer “is not the end. It is not even the beginning of the end. But it is, perhaps, the end of the beginning”.
Acknowledgements
RDG was supported by NASA and the United States Air Force.
References
- Anupama (2008) Anupama, G. C., 2008, in RS Ophiuchi (2006) and the Recurrent Nova Phenomenon, eds A. Evans, M. F. Bode, T. J. O’Brien, M. J. Darnley, Astronomical Society of the Pacific Conference Series volume 401, p. 31
- Asplund et al. (2009) Asplund, M., Grevesse, N., Sauval, A., J., Scott, P., 2009, ARAA, 47, 481
- Banerjee & Ashok (2012) Banerjee, D. P. K., Ashok, N., 2012, BASI, XX, XXX
- Bath (1978) Bath, G. T., 1978, MNRAS, 182, 35
- Bath & Harkness (1989) Bath, G. T. & Harkness, R. P., 1989, in Classical Novae, page 61, first edition, eds M. F. Bode & A. Evans, Wiley, Chichester.
- Bode & Evans (1980) Bode, M. F., Evans, A., 1980, A&A, 89, 158
- Bode & Evans (2008) Bode, M. F., Evans, A., 2008, eds Classical Novae, second edition, Cambridge University Press
- Bode & Kahn (1985) Bode, M. F., Kahn, F, 1985, MNRAS, 217, 205
- Darnley et al. (2012) Darnley, M. J., Ribeiro, V. A. R. M., Bode, M. F., Hounsell, R. A., Williams, R. P., 2012, ApJ, 746, 61
- de Graauw et al. (1996) de Graauw, T., et al., 1996, A&A, 315, L49
- Ennis et al. (1977) Ennis, D., Becklin, E. E., Beckwith, S., Elias, J., Gtley, I., Matthews, K., Neugebauer, G., 1977, ApJ, 214, 478
- Evans et al. (2008) Evans, A., Bode, M. F., O’Brien, T. J., Darnley, M. J., 2008, eds RS Ophiuchi (2008) and the Recurrent Nova Phenomenon, Astronomical Society of the Pacific Conference Series volume 401
- Evans et al. (1988) Evans, A., Callus, C. M., Albinson, J. S., Whitelock, P. A., Glass, I. S., Carter, B., Roberts, G., 1988, MNRAS, 234, 755
- Evans et al. (1997) Evans, A., Geballe, T. R., Rawlings, J. M. C., Eyres, S. P. S., Davies, J. K., 1997, MNRAS, 292, 192
- Evans et al. (2003) Evans, A. et al., 2003, AJ, 1981
- Evans et al. (2005) Evans, A., Tyne, V. H., Smith, O., Geballe, T. R., Rawlings, J. M. C., Eyres, S. P. S., 2005, MNRAS, 360, 1483
- Evans & Rawlings (1994) Evans, A., Rawlings, J. M. C., 1994, MNRAS, 269, 427
- Evans & Rawlings (2008) Evans, A., Rawlings, J. M. C., 2008, in Classical Novae, page 308, second edition, eds M. F. Bode, A. Evans, Cambridge University Press
- Evans et al. (2003) Evans, A., et al., 2003, AJ, 126, 1981
- Evans et al. (2007a) Evans, A., et al., 2007a, MNRAS, 374, L1
- Evans et al. (2007b) Evans, A., et al., 2007b, ApJ, 663, L29
- Evans et al. (2007c) Evans, A., et al., 2007c, ApJ, 671, L157
- Evans et al. (2010) Evans, A., et al., 2010, MNRAS, 406, L85
- Evans et al. (2012) Evans, A., et al., 2012, MNRAS, 424, L69
- Fabian et al. (2002) Fabian, D., Henning, T., Jäger, C., Mutschke, H., Dorschner, J., Wehrhan, O., 2001, A&A, 378, 184
- Fazio et al. (2004) Fazio, G. G., et al. 2004, ApJS, 154, 10
- Ferland & Shields (1978a) Ferland, G. J., Shields, G. A., 1978a, ApJ, 224, L15
- Ferland & Shields (1978b) Ferland, G. J., Shields, G. A., 1978b, ApJ, 226, 172
- Ferland et al. (1984) Ferland, G. J., Williams, R. E., Lambert, D. L., Slovak, M., Gondhalekar, P. M., Truran, J. W., 1984, ApJ, 281, 194
- Ferland et al. (1998) Ferland, G. J., Korista, K. T., Verner, D. A., Ferguson, J. W., Kingdon, J. B., Verner, E. M., 1998, PASP, 110, 761
- Gardner et al. (2006) Gardner, J. P., et al., 2006, Space. Sci. Rev., 123, 485
- Gehrz (1988) Gehrz, R. D., 1988, ARAA, 26, 377
- Gehrz (1990) Gehrz, R. D., 1990, in Physics of Classical Novae, IAU Colloquium 122, eds A. Cassatella, R. Viotti, Springer-Verlag, p. 138
- Gehrz (2008) Gehrz, R. D., 2008, in Classical Novae, page 167, second edition, eds M. F. Bode, A. Evans, Cambridge University Press
- Gehrz & Ney (1987) Gehrz, R. D., Ney, E. P., 1987, Proc. Nat. Acad. Sci., 84, 6961
- Gerhrz et al. (2009) Gehrz, R. D., Becklin, E. E., de Pater, I., Lester, D. F., Roellig, T. L., Woodward, C. E., 2009, Adv. Space Res., 44, 413
- Gehrz et al. (1985) Gehrz, R. D., Grasdalen, G. L., Hackwell, J. A., 1985, ApJ, 298, L47
- Gehrz et al. (1980) Gehrz, R. D., Grasdalen, G. L., Hackwell, J. A., Ney, E. P. 1980, ApJ, 237, 855
- Gehrz et al. (1976) Gehrz, R. D., Hackwell, J. A., Briotta, D., 1976, BAAS, 8, 509
- Gehrz et al. (1984) Gehrz, R. D., Ney, E. P., Grasdalen, G. L., Hackwell, J. A., Thronson, H. A., 1984, ApJ, 281, 303
- Gehrz et al. (1992) Gehrz, R. D., Jones, T. J., Woodward, C. E., Greenhouse, M. A., Wagner, R. M., Harrison, T. E., Hayward, T. L., Benson, J., 1992, ApJ, 400, 671
- Gehrz et al. (1998) Gehrz, R. D., Truran, J. Y., Williams, R. E., Starrfield, S., 1998, PASP, 110, 3
- Gehrz et al. (2007) Gehrz, R. D., et al., 2007, Rev. Sci. Instr., 78, 011302
- Gehrz et al. (2008) Gehrz, R. D., et al., 2008, ApJ, 672, 1167
- Geisel et al. (1970) Geisel, S. L., Kleinmann, D. E., Low, F. J., 1970, ApJ, 161, L101
- Greenhouse et al. (1990) Greenhouse, M. A., Grasdalen, G. L., Woodward, C. E., Benson, J., Gehrz, R. D., Rosenthal, E., Strutskie, M. F., 1990, ApJ, 352, 307
- Helton et al. (2010) Helton, L. A., et al., 2010, AJ, 140, 1347
- Helton et al. (2011) Helton, L. A., Evans, A., Woodward, C. E., Gehrz, R. D., 2011, in PAHs and the Universe, EAS Publication Series, Vol. 40, eds C. Joblin, A. G. G. M. Tielens, p. 407
- Helton et al. (2012) Helton, L. A., Gehrz, R. D., Woodward,. C. E., Wagner, R. M., Vacca, W. D., Evans, A., Krautter, J., Schwarz, G. J., Shenoy, D. P., Starrfield, S., 2012, ApJ, 755, 37
- Hill (1997) Hill, J. M. 1997, Proceedings of the SPIE 2871, 57
- Houck et al. (2004) Houck, J. R., et al., 2004, ApJS, 154, 18
- Hyland & McGregor (1989) Hyland, A. R., McGregor, P., 1989, in Interstellar Dust, IAY Symposium 135, contributed papers, eds L. J. Allamandola, A. G. G. M. Tielens, NASA Conference publication, p. 101
- Ivezić & Elitzur (1997) Ivezić, Z., Elitzur, M., 1997, MNRAS, 287, 799
- Johns (2004) Johns, M. W. 2004, Proceedings of the SPIE 5382, 85
- José & Shore (2008) José, J., Shore, S. N., 2008, in Classical Novae, page 121, second edition, eds M. F. Bode & A. Evans, Cambridge University Press
- Kessler et al. (1996) Kessler, M. F., et al., 1996, A&A, 315, L27
- Krautter (2008) Krautter, J., 2008, in Classical Novae, page 232, second edition, eds M. F. Bode & A. Evans, Cambridge University Press
- Kwok & Zhang (2011) Kwok, S., Zhang, Y., 2011, Nature, 479, 80
- Lutz (2002) Lutz, D., 2002, http://www.mpe-garching.mpg.de/iso/linelists/FSlines.html
- Lyke et al. (2001) Lyke, J. E. et al., 2001, AJ, 122, 3305
- Lyke et al. (2003) Lyke, J. E. et al., 2003, AJ, 126, 993
- Lynch et al. (2006) Lynch, D. K., et al., 2006, ApJ, 638, 987
- Lynch et al. (2008) Lynch, D. K., et al., 2008, AJ, 136, 1815
- McLaughlin (1935) McLaughlin, D. B., 1935, Publ. AAS, 8, 145
- Martin (1989a) Martin, P. G., 1989a, in Classical Novae, page 93, first edition, eds M. F. Bode & A. Evans, Wiley, Chichester.
- Martin (1989b) Martin, P. G., 1989b, in Classical Novae, page 113, first edition, eds M. F. Bode & A. Evans, Wiley, Chichester.
- Mason et al. (1998) Mason, C. G., Gehrz, R. D., Woodward, C. E., Similowitz, J. B., Hayward, T. L., Houck, J. R., 1998, ApJ, 494, 783
- Merkle & Schneermann (1986) Merkle, F., Schneermann, M., 1986, Sterne und Weltraum 25, 460
- Mitchell & Evans (1984) Mitchell, R. M., Evans, A., 1984, MNRAS, 209, 945
- Mitchell et al. (1984) Mitchell, R. M., Evans, A., Albinson, J. S., 1986, MNRAS, 221, 663
- Molster et al. (2002) Molster, F. J., Waters, L. B. F. M., Tielens, A. G. G. M., 2002, A&A, 382, 222
- Monnet (2007) Monnet, G. J. 2007, Highlights of Astronomy 14, 524
- Norriset et al. (2005) Morriset, C., Stasińska, G., Peña, M., 2005, MNRAS, 360, 499
- Nelson (1989) Nelson, J. 1989, American Scientist 77, 170.
- Nelson (2008) Nelson, J. 2008, Proceedings of the SPIE, 6986, 2
- Ney & Hatfield (1978) Ney, E. P., Hatfield, B. F., 1978, ApJ, 219, L111
- Nuth & Hecht (1990) Nuth, J. A., Hecht, J. H., 1990, Ap. Sp. Sci., 1990, 163, 79
- Pavlenko et al. (2008) Pavlenko, Ya. V., Evans, A., Kerr, T., Yakovina, L., Woodward, C. E., Lynch, D., Rudy, R., Pearson, R. L., Russell, R. W., 2008, A&A, 485, 541
- Payne-Gaposchkin (1957) Payne-Gaposchkin, C. E., 1957, The Galactic Novae, North Holland
- Peeters et al. (2002) Peeters, E., Hony, S., Van Kerckhoven, C., Tielens, A. G. G. M., Allamandola, L. J., Hudgins, D. M., Bauschlicher, C. W., 2002, A&A, 390, 1089
- Roche et al. (2001) Roche, P., et al., 2001, Astronomische Gesellschaft Abstract Series 18, 224
- Rushton et al. (2008) Rushton, M. T., Evans, A., Eyres, S. P. S., van Loon, J. Th., Smalley, B., 2008, MNRAS, 386, 289
- Salama et al. (1996) Salama, A., Evans, A., Eyres, S. P. S., Leech, K., Barr, P., Kessler, M. F., 1996, A&A, 315, L209
- Salama et al. (1999) Salama, A., Eyres, S. P. S., Evans, A., Geballe, T. R., Rawlings, J. M. C., 1999, MNRAS, 304, L20
- Schwarz (2002) Schwarz, G. J., 2002, ApJ, 577, 940
- Schwarz et al. (2007) Schwarz, G. J. et al., 2007, AJ, 134, 516
- Seaquist & Bode (2008) Seaquist, E. R., Bode, M. F., 2008, in Classical Novae, page 141, second edition, eds M. F. Bode & A. Evans, Cambridge University Press
- Shafter et al. (2011) Shafter, A. W., Bode, M. F., Darnley, M. J., Misselt, K. A., Rubin, M., Hornoch, K., 2011, ApJ, 727, 50
- Shore & Gehrz (2004) Shore, S. N., Gehrz, R. D., 2004, A&A, 417, 695
- Shore et al. (1994) Shore, S. N., Starrfield, S., Gonzalez-Riestra, R., Hauschildt, P. H., Sonneborn, G., 1994, Nature, 369, 539
- Skrutskie et al. (2006) Skrutskie, M. F., et al., 2006, AJ, 131, 1163
- Smith et al. (1995) Smith, C. H., Aitken, D. K. Roche, P. F., Wright, C. M., 1995, MNRAS, 277, 259
- Smith et al. (2001) Smith, N., Gehrz, R. D., Goss, W. M., 2001, AJ, 122, 2700
- Smith et al. (2011) Smith, N., Gehrz, R. D., Campbell, R., Kassis, M., Le Mignant, D., Kuluhiwa, K., Filippenko, A. V., 2011, MNRAS, 418, 1959
- Starrfield et al. (2008) Starrfield, S., Iliadis, C. Hix, W. R., 2008, in Classical Novae, page 77, second edition, eds M. F. Bode & A. Evans, Cambridge University Press
- Tielens (2008) Tielens, A. G. G. M., 2008, ARAA, 46, 289
- van Loon (2008) van Loon, J. Th., 2008, in RS Ophiuchi (2006) and the Recurrent Nova Phenomenon, eds A. Evans, M. F. Bode, T. J. O’Brien, M. J. Darnley, Astronomical Society of the Pacific Conference Series volume 401, p. 90
- Wallerstein (2008) Wallerstein, G., 2008, in RS Ophiuchi (2006) and the Recurrent Nova Phenomenon, eds A. Evans, M. F. Bode, T. J. O’Brien, M. J. Darnley, Astronomical Society of the Pacific Conference Series volume 401, p. 14
- Walter et al. (2004) Walter, F. M., Field-Pollatou, A., Miner, J., Nyquist, R., Howell, S. B., Stringfellow, G. S., 2004, AAS, 36, 1618
- Weight et al. (1994) Weight, A., Evans, A., Naylor, T., Wood, J. H., Bode, M. F., 1994, MNRAS, 266, 761
- Werner et al. (2004) Werner, M. W., et al., 2004, ApJS, 154, 309
- Woodward et al. (2008) Woodward, C. E., Helton, L. A., Evans, A., van Loon, J. Th., Gehrz, R. D., et al. 2008, in RS Ophiuchi (2006) and the Recurrent Nova Phenomenon, eds A. Evans, M. F. Bode, T. J. O’Brien, M. J. Darnley, Astronomical Society of the Pacific Conference Series volume 401, p. 260
- Wright et al. (2010) Wright, E. L., et al., 2010, AJ, 140, 1868
- Young et al. (2012) Young, E. T., et al., 2012, ApJ, 749, L17