The Chemical Effects of Mutual Shielding in Photon Dominated Regions
Abstract
We investigate the importance of the shielding of chemical photorates by molecular hydrogen photodissociation lines and the carbon photoionization continuum deep within models of photon dominated regions. In particular, the photodissociation of N2 and CN are significantly shielded by the H2 photodissociation line spectrum. We model this by switching off the photodissociation channels for these species behind the HiH2 transition. We also model the shielding effect of the carbon photoionization continuum as an attenuation of the incident radiation field shortwards of 1102 Å. Using recent line and continuum cross section data, we present calculations of the direct and cosmic ray induced photorates for a range of species, as well as optically thick shielding factors for the carbon continuum. Applying these to a time dependent PDR model we see enrichments in the abundances of N2, N2H+, NH3 and CN by factors of in the extinction band A to A for a range of environments. While the precise quantitative results of this study are limited by the simplicity of our model, they highlight the importance of these mutual shielding effects, neither of which has been discussed in recent models.
keywords:
astrochemistry – ISM: molecules1 Introduction
Photodissociation or Photon Dominated Regions (PDRs) are pervasive, ubiquitous components of the interstellar medium, being the interface between the partially ionized/atomic component and the neutral, dense, molecular component. Examples of PDRs include the boundaries of molecular clouds subjected to the interstellar radiation field, protoplanetary discs irradiated by accreting protostar and the interstellar medium of starburst galaxies illuminated by clusters of massive star formation. These interfaces are chemically rich and they often dominate the molecular emission from the host regions, due to the relatively high excitation of the molecular gas. Moreover, as earlier, simplistic assumptions about the geometries of these regions gives way to more realistic, complex morphologies, it would seem that a larger proportion of interstellar gas is contained within PDRs.
However, the physical and chemical structure of PDRs is complex and only partially described by existing models. The thermal balance in PDRs is determined by heating by ambient and stellar far–ultraviolet radiation (eV) and cooling by atomic/molecular line emission and continuum emission by dust (Hollenbach & Tielens 1999; Sternberg 2004). This in turn depends on the chemistry. The transition from atomic to molecular gas is defined by the radiative transfer, coupled to the photochemistry, which entails complex self– and mutual–shielding effects.
It is usually reasonable to assume that H2, CO and its isotopologues are the only molecular species that have large enough abundances to result in significant absorption of the incident radiation field. The primary consequence of this is the increasing self–shielding of the photoreaction as the transition becomes more optically thick. In addition, where there is overlap between the absorption lines of different species, mutual shielding will occur. Also, one must consider the contributions to the UV opacity from the carbon ionization continuum (for Å) and absorption by dust. This leads to a range of possible mutual and self–shielding effects as listed below:
-
1.
H2 self–shielding,
-
2.
CO self–shielding,
-
3.
H2, CO and CO isotopologue mutual–shielding,
-
4.
Mutual shielding by coincident Lyman transition lines of Hi and Lyman and Werner transition lines of H2,
-
5.
Shielding of all species by dust absorption,
-
6.
Shielding of H2 and CO by the carbon ionization continuum, and
-
7.
Shielding of other species by all of the above processes.
Of these, the cross section for attenuation by the dust continuum is approximately constant over the wavelength ranges of individual photoreaction channels and so is separable from the other shielding terms. In practice, the theoretical studies are somewhat limited by the paucity of laboratory and theoretical data for molecules other than H2 and CO.
Tielens & Hollenbach (1985) developed a PDR model to study the chemistry and thermal balance of gas with density illuminated by far-ultraviolet fluxes times more intense than the interstellar radiation field. They identified the presence of several physically distinct regions within PDRs, including an HiH2 transition zone at A and a complex, warm CCCO transition zone at A. Their model, which included carbon continuum self–shielding, yielded Ci column densities of cm-2 at which levels the continuum is very optically thick. Similarly, Rawlings (1988) developed a photochemical model of the (dust–free) PDR in the vicinity of a nova, which concentrated on the mutual shielding between H2, CO and Ci.
Subsequent studies, including the PDR comparison/benchmarking study of Röllig et al. (2007), although more sophisticated than the earlier models, and employing accurate photoreaction data for CO and H2, essentially confirmed the basic structure with the CCCO transition occurring at A for ncm-3 and . These various models take careful account of the overlap between the CO and H2 absorption lines and include the dust continuum, but do not make specific reference to shielding by the Ci ionization continuum.
With the availability of reliable wavelength and oscillator strength data for the photodissociation of CO, a much more detailed and accurate treatment of the self/mutual shielding of H2 and CO has been possible. van Dishoeck & Black (1988) considered the photodissociation of CO and its main isotopologues together with H and H2, including self– and mutual–shielding effects. They also included shielding by dust and referred to the attenuation by the carbon continuum. As shown in that paper (e.g. see Fig. 4), when the CO, Hi and H2 absorption lines become very optically thick, they can effectively blanket a significant fraction of the continuum in the Å Å wavelength range, with implications for the photodissociation rates of other species.
Visser et al. (2009) included self–shielding, mutual–shielding and shielding by H and H2 to calculate the photodissociation rates of CO and its isotopologues, including rarer variants. For these species only, the photodissociation rate coefficient can be written as:
| (1) |
where is the unattenuated rate, is the shielding function, is the (separable) dust extinction term, and represents other factors, such as the Doppler widths of the absorption lines, the excitation temperatures for CO and H2, and ratios of the column densities of the CO isotopologues. As with previous studies the line and continuum attenuation components were treated as separable. However, as pointed out by van Dishoeck (1988) the Av dependence does not include the attenuation at Å by H2 line/continuum and Ci continuum absorption which will be particularly important for species like CN and N2, which photodissociate at the shortest wavelengths.
Thus, the earliest studies of PDRs (e.g. Tielens & Hollenbach 1985) – although lacking the details of more recent models – attempted to deal with most of the shielding effects listed above. In subsequent studies all discussion of the role of the carbon ionization continuum is seemingly absent. This is presumably on the assumption – which may or may not be valid – that dust extinction dominates. However, the cross section for carbon photoionization is cm2. It is fairly reasonable to assume that column densities of atomic carbon in excess of 1017cm-2 will pertain deep within PDRs (e.g. Fig 11 of Visser et al. 2009) and so this opacity source must be considered.
In addition, the more recent PDR models have tended to concentrate on the carbon budget, while the effects of mutual shielding by H2 and CO on other molecules have been largely overlooked. In this study we consider two of these effects; the mutual shielding by:
-
1.
molecular hydrogen lines, and
-
2.
the carbon ionization continuum.
Critically, there is extensive overlap of both of these with the photodissociation cross sections of CN and N2. The mutual shielding effects therefore have the potential to promote nitrogen-based chemistry at extinctions much shallower than currently seen in simulations. This paper presents shielding factors for a range of species due to these effects and investigates their influence on the chemical structure.
Our calculation of the degree of mutual shielding by H2 dissociation and carbon ionization are presented in Section 2. These shielding factors are then implemented in a simple PDR model, described in Section 3 with results presented in Section 4. We close with a discussion of our results and concluding remarks in Section 5.
2 Photoreaction Rates
In PDRs, the shielding of the incident radiation field by molecules is typically a combination of line and continuum processes leading to a complex radiative transfer problem. Most models include self shielding by CO and H2 by adding multiplicative shielding factors to their photorates as described above. We extend this procedure to investigate mutual shielding by the H2 line and Ci ionization continuum absorption. In this section we detail our method for calculating photoreaction rates and shielding factors for these species.
2.1 Direct Photorates
| Species | Photorate / s-1 | Maximal Carbon | CR Induced Photoreaction | Reference |
|---|---|---|---|---|
| Shielding Factor, Si | Efficiency, pM | |||
| C | 0.000 | 264.8 | vD88 | |
| C- | 0.994 | 1037.8 | B62 | |
| CH | 0.142 | 547.7 | vD88 | |
| CH2 | 0.449 | 300.0 | B77 | |
| CH3 | 0.600 | 509.5 | BD77 | |
| NH | 0.000 | 22.0 | B77 | |
| NH2 | 0.000 | 149.3 | RDB93 | |
| NH3 | 0.298 | 230.5 | vD88 | |
| O2 | 0.000 | 57.7 | vD88 | |
| OH | 0.000 | 26.6 | B77 | |
| H2O | 0.000 | 24.5 | vD88 | |
| Na | 0.829 | 9.1 | vD88 | |
| HCO | 0.590 | 499.2 | RDB93 | |
| H2CO | 0.215 | 379.5 | vD88 | |
| NO | 0.328 | 218.9 | vD88 | |
| S | 0.343 | 480.2 | vD88 | |
| H2S | 0.344 | 594.4 | vD88 |
| Species | Photorate / s-1 | Maximal Carbon | CR Induced Photoreaction | Reference |
|---|---|---|---|---|
| Shielding Factor, Si | Efficiency, pM | |||
| H H+ + H | 0.778 | 427.7 | vD88 | |
| H H + H | 0.000 | 0.15 | KB78 | |
| H H2 + H+ | 0.000 | 0.15 | KB78 | |
| CO O + C | 0.000 | 105.0, see text | vD88 | |
| CO+ C+ + O | 0.954 | 45.7 | vD88 | |
| CH C + H | 0.975 | 465.4 | vD88 | |
| CH+ C + H+ | 0.036 | 254.7 | vD88 | |
| CH2 CH + H | 1.000 | 200.4 | vD88 | |
| CH CH+ + H | 0.461 | 66.1 | vD88 | |
| CH CH + H+ | 0.461 | 66.1 | vD88 | |
| CH C+ + H2 | 0.461 | 66.1 | vD88 | |
| CH3 CH2 + H | 1.000 | 76.1 | vD88 | |
| CH3 CH + H2 | 1.000 | 76.1 | vD88 | |
| CH4 CH3 + H | 0.703 | 182.8 | vD88 | |
| CH4 CH2 + H2 | 0.703 | 182.8 | vD88 | |
| CH4 CH + H2 + H | 0.703 | 182.8 | vD88 | |
| CH CH + H2 | 0.405 | 139.3 | vD88 | |
| CH CH + H | 0.405 | 139.3 | vD88 | |
| NH N + H | 0.794 | 219.2 | vD88 | |
| NH2 NH + H | 0.783 | 152.8 | vD88 | |
| NH3 NH + H2 | 0.780 | 159.2 | vD88 | |
| NH3 NH2 + H | 0.891 | 148.1 | vD88 | |
| N2 N + N | 0.000 | 184.3 | vD88, C72, see text | |
| O2 O + O | 0.890 | 361.3 | vD88 | |
| O O+ + O | 1.000 | 3.0 | vD88 | |
| OH O + H | 0.752 | 279.3 | vD88 | |
| OH+ O+ + H | 0.008 | 10.7 | vD88 | |
| H2O OH + H | 0.746 | 527.0 | vD88 | |
| HCO CO + H | 1.000 | 319.8 | vD88 | |
| HCO+ CO+ + H | 0.000 | 0.0 | vD88 | |
| H2CO CO + H + H | 0.844 | 132.1 | vD88 | |
| H2CO CO + H2 | 0.844 | 132.1 | vD88 | |
| H2CO HCO+ + H + e- | 0.844 | 132.1 | vD88 | |
| CO2 CO + O | 0.329 | 643.8 | vD88 | |
| CN N + C | 0.018 | 229.2 | vD88 | |
| HCN CN + H | 0.677 | 436.9 | vD88 | |
| HNC CN + H | 0.677 | 436.9 | vD88, see text | |
| NO O + N | 0.737 | 163.5 | vD88 | |
| HS S + H | 0.947 | 271.9 | vD88 | |
| HS+ S+ + H | 0.343 | 171.9 | vD88 | |
| H2S HS + H | 0.845 | 412.6 | vD88 | |
| H2S S + H2 | 0.845 | 412.6 | vD88 | |
| CS S + C | 0.973 | 1570.0 | vD88 |
It is usually assumed that the line and continuum contributions to the photorates are separable (van Dishoeck, 1988). Unshielded rate coefficients, , can be calculated using the following equations for line and continuum photoprocesses (e.g. van Dishoeck 1988):
| (2) |
| (3) |
where is the intensity of the radiation field, is the continuum cross section and the line transition is at a wavelength from a lower level to an upper level with oscillator strength , dissociation efficiency for the upper level and occupation fraction for the lower level. The lower limit of the integral (912 Å) is the Lyman cutoff wavelength for the unshielded interstellar radiation field. From these expressions we have (re-)calculated the unshielded interstellar photorates using cross section and oscillator strength data primarily from van Dishoeck (1988), referring to other sources (e.g. Rawlings et al. 1993) for species and reaction channels not covered in their database. Where we have one set of cross section data for a molecule but multiple dissociation channels are listed in the UMIST Database for Astrochemistry (UMIST06, Woodall et al. 2007), our calculated rate is divided between the channels in the same ratio as the original UMIST06 rates. We note that the high resolution N2 dissociation line data from Carter (1972) has been re–binned to a lower wavelength resolution in the database of van Dishoeck (1988). As the representative wavelengths, we therefore elected to use the mid-points of the dissociation wavelength intervals from Carter (1972). Since no cross section data is available for HNC we assign the same values as derived for HCN. For the radiation field we adopt the standard interstellar radiation field of Draine (1978), with the extension to Å given by van Dishoeck & Black (1982). These photorates are presented in Tables 1 and 2.
The newly calculated direct photorates are in agreement with the values in UMIST06 to within a factor of two for all but 10 of the 61 reactions for which we had data available. Four show rates differing by more than one order of magnitude; our calculations for the dissociation of H to either H + H or H2 + H+ are each larger by a factor of , while the ionization of OH is larger by a factor of and the dissociation of OH+ to O+ + H is larger by a factor of .
2.2 Shielding of N2 and CN by H2
The photodissociation of H2 is effected by the absorption of Lyman and Werner band photons followed by decay into the dissociation continuum (Stecher & Williams, 1967). To investigate the possible effects of mutual shielding by these lines we note that the range of wavelengths for H2 dissociation ( Å) fully overlaps that for the dissociation lines of N2 ( Å, van Dishoeck 1988, Carter 1972) and nearly the whole range for CN photodissociation ( Å, peaking at Å). We are investigating the photochemistry well within a PDR (A) and the H2 lines will be extremely optically thick, to the extent that (a) the overlap with individual N2 lines will be extensive and (b) there will be significant blanketing of the Lyman/Werner continuum. To include these effects we therefore make the extreme assumption that N2 and CN are both fully shielded and that the effective rates of photodissociation can be set to zero. These assumptions are clearly very simplistic and will need addressing using more sophisticated radiative transfer techniques in a future study.
2.3 Shielding by Ci
To account for shielding by the Ci ionization continuum we take a more detailed and accurate approach. First of all, considering the situation when the continuum is very optically thick, the photoreaction rates are re-calculated using equations 2 and 3, but using a lower limit of Å for the integral and excluding line contributions for Å. This implicitly assumes that the radiation field intensity is completely attenuated at these wavelengths shortwards of the Ci ionization potential; I( Å)=0. In Tables 1 and 2 we give the resulting shielding factors (), which represent the ratios of the photoreaction rates without and with the contributions from the Å wavelength range. Thus, in conditions where the carbon ionization continuum is very optically thick, the rate coefficient is just times the unshielded value. These ratios are calculated for all species/channels where cross section data is known.
We note that the photoionization cross section of atomic carbon is cm2 and is approximately independent of wavelength for Å (van Dishoeck, 1988). Ci column densities of up to the order of cm-2 (Tielens & Hollenbach, 1985) can be expected in PDRs, leading to a wide range of potential optical depths. Taking the first approximation that attenuation by dust and molecules are separable and the fact that the cross section is uniform with wavelength simplifies the radiative transfer to give shielding functions, , for each photoreaction (analogous to those used for CO):
| (4) |
where is the relevant shielding factor for the optically thick limit, given in Tables 1 and 2, and NC is the carbon (Ci) column density. Strictly speaking, the Av-dependence (due to continuum absorption by dust; in equation 1) will also depend on the Ci continuum opacity. However, this is a complicating second-order effect and we follow the practice of previous studies by decoupling the shielding by Ci from that by dust absorption, as in equation 1.
2.4 Cosmic Ray Induced Photoreactions
At extinctions greater than a few magnitudes, or if any of the various shielding effects described above become important, cosmic ray induced photodissociation and photoionization processes are significant and must be included in the models. The radiation field is generated by secondary electrons produced in the cosmic ray ionization of H2 (Prasad & Tarafdar, 1983). The calculation of these rates is as described in Sternberg et al. (1987) and Gredel et al. (1989):
On the assumption that the total absorption cross section is dominated by dust (rather than the molecular component, which in normal circumstances is true, except for H2 and CO) then the photorates are given by:
| (5) |
where is the cosmic ray ionization rate, n(i) is the abundance of species , and is the grain albedo. The cosmic ray induced photoreaction efficiency, , is given by:
| (6) |
where is the photoreaction cross section and is the grain extinction cross section per H–nucleon. The factor of 2 in the denominator takes into account the fact that the definition of is per H–nucleon, whereas is defined per H2 molecule (Woodall et al., 2007). We have re-calculated the values of using the same cross section data as in Section 2.1 and the (high resolution) cosmic ray induced H2 emission spectrum, (Gredel, personal communication, as depicted in Figure 1 of Gredel et al. 1989). This spectrum has been normalised to take account of the various transition probabilities and excitations per cosmic ray ionization. Thus it includes contributions from excitations to the , , , , , and Rydberg states and to the valence and states. Also included are excitations into the repulsive state and the vibrational levels of the ground state (), together with cascades to the state. The ratio of the H2 populations in J=0 to J=1 is taken to be . Results of these calculations are also given in Tables 1 and 2. Note that we have not re-calculated the cosmic ray induced rate for the photodissociation of CO, for which multiple line overlap occurs and the values given in the UMIST06 database are reasonably accurate.
For 24 of the 61 reaction channels, cosmic ray induced photoreaction efficiencies are not specified in the UMIST06 database. Of the remaining 36 (excluding CO), all but 15 agree to within a factor of 2. Relative to the UMIST06 database we found the rates for the ionization of NH, the dissociation of CN and the dissociation of H2CO to H2 + CO are all lower by factors of 12, 25 and 10 respectively.
3 The Chemical Model
| Model | Definition | n / cm-3 | |
|---|---|---|---|
| F1 | Standard | 10 | 103 |
| F2 | Bright | 105 | 103 |
| F3 | Dense | 10 | 105.5 |
| Temperature, T | K |
|---|---|
| CR Ionization Rate, | s-1 |
| Grain Albedo, | |
| X(He) | |
| X(C) | |
| X(O) | |
| X(N) | |
| X(Na) | |
| X(S) |
| Chemical Species |
|---|
| H, H+, H-, H, H |
| He, He+, Na, Na+, e- |
| C, C+, C-, CO, CO+, CH, CH+, CH2, CH |
| CH3, CH, CH4, CH, CH |
| N, N+, NH, NH+, NH2, NH, NH3, NH, NH, N2, N, N2H+ |
| O, O+, O2, O, OH, OH+, H2O, H2O+, H3O+ |
| HCO, HCO+, H2CO, H2CO+, CO2, CO, HCO |
| CN, CN+, HCN, HCN+, HNC |
| NO, NO+, HNO, HNO+, HCNH+, H2NC+, HNCO+, H2NO+ |
| S, S+, HS, HS+, H2S, H2S+, H3S+ |
| CS, CS+, C2S, C2S+, HC2S+, HCS, HCS+, H2CS+ |
To investigate the impact of the shielding mechanisms discussed above on chemical abundances, we implement them in a time– and depth–(Av) dependant chemical model. Since we are not attempting to replicate any specific astrophysical environment, we adopt physical and chemical parameters similar to the PDR code benchmarking effort of Röllig et al. (2007). These are summarised in Tables 3 and 4. In particular, we do not attempt to solve the equations of thermal balance and the temperature and density (T and n) are fixed. We also assume that the PDR is dynamically static so that the extinction, Av, is only a function of position. The incident radiation field used is the standard interstellar radiation field as described above, scaled by the factor .
Our chemistry consists of 7 elements in 81 gas phase species (Table 5) linked by 1129 reactions. For the sake of simplicity, we do not include any gas–grain chemical reactions. In any case, at the assumed temperature of 50K, gas–grain interactions will have negligible significance. The elemental helium, carbon and oxygen abundances are the same as in Röllig et al. (2007) while for nitrogen, sodium and sulphur, which were absent from their models, we take abundances from Savage et al. (1992) and Asplund et al. (2005). Reaction data and rate coefficients are taken from the UMIST06 database except where we calculated updated photorates as described in Section 2. We assume a fixed cosmic ray ionization rate of s-1 and a grain albedo of 0.5. The cosmic ray induced photodissociation rate for CO is modified by a temperature dependant factor of (T/300K)1.17 (Woodall et al., 2007) yielding a factor of eight reduction in the rate at 50K. For species with no cross section data available we use a default cosmic ray induced photoreaction efficiency of 200; broadly representative of the average value for other species.
The incorporation of the various shielding effects uses a number of simplifying approximations to allow for a focused study on the effects of H2 and Ci shielding. As in other studies we treat the attenuation by dust of the radiation field as separable from other processes and described by the usual exponential dependences on extinction of the photorates. Strictly speaking, these dependences should be modified to take account of the Ci absorption etc., but such variations are relatively minor as compared to the other effects reported in this paper.
For standard PDR models (e.g. model F1 of Röllig et al. 2007), the transition from atomic to molecular hydrogen occurs at A, the CiiCi transition is at A and carbon is mostly converted to CO for A. Deeper than this we can assume sufficient columns of H2 and CO have formed that they are completely self shielded and the effective photodissociation rates for these species are zero. For the same reason, when we investigate the effects of the inclusion of mutual shielding by molecular hydrogen lines, we take the extreme case scenario described in Section 2 and set the photodissociation rates of N2 and CN to zero. We therefore restrict our investigation to A where shielding by H2 and CO take this simple form and do not attempt to consider the details of the PDR itself, which we defer to a later study. Within our model we can therefore crudely switch the H2 line mutual shielding on or off and assign a fixed carbon column density across the whole extinction range so as to investigate the interplay between the two mechanisms and their effect on the chemistry.
4 Results
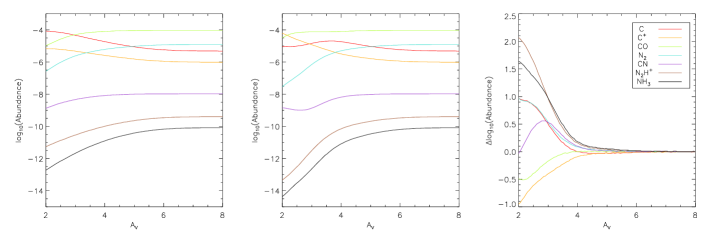
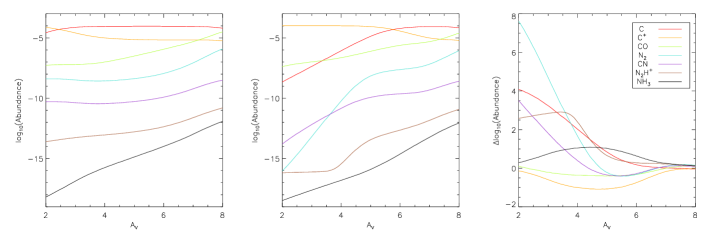
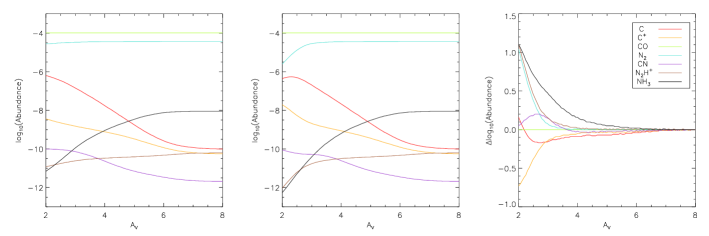
Examples of the key results obtained from the model are given in Figures 1 and 2. Our model was tested against the results for C+, C and CO abundances in model F1 of Röllig et al. (2007). We are able to reproduce abundances of C+, C and CO at positions well within the PDR, while observing typical sensitivities to the C/O ratio, the temperature dependence of the cosmic ray induced CO photodissociation rate and the chemical age. For a direct comparison we have evolved the chemistry to equilibrium. This typically takes years, although we integrate to 100 Myr so as to be consistent with their calculations.
The figures give a clear comparison of the chemical structure that is obtained with and without the implementation of H2 mutual shielding and carbon continuum shielding. We present abundances for observable molecules with significant abundances and showing abundance variations of factors greater than 10 as a result of these two mechanisms. The results are given in Figure 1 for the models F1, F2 and F3. We also show abundances for C+, C and CO (PDR carbon transition species) as well as N2 and CN (species shielded by H2) for reference. Probably the most important effect on the chemistry is the shielding of N2, for which the photodissociation is completely suppressed by both mechanisms. Thus, very significant enrichments are visible in all three environments and particularly in the range of extinctions A. This abundance excess obviously drives a more vigorous nitrogen chemistry so that the abundances of other nitrogen-bearing species, most notably N2H+, NH3 and CN, are significantly enhanced. The photoionization and photodissociation of NH3 are both partially shielded by the carbon continuum, while CN is fully shielded by molecular hydrogen. As is usually the case for molecular ions, photodissociation of N2H+ is not significant and had been excluded from our chemical network. The presence of significant column densities of nitrogen-bearing molecules at relatively low extinctions is an important result. However, it is also interesting to note that so few species are significantly enhanced by the shielding processes. For example, one might have expected to see large increases in HCN and HNC, but while their enrichments are tightly correlated they are still limited to factors of less than 10. Similarly, despite the strong enrichments in NH3, the simpler hydrides NH and NH2 show correlated enrichments but of less than an order of magnitude.
One issue with these particular models is the assumption that the Ci continuum is very optically thick; with at A. Using a typical relation for (Röllig et al., 2007) depending on the total hydrogen column density allows us to approximate the atomic carbon column density. For model F1, a column of roughly 1016 cm-2 is obtained at A, rising to cm-2 at A, implying a Ci optical depth of order unity, but somewhat less than . The other models yield lower values, with the bright model not achieving a column of 1017 cm-2 until A and the dense model only achieving a maximum column of roughly cm-2. However, the Av–N relationship depends on the gas to dust ratio, a quantity which is not only poorly constrained but can also vary by orders of magnitude for different astrophysical environments. So whilst the results of Figure 1 may only be valid beyond a certain extinction for our given Av–N relation, the results become valid at lower Av as the dust to gas ratio falls (since the Ci column density would increase for a given Av). We also note that for model F2 the CCO transition is pushed much deeper to A by the more intense radiation field. This probably invalidates our assumption of CO being optically thick and perfectly self–shielded by A. However, one effect of this would be to increase the abundance of atomic carbon at intermediate depths and hence the optical depth of the Ci continuum shielding CO.
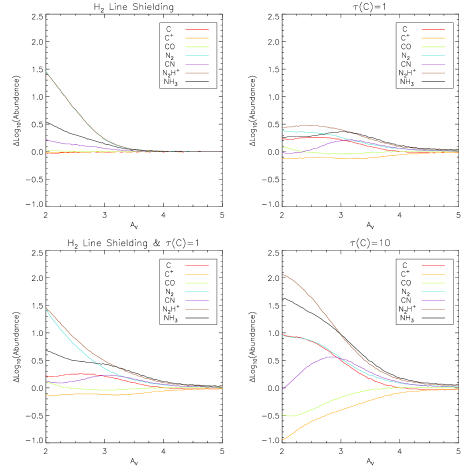
Figure 2 shows the range of enrichments achieved when using different levels of shielding in model F1. The final panel shows that as carbon becomes optically thick, the resulting enrichments are very similar with or without H2 line shielding, even though CN is not fully shielded by the carbon ionization continuum. More importantly, the first panel shows that in environments where carbon column densities are low and only H2 line shielding occurs, significant enrichments in N2, N2H+ and NH3 are still possible. Qualitatively similar behaviour is also seen for models F2 and F3. The exception is CN, which in model F1 is seen to be coupled to the enrichment in atomic carbon through the formation channel:
Since the H2 photodissociation lines become optically thick at low extinctions (A), the effects of H2 mutual shielding will always be significant for A. We therefore expect the true chemical enrichment for A to be some intermediate between these two plots; that is to say, the effects of mutual shielding by the H2 photodissociation lines will always be present even if the carbon ionization continuum is optically thin.
5 Conclusions and Discussion
We have re-calculated the interstellar photodissociation and photoionization rates of a range of interstellar molecules, both for direct interstellar and for cosmic ray induced radiation fields. We have also calculated direct photorates which include the effect of partial blocking of the incident radiation field by the carbon ionization continuum.
The specific quantitative results that can be drawn from our model are clearly limited by its simplicity. However, using approximations for shielding of the incident radiation field deep in PDRs by molecular hydrogen and atomic carbon, we present the result of significant (more than an order of magnitude) enrichments in the nitrogen-bearing species N2, N2H+, NH3 and CN. These results are seen for a range of physical parameters, including density, radiation field intensity and carbon column density, but should be most prominent in dust poor environments. These species are all important observationally in inferring various characteristics of the PDRs in which they are detected. For example, Bayet et al. (2009) have used PDR models to show that CN traces the density and relative nitrogen abundance of PDR dominated galaxies. First results from the Herschel Space Observatory towards W31C have shown nitrogen hydride (NH3, NH2 and NH) abundances that cannot be explained using simple gas–grain or PDR chemical modelling (Persson et al., 2010). Other nitrogen-bearing species such as HCN and HNC, also believed to trace dense molecular gas, show smaller ( magnitudes), correlated enrichments. They are often used in both galactic (e.g. Roberts et al. 2011) and extragalactic (e.g. Kamenetzky et al. 2011) environments to classify the gas chemistry as photon dominated or not. It is clear from our work that the shielding by H2 and C have a large impact on the abundances of such nitrogen-bearing species and both mechanisms need to be included in future PDR models.
Current ongoing studies suggest these mechanisms have only a limited effect on column densities in high extinction clouds and cannot explain, for example, the high column densities of nitrogen hydrides seen in the interstellar medium towards W31C (Persson et al., 2010). In future work we will apply the shielding factors to more rigorous PDR models with self consistently calculated column densities to investigate the effects on the chemistry in regions of lower visual extinction (A). This is particularly important given that our observed enrichments appear more pronounced at lower extinctions where molecular shielding by H2 becomes more significant relative to dust extinction. It would also be useful to do a thorough re-analysis of the cosmic ray induced photodissociation rate of CO, which is the dominant source of atomic carbon in regions of high extinction (A).
Acknowledgements
We thank the anonymous referee for their commentary on the paper that led to significant improvements in its clarity. RR acknowledges the financial support of the Science and Technology Facilities Council via a postgraduate studentship.
References
- Asplund et al. (2005) Asplund M., Grevesse N., Sauval A. J., 2005, Astronomical Society of the Pacific Conference Series, 336, 25
- Barsuhn (1977) Barsuhn J., 1977, A&AS, 28, 453
- Bayet et al. (2009) Bayet E., Vitti S., Williams D. A., Rawlings J. M. C., Bell T., 2009, ApJ, 696, 1466
- Black & Dalgarno (1977) Black J. H., Dalgarno A., 1977, ApJS, 34, 405
- Branscomb (1962) Branscomb L. M., 1962, in Atomic and Molecular Processes, ed. D. R. Bates, Academic Press Inc, New York, p.100
- Carter (1972) Carter V. L., 1972, J. Chem. Phys., 56, 4195
- Draine (1978) Draine B. T., 1978, ApJS, 36, 595
- Gredel et al. (1989) Gredel R., Lepp S., Dalgarno A., Herbst E., 1989, ApJ, 347, 289
- Hollenbach & Tielens (1999) Hollenbach D. J., Tielens A. G. G. M., 1999, Reviews of Modern Physics, 71, 173
- Kamenetzky et al. (2011) Kamenetzky J. et al., 2011, ApJ, 731, 83
- Kulander & Bottcher (1978) Kulander K. C., Bottcher C., 1978, J. Chem. Phys., 29, 141
- Persson et al. (2010) Persson C. M. et al., 2010, A&A, 521, L45
- Prasad & Tarafdar (1983) Prasad S. S., Tarafdar S. P., 1983, ApJ, 267, 603
- Rawlings (1988) Rawlings J. M. C., 1988, MNRAS, 232, 507
- Rawlings et al. (1993) Rawlings J. M. C., Drew J. E., Barlow M. J., 1993, MNRAS, 265, 968
- Roberts et al. (2011) Roberts H., van der Tak F. F. S., Fuller G. A., Plume R., Bayet E., 2011, A&A, 525, 107
- Röllig et al. (2007) Röllig M. et al., 2007, A&A, 476, 187
- Savage et al. (1992) Savage B. D., Cardelli J. A., Sofia U. J., 1992, ApJ, 401, 706
- Stecher & Williams (1967) Stecher T. P., Williams D. A., 1967, ApJ, 149, L29
- Sternberg (2004) Sternberg A., 2004, in The Dense Interstellar Medium in Galaxies, eds. S. Pfalzner et al. (Berlin: Springer), p.423
- Sternberg et al. (1987) Sternberg A., Dalgarno A., Lepp S., 1987, ApJ, 320, 676
- Tielens & Hollenbach (1985) Tielens A. G. G. M., Hollenbach D., 1985, ApJ, 291, 722
- van Dishoeck (1988) van Dishoeck E. F., 1988, in Rate Coefficients in Astrochemistry, eds. T. J. Millar and D. A. Williams (Dordrecht: Kluwer), p.49
- van Dishoeck & Black (1982) van Dishoeck E. F., Black J. H., 1982, ApJ, 258, 533
- van Dishoeck & Black (1988) van Dishoeck E. F., Black J. H., 1988, ApJ, 334, 771
- Visser et al. (2009) Visser R., van Dishoeck E. F., Black J. H., 2009, A&A, 503, 323
- Woodall et al. (2007) Woodall J., Agúndez M., Markwick-Kemper A. J., Millar T. J., 2007, A&A, 466, 1197