NOVEL PHOTOLUMINESCENCE-ENHANCING SUBSTRATES FOR IMAGE FORMATION
OF
BIOLOGICAL OBJECTS
Abstract
The use of photonic crystals, which were fabricated on the basis of synthetic opals, as substrates for the luminescence microscopy of biological objects has been shown. The spatial distributions of the photoluminescence by DNA clusters excited by 365-nm ultra-violet irradiation on opal surfaces and rough gold substrates have been studied. With the use of blood cells as an example, a possibility for the visualization of biological objects in the case where the nanostructure elements of synthetic opals are applied as labels and image amplifiers has been demonstrated.
1 Introduction
It is known that, in order that some biological problems be solved, the contrast images of cells and their components have to be obtained. The difficulty consists in that the cells, which are transparent objects, are badly visible with an optical microscope. Various approaches are used to tackle this problem, and the usage of various dyes, quantum dots, and metallic nanoparticles as luminescent labels [1] can be classed as such. Being bound to various molecular structures, those labels luminesce under the action of laser radiation and visualize the site, where the cell is connected with the label. In particular, 4′,6-diamidino-2-phenylindole (DAPI) either “dyes” cell nuclei or stimulates complexes with DNA to luminesce in the blue spectral range; the green fluorescent protein (GFP) is used as a protein label, including the cytoskeleton; and so on [2]. Autoluminescence of cell components is very weak and practically is not observable even if a confocal microscope is applied.
An alternative approach includes the creation of special optical setups for visualizing the transparent objects, with the confocal and phase-contrast microscopies being an example [3]. The combination of those two approaches allows good results to be obtained as well.
To visualize cells and their components, we proposed to use special substrates, which play the role of optical elements and, simultaneously, luminescent labels. Confocal microscopy is known to enable the detection of luminescent microobjects with the help of an optical microscope, the aperture of which is located before a detector and ensures the registration of photoluminescence (PL) only from the objects located immediately in the focal plane. In such a manner, the three-dimensional images of analyzed objects can be created. The method of confocal microscopy provides a high contrast, a large depth of field, and a capability to scan specimens layer-by-layer. This circumstance allows three-dimensional images of individual cells, tissue sections, and small organisms to be created, which has predetermined a wide dissemination of the method in medical and biologic applications.
Earlier [4], synthetic opals were suggested to be used as matrices filled with the analyzed substance to enhance the PL intensity of DNA. To excite PL in DNA (its quantum yield at room temperature is less than ), various dyes are used, such as ethidium bromide, acridine orange, and others [5, 6], whereas the application of styryl-cyanine dyes to the DNA allows one to obtain the two-photon luminescence in the visible spectral range [7]. Earlier [4], we suggested synthetic opal to be used to enhance the luminescence of DNA near 350 nm. We also demonstrated there a possibility to obtain the luminescence from DNA molecules located on the surface of synthetic opal (without a temperature decrease and a dye application) and to visualize DNA clusters by exciting them at a wavelength of 365 nm. In this work, we reported our experimental data concerning the usage of photonic crystals (PCs) created on the basis of synthetic opals and rough gold substrates for the imaging of biological objects such as DNA clusters and blood cells.
2 Materials and Methods
The application of a confocal setup gives rise to the image contrast enhancement, because a small-size apperture is applied so that the “extraneous” light emitted by the neighbor points of the analyzed object does not arrive at a detector. The “cost” of a contrast enhancement is the necessity to use rather complicated schemes for the scanning of a specimen or light beam, which increases the time required to obtain complete information about the examined object.
According to the Rayleigh criterion for the resolution limit (an intensity reduction by 26% from its maximum value) in the case of a confocal microscope, , where . At the same time, for a conventional optical microscope, . Hence, the resolution of a confocal microscope is only 1.4 times better than that of an optical one [8]. Therefore, the main advantage of a confocal microscope is not an increase of the resolution, but a substantial increase of the contrast when the image is formed.
Our experiments were carried out on a confocal laser scanning microscope Carl Zeiss LSM-510 META equipped with an objective Plan-Neofluar 40x/0.6 Korr. To obtain object images with this microscope, we used lasers with wavelengths of 405, 458, 488, and 633 nm. Object images were registered with the help of a digital camera AxioCam. PL excitation was carried out with the use of an ultra-violet lamp HBO 100 and applying blue (FSet01 wf), green (Fset10 wf), and red (Fset20 wf) filters. Images in the visible range and in the “transmission” geometry were obtained using a halogen lamp. The scanning rate depends on the resolution, so it was equal to 1/5 sec per layer for a microscope LCM-510 at a resolution of . The maximum resolution was [9].
To estimate the PL spectral density, we scanned a specimen over its surface in the “Lambda scan” mode, which allowed the PL spectrum to be registered with the use of a line of tiny photodetectors with a spectral resolution of 10.7 nm. For the quantitative analysis, we used the ROI (Region of Interest) feature, which enabled us to obtain the plot of the PL intensity vs the wavelength, with the dependence being averaged over the selected region.
3 Fabrication of Specimens
Specimens of synthetic opal were fabricated within the method of natural globule sedimentation, by evaporating the reaction mixture at a given rate. For the synthesis of silicon dioxide globules, the modified Stober method [10] was applied. The molar ratio between the components in the reaction mixture was ::::::. After the sedimentation, the obtained crystals were annealed at a temperature of 800 to remove chemically bound water and the remnants of organic compounds.
In our researches, we also used rough gold substrates. A thin film of gold was obtained by the thermal deposition of gold (99.999%) in vacuum onto a glass substrate (TF-1, mm) covered with a Cr layer. Provided that the Cr layer was 10–20 in thickness, the thickness of gold film was 300–350 Å and its roughness was about 50 Å [11].
A suspension of blood cells in a 0.9%-solution of sodium chloride was prepared. Venous blood was taken from an elbow vein, and heparin was added (0.1 ml per 10 ml of blood). Blood cells were centrifuged at a rate of 1500 rpm for 10 min. Then blood plasma was removed, and the cell precipitate was diluted with the equal volume of an isotonic sodium chloride solution. The test tube with a specimen was stirred up and centrifuged once more. Then, the precipitate was removed from the test tube, by preserving 0.5 ml over the volume occupied by the cells. At last, the cells were deposited onto a glass substrate or the surface of synthetic opals for their study with the confocal microscope.
4 Results and Their Discussion
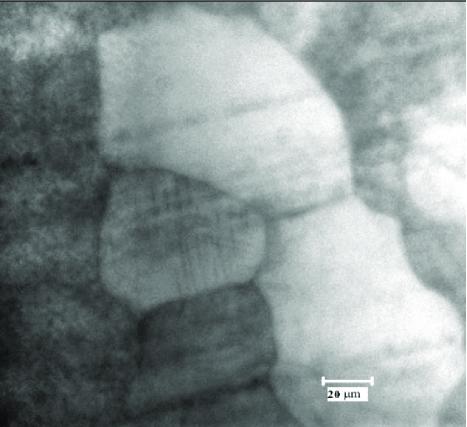
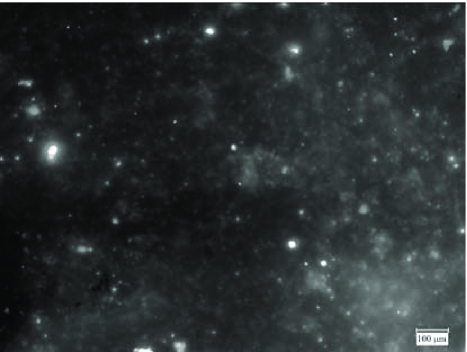
Since the surface of a PC created on the opal basis has a domain structure and is iridescent, the first stage of our research consisted in optical studies of the initial opal surface by using the confocal microscopy. In Fig. 1, the regions with ordered structure (domains) from 40 to 250 in size observed on the opal surface are exhibited. The luminescence of the PC surface was detected, when it was excited by UV light with a wavelength of 365 nm from a mercury lamp. The registered glow produced by inhomogeneities on the opal surface allowed us to distinguish separate domains well.
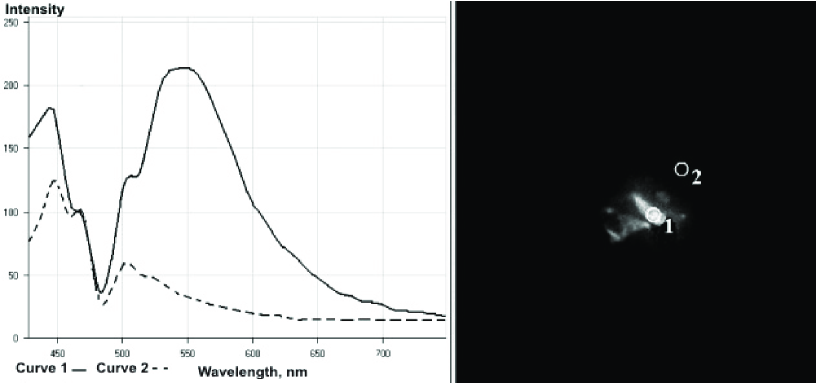
The researches showed [4, 12, 13] that the initial PC demonstrates PL with two intensive maxima at about 400 and 500 nm, and several weak bands in the interval of 600–800 nm. In work [14], PL produced by a synthetic opal was associated with the presence of defects and impurities. The band with a maximum at a wavelength of 523 nm is related to the surface states of Si–H (a transition energy of 2.37 eV), whereas the band with maxima at 652 and 692 nm to the bulk and surface states of Si–O (transition energies of 1.9 and 1.79 eV, respectively). The nature of the band at about 400 nm was discussed in [12]. This band is associated with the presence of various impurities such as zinc, calcium, sodium, iron, and zirconium oxides, which get into specimens in the course of crystal fabrication. The fraction of these impurities is less than The PL intensity for the initial synthetic opal changed from point to point under the scanning over its surface (see Fig. 2). For the specimens with a well-ordered structure, the variation of PL intensity over the surface was observed with an identical coefficient for various frequencies. For the specimens with a less ordered structure, the luminescence intensity changed differently at different frequencies. Such a dependence of the synthetic opal luminescence intensity on the surface site can be connected with the inhomogeneity of a specimen, the presence of a domain structure, the variation in the spectral position of the energy gap, and the non-uniform distribution of impurities. Since the size of domains in PCs is comparable with the wavelength of light in the visible range, one may expect a local increase of the electromagnetic field for the impurity-induced PL, so that a signal even from a very small number of impurities could be registered [15, 16]. The energy gap of PC reveals itself in a luminescence band; namely, a dip has to be observed in the luminescence contour in the spectral region, where the PC energy gap is located [12]. For the studied crystals with a globule size of 240 nm, the Bragg reflection should take place at about 530 nm. In accordance with that, a “dip” was registered in the corresponding region of the opal PL spectra (see Fig. 2).
The main electron transition – in a DNA molecule corresponds to the electromagnetic radiation wavelength close to 260 nm. Having absorbed an ultra-violet quantum, the DNA molecule transits from the ground state in that corresponding to the first (resonance) singlet electronic term. This transition is allowed by the selection rules for single-photon processes. Slightly lower on the energy scale, there is located a triplet term, for which the single-photon processes into the ground state are spin-forbidden. Accordingly, a condition for the PL spectra in DNA to be excited is an excess of the energy of an exciting radiation quantum over the resonance electron transition energy; i.e. the exciting radiation wavelength has to be shorter than or at least comparable with 260 nm. After the excitation (owing to the single-photon absorption) of a DNA molecule and its transition onto a singlet term, conversion processes become possible, when the molecule transits onto a triplet term characterized by a very small oscillator strength [17]. In addition, the conversion can take place from term into a number of other terms with small oscillator strengths connected with the electronic structure of nucleic bases composing DNA. As a result, the main fraction of the electromagnetic energy absorbed by a DNA molecule transforms into the energy of thermal motion. In this connection, the quantum yield of PL for DNA molecules is extremely low (less than ), which makes the observation of PL by a native DNA extremely difficult even if the sources of exciting photons of short-wave electromagnetic radiation with a wavelength shorter than 260 nm are used. In this connection, the known results concerning the registration of PL spectra for the native (label-free) DNA excited with short-wave radiation [5, 6] were obtained only at low temperatures.
In order to enhance the intensity of PL by DNA molecules located on the surface of a condensed medium, we proposed to use two new types of substrates: a rough film of gold and a micro-structured surface of synthetic opal.
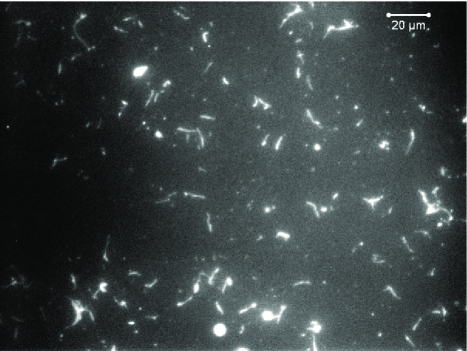
In Fig. 3, the image of DNA strands located on a rough gold surface is depicted. The image was obtained by registering PL excited by ultra-violet radiation (365 nm). The figure demonstrates that the objects are observed in the form of strands 5–7 in length and about 1 in thickness. A real thickness of DNA strands is known to equal tens of nanometers. This conclusion was confirmed earlier by the results of researches of the DNA microstructure with the use of atomic-force [18] and electron microscopies. An increase of the transverse dimensions of the discussed object (to 1 ) at its observation by the PL method with the help of a confocal microscope can be explained by a probable condensation of DNA molecules with the assembling of microclusters on the gold surface. As Fig. 3 demonstrates, the images of DNA strands are bright and clear enough. The higher intensity of a PL signal from DNA molecules on the gold surface can be associated with a manifestation of the known effect consisting in a huge (by several orders of magnitude) amplification of the effective electromagnetic PL field near gold nanoparticles. This effect is explained by the influence of localized surface plasmons. On the other hand, the chemical processes of electron transport from the metal to DNA molecules, which can give rise to the formation of new electron states in the visible spectral range, are not excluded as an alternative mechanism of PL intensity enhancement. In effect, the latter mechanism corresponds to the formation of new fluorescent labels in a vicinity of gold nanoparticles. As a result of the spontaneous label formation in the “gold–DNA” complex, PL in DNA can be excited by radiation in the middle ultra-violet range (365 nm).
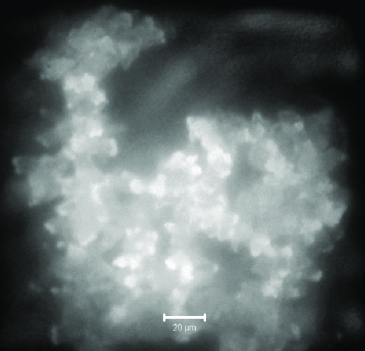
In Fig. 4, the image of DNA microclusters deposited onto the PC surface is shown. The image was obtained in the PL light generated at the excitation at a wavelength of 365 nm. The figure demonstrates that the images of DNA molecules are more smeared than those in the case where the rough gold substrate was used. Nevertheless, a rather intensive PL signal is also observed in this case, which allows us to obtain information on the spatial distribution of DNA over the substrate surface. It is known that, if the size of silica globules in a PC is 250 nm, the size of interglobular pores is about 50 nm, and the diameter of channels that reach the PC surface is close to 10 nm. Therefore, the smear of the images of DNA strands on the PC surface can be explained by a “sinking” of DNA molecules into the PC bulk through the interglobular channels.
The observed effect that the image intensity (in the PL light) of DNA clusters located on the PC surface grows can be explained, similarly to the case with rough gold substrates, by a local increase of the effective field [19]. However, now the effect takes place not as a result of the plasmon effect but owing to the interference-induced amplification of the effective field in the PC due to a growth of the density of photon states in a vicinity of defects and the edges of the forbidden photon band [15]. The interference character of the field amplification can serve as an additional reason for the smearing of the images of biological objects on the PC surface.
It should also be noted that nanostructured gold, as well as nanostructured PCs, has a variety of electron transitions in the visible and near ultra-violet ranges of the spectrum [20, 21]. They correspond to energies of 2.4 eV (0.52 ), 2.5 eV (0.5 ), 1.9 eV (0.65 ), 2.2 eV (0.56 ), 3.2 eV (0.3 ), 2.55 eV (0.49 ), and 3.0 eV (0.41 ). The presence of these levels creates conditions for the formation of corresponding labels in the complexes “DNA–substrate defect” and for the emergence of a PL signal when the latter are excited by radiation with a wavelength of 365 nm.
In addition, if the PC substrate is microstructured, the emergence of new chemical bonds between DNA molecules and defects on the PC surface is possible analogously to the case of inhomogeneities on the gold substrate. New chemical bonds “PC–DNA” play a role of formed labels, which give rise to PL when being excited by radiation in the middle UV-range (365 nm).
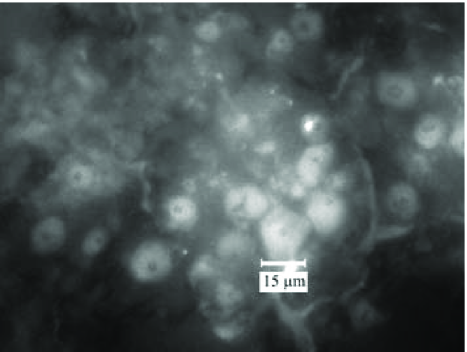
Figure 5 exhibits the images of blood plasma cells, and Fig. 6 presents the corresponding PL images of erythrocytes deposited onto the surface of synthetic opal. As is seen from those figures, when the microscope is adjusted to watch the surface layer of cells, the glow is observed to be emitted directly from the cells rather than the substrate surface. The images of biological objects presented in Figs. 5 and 6 enable the dimensions of cells and their shapes to be estimated. While analyzing the PL spectra from definite object regions, it is possible to obtain quantitative information concerning the parameters of secondary radiation from cell components. One can distinctly observe a concave at the center of an erythrocyte cell. It should be noted that, when depositing blood cells onto the cover glass, none of their PL images were obtained. At the same time, when a PC was used as a substrate, the observable (in the PL light) images differ from one another not only by their shapes, but also by their spectra.
5 Conclusions
Hence, the following results were obtained in this work.
1. When DNA molecules are deposited onto a rough gold substrate and the exciting ultraviolet radiation with a wavelength of 365 nm is used, it is possible to form a distinct image of photoluminescent DNA clusters observed with a confocal microscope as strands several micrometers in length. The observed width of strands substantially exceeds the real transverse size of DNA molecules. This result is explained by the resolution limit of a confocal microscope (the luminescence mode).
2. When DNA molecules are deposited onto a nanostructured surface of a photonic crystal, the PL image of DNA clusters can also be formed with the help of a confocal microscope, by applying exciting ultraviolet radiation with a wavelength of 365 nm. However, the images of DNA molecules are smeared and less intense in this case. The smearing of the photoluminescence image of DNA can be explained by the “sinking” of DNA molecules into the PC bulk through the channels, whose diameter is close to 10 nm.
3. The specific feature of the method proposed is the fact that the application of a photonic crystal makes it possible to register the photoluminescence images of biological objects with large dimensions (more than 1 ), which do not “sink” through the PC pores. It is also true for clusters composed of a large number of molecules to be studied, which fill the whole PC volume [4]. Therefore, we can conclude that the application of PCs as substrates is expedient for the formation of the photoluminescence images of biological objects characterized by a rather big size (cells, viruses, etc.). In this case, the usage of substrates made of PC turns out considerably more efficient than the usage of a cover glass.
For the further usage of the method, in which PCs created on the basis of synthetic opals are applied as substrates, it seems expedient to fabricate opals with smaller dimensions of globules, which would provide the corresponding reduction of channel dimensions to about 1 nm. Moreover, it is reasonable to excite PL in native DNAs with the help of short-wave radiation. In particular, semiconductor light-emitting diodes with a wavelength of 280 nm or the fourth harmonic of a YAG:Nd3+ laser with a generation wavelength of 266 nm can be used for this purpose.
The work was sponsored by the Ukrainian-Russian project (2012–2013), the project of the Science and Technology Center in Ukraine N 5525 (2012–2013), and the Ukrainian-German project N M366 (2011–2012). The authors are also grateful to the Ministry of Education and Science of the Russian Federation (state contract N 16.513.11.3116) and the Russian Foundation for Basic Research (projects N 10-02-00293, 11-02-00164, and 11-02-12092).
References
- [1] Handbook of Biological Confocal Microscopy, edited by J.B. Pawley (Springer, Berlin, 2006).
- [2] E.V. Selivanov, Dyes in Biology and Medicine: Handbook (Azbuka, Barnaul, 2003) (in Russian).
- [3] C. Cremer and T. Cremer, Microsc. Acta 81, 31 (1978).
- [4] V. Boyko, G. Dovbeshko, O. Fesenko V. Gorelik, V. Moiseenko, V. Romanyuk, T. Shvets, and P. Vodolazkyy, Mol. Cryst. Liq. Cryst. 535, 30 (2011).
- [5] P. Vigny and A. Favre, Photochem. Photobiol. 20, 345 (1974).
- [6] J.P. Morgan and M. Daniels, Photochem. Photobiol. 31, 101 (1980).
- [7] V.M. Yashchuk, S.M. Yarmoluk, V.Yu. Kudrya, M.Yu. Losytskyy, V.P. Tokar, V.M. Kravchenko, V.B. Kovalska, A.O. Balanda, and D.V. Kryvotenko, Adv. Opt. Technol. 2008, 908246 (2008).
- [8] R.H. Webb, Rep. Prog. Phys. 59, 427 (1996).
- [9] Confocal Microscopy Methods and Protocols, edited by S. Paddock (Humana Press, Newcastle, 1998).
- [10] W. Stober, A. Fink, and E. Bohn, J. Coll. Interface Sci. 26, 62 (1968).
- [11] G.I. Dovbeshko, V.I. Chegel, N.Ya. Gridina, O.P. Repnytska, Y.M. Shirshov, V.P. Tryndiak, I.M. Todor, and G.I. Solyanik, Biospectr. 67, 470 (2002).
- [12] A.N. Gruzintsev, G.A. Emelchenko, V.M. Masalov, M. Romanelli, K. Barthou, P. Benalul, and A. Metr, Inorg. Mater. 44, 203 (2008).
- [13] A.N. Gruzintsev, G.A. Emelchenko, V.M. Masalov, and E.E. Yakimov, Inorg. Mater. 45, 302 (2009).
- [14] Y.D. Glinka, S.-H. Lin, and Y.-T. Chen, Phys. Rev. B 62, 4733 (2000).
- [15] V.S. Gorelik, Quant. Electr. 37, 409 (2007).
- [16] V.A. Kosobukin, Okno Mikromir 4, 4 (2002).
- [17] V. Yashchuk V. Kudrya, M. Losytskyy, H. Suga, and T. Ohul’chanskyy, J. Mol. Liq. 127, 79 (2006).
- [18] X. Li, Y. Peng, and X. Qu, Nucleic Acids Res. 34, 3670 (2006).
- [19] Ch. Luo, S.G. Johnson, J.D. Joannopoulos, and J.B. Pendry, Phys. Rev. B 68, 045115 (2003).
- [20] L. Skuja. J. Non-Cryst. Solids 239, 16 (1998).
-
[21]
G.T. Boyd, Z.H. Yu, and Y.R. Shen, Phys. Rev. B 33,
7923 (1986).
Received 06.10.11
Translated from Russian by O.I. Voitenko
НОВI ПIДКЛАДКИ, ЩО ПОСИЛЮЮТЬ СИГНАЛИ
ФОТОЛЮМIНЕСЦЕНЦIЇ, ДЛЯ
ФОРМУВАННЯ
ЗОБРАЖЕНЬ БIОЛОГIЧНИХ ОБ’ЄКТIВ
Г.I. Довбешко, Є.М.
Фесенко 1, В.В. Бойко, В.Ф. Горчев,
С.О. Карахiн, Н.Я. Гридiна,
В.С. Горелик, В.Н. Моiсеєнко
Р е з ю м е
В роботi показано можливiсть
використання фотонних кристалiв, створених на основi штучних
опалiв, як пiдкладок для люмiнесцентної мiкроскопiї
бiологiчних об’єктiв. Вивчено просторовий розподiл
фотолюмiнесценцiї кластерiв ДНК на поверхнi опалiв i на
шорсткуватих золотих пiдкладках при дiї ультрафiолетового
випромiнювання з довжиною хвилi 365 нм. На прикладi зразкiв клiтин кровi
продемонстровано можливiсть вiзуалiзацiї бiологiчних об’єктiв
при використаннi елементiв наноструктури штучних опалiв у
ролi мiток i пiдсилювачiв зображення.