XMM-Newton discovery of transient 285.4 s X-ray pulsar XMMU J013359.5+303634 in M33
Abstract
I report on the discovery and analysis of the first transient X-ray pulsar detected in the Local Group galaxy M33. The 2010 July-August deep XMM-Newton observations of M33 fields revealed a new bright X-ray source XMMU J013359.5+303634 exhibiting pulsations with a period s and pulsed fraction 47 per cent in the 0.3-10 keV energy range. The pulse phase averaged spectrum of XMMU J013359.5+303634 is typical of X-ray pulsars and can be fit with an absorbed simple power law model of photon index in the 0.3-10 keV energy band. The search for an optical counterpart did not yield any stellar object brighter than 20 mag, suggesting that XMMU J013359.5+303634 is not a Galactic foreground object and almost certainly belongs to M33. Assuming the distance of 817 kpc, the maximum observed luminosity of the source in the 0.3-10 keV energy range is ergs s-1, at least 20 times higher than quiescent luminosity. The brightest optical object inside the error circle of XMMU J013359.5+303634 has a visual magnitude of 20.9 and properties consistent with being an early B V star when placed at a distance of M33. Based on the X-ray pulsations and spectrum, transient behavior and possible early B class optical counterpart, XMMU J013359.5+303634 can be classified as another extragalactic Be/X-ray binary candidate.
keywords:
X-rays: binaries – (galaxies:) M331 Introduction
Since their discovery (Giacconi et al., 1971), accreting X-ray pulsars have been prime targets for both observational and theoretical study (White, Swank & Holt, 1983; Nagase, 1989; Bildsten et al., 1997). X-ray pulsars proved to be unique laboratories that allow to test a wide variety of physical processes in the presence of magnetic fields and strong gravity, and study stellar evolution in binary systems.
Until recently, the study of pulsating X-ray sources was limited to our Galaxy and the nearby Magellanic Clouds. The advanced capabilities of Chandra and XMM-Newton observatories opened the possibility to study spectral and timing properties of individual bright X-ray sources associated with more distant galaxies (Fabbiano, 2006; Fabbiano & White, 2006), allowing to extend searches for pulsating X-ray binaries beyond the Milky Way and its immediate neighbors. Recent analysis of the monitoring observations with XMM-Newton and Chandra has already led to the discovery of coherent pulsations in three X-ray sources located in the Local Group galaxy M31 (Osborne et al., 2001; Trudolyubov et al., 2005; Trudolyubov & Priedhorsky, 2008) and two X-ray pulsars in the nearby spiral galaxies NGC 2403 and NGC 1313 (Trudolyubov, Priedhorsky & Córdova, 2007; Trudolyubov, 2008). Two of the pulsating sources detected in M31 have supersoft spectra that can be fit with blackbody models with characteristic temperatures of several tens of eV, and probably belong to an accreting white dwarf systems. The remaining three objects have hard spectra with photon index , typical of systems containing accreting highly-magnetized neutron star. These results clearly demonstrate that bright ( ergs s-1) pulsating X-ray source with both supersoft and hard spectra can be detected in the galaxies inside and beyond the Local Group up to the distances of a few Mpc.
At the distance of 817 kpc (Freedman et al., 2001), the nearest late-type face-on spiral galaxy M33 provides a good opportunity to study X-ray sources associated with a young stellar population. M33 was the target of multiple X-ray observations with the Einstein (Trinchieri et al., 1988), ROSAT (Haberl & Pietsch, 2001), Chandra (Plucinsky et al., 2008; Tüllmann et al., 2011), and XMM-Newton observatories (Pietsch et al., 2004; Misanovic et al., 2006). These observations uncovered a population of hundreds of X-ray sources with many of them identified as X-ray binary and supernova remnant candidates associated with regions of recent star formation.
In this paper, I report on the discovery of the coherent 285.4 s pulsations in the flux of transient X-ray source XMMU J013359.5+303634 in M33, using archival data of XMM-Newton observations. We study X-ray properties of the source, search for the optical counterpart and discuss its nature.
| Date | Obs. ID | Instrument | Mode/ | RA (J2000)a | Dec (J2000)a | Exp.b |
|---|---|---|---|---|---|---|
| Filter | (h:m:s) | (d:m:s) | (ks) | |||
| 2010 Jul. 9-10 | 0650510101 | EPIC | Full/Medium | 01:34:13.40 | +30:47:48.8 | 99.7 |
| 2010 Jul. 11-12 | 0650510201 | EPIC | Full/Medium | 01:33:45.22 | +30:35:44.4 | 99.6 |
| 2010 Aug. 12-13 | 0650510601 | EPIC | Full/Medium | 01:34:21.29 | +30:27:07.3 | 100.0 |
a – pointing coordinates
b – instrument exposure used in the analysis
2 Observations and data reduction
In the following analysis I used the data of the 2010 July 9-10, July 11-12 and August 12-13 XMM-Newton observations of M33 fields obtained by the three European Photon Imaging Camera (EPIC) instruments (MOS1, MOS2 and pn) (Turner et al., 2001; Strueder et al., 2001) (Table 1). Several Chandra (Obs. IDs: 786, 1730, 6376, 6377, 6385, 6387, 6388, 6389, 7170, 7171, 7196) (Plucinsky et al., 2008; Tüllmann et al., 2011) observations with the field of view covering the position of XMMU J013359.5+303634 were also used to obtain upper limits on the source quiescent flux.
The XMM-Newton/EPIC data files were processed using the XMM-Newton Science Analysis System (SAS v 11.0.0)111See http://xmm.esa.int/sas. The original event files were screened to exclude time intervals with high background levels. For timing analysis, the EPIC event arrival times were corrected to the solar system barycenter using the SAS task barycen.
Point sources in the EPIC-pn and MOS images of the M33 fields were detected and localized using the SAS maximum likelihood source detection script edetect_chain. Bright X-ray sources with known counterparts from USNO-B and LGGS catalogs (Monet et al., 2003; Massey et al., 2006) were used to correct the EPIC image astrometry. The XMM-Newton source positions were also cross-correlated with Chandra source lists. The residual systematic error in the corrected source positions is estimated to be of the order arcsec.
To generate energy spectra and light curves of XMMU J013359.5+303634, the source counts were extracted from elliptical or circular regions including at least per cent of the source energy flux. For the 2010 Jul. 9-10 observation, the elliptical extraction regions with semi-axes of 20 and 12 and position angle of 50∘ (EPIC-pn) and 20∘ (EPIC-MOS) were used. For the 2010 Jul. 11-12, circular regions of 18 radius were used to extract source spectra and light curves from EPIC-pn and MOS detectors. Adjacent source-free regions of the same size were used to extract background spectra and light curves. The source and background spectra were then renormalized applying the standard SAS tasks. The spectra and light curves were built by selecting valid single and double (pattern 0-4) events for EPIC-pn and single-quadruple (pattern 0-12) events for the MOS cameras in the keV energy range. To improve timing analysis sensitivity, the combined source and background light curves from individual EPIC detectors were used. The EPIC-pn and MOS light curves were extracted using identical time filtering criteria based on Mission Relative Time (MRT), following the procedure described in Barnard et al. (2007) to ensure proper synchronization.
For the 2010 July 9-10 and July 11-12 observations, EPIC-pn and MOS source spectra were grouped to contain a minimum of 20 counts per spectral bin, in order to allow use of statistics, and fit to analytic models using the XSPEC v.12222http://heasarc.gsfc.nasa.gov/docs/xanadu/xspec/index.html fitting package (Arnaud, 1996). For the 2010 Aug. 12-13 observation, the source count rate was not sufficient to perform spectral analysis. The spectra from individual EPIC detectors were fitted simultaneously with independently varying normalizations. For the timing analysis, the standard XANADU/XRONOS v.5333http://heasarc.gsfc.nasa.gov/docs/xanadu/xronos/xronos.html tasks and Lomb-Scargle period search method were used (Scargle, 1982; Press et al., 2007).
The data of the Chandra observations were processed using the CIAO v4.4444http://asc.harvard.edu/ciao/ threads. The standard screening of the Chandra data was used to exclude time intervals with high background levels. For each observation, the X-ray images in the 0.3-7 keV energy band were generated, and the CIAO wavelet detection routine wavdetect was used to detect point sources.
To estimate upper limits on the quiescent source luminosity, the 2 upper limits on Chandra/ACIS and XMM-Newton/EPIC count rates estimated from the X-ray images, were converted into energy fluxes in the 0.3-10 keV energy range using Web PIMMS555http://heasarc.gsfc.nasa.gov/Tools/w3pimms.html, assuming an absorbed power law spectral shape with photon index and foreground absorbing column = cm-2. For the 2010 Aug. 12-13 observation, the same procedure was applied to convert source count rate from XMM-Newton/EPIC images to luminosity.
In the following analysis, a distance of 817 kpc is assumed for M33 (Freedman et al., 2001). All parameter errors quoted are 68% () confidence limits.
3 Results
3.1 Source detection and possible optical counterparts
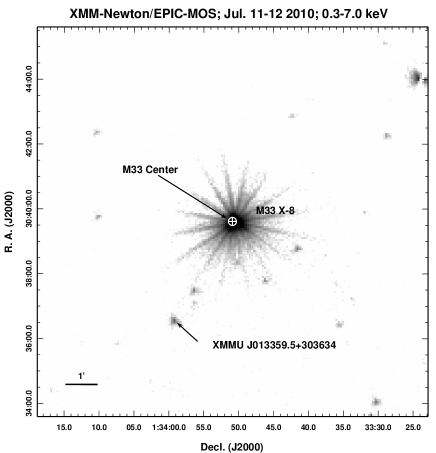
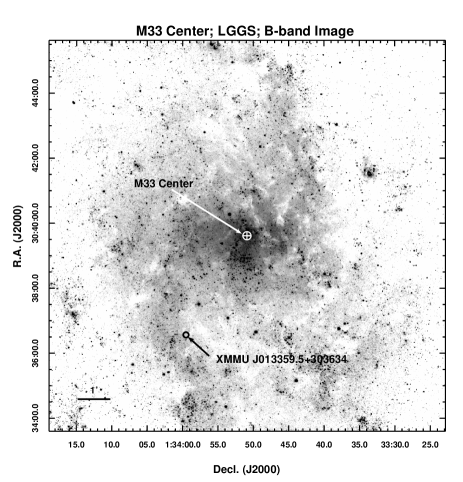
A new transient X-ray source XMMU J013359.5+303634 has been discovered in the data of the 2010 July 9-10 and 11-12 XMM-Newton observations of the M33 field (Table 1). The observed source luminosity estimated from spectral analysis was ergs s-1 (Table 3). XMMU J013359.5+303634 was marginally detected during the subsequent, 2010 August 12-13 XMM-Newton observation with a count rate of cnts s-1 in EPIC-pn corresponding to a much lower luminosity of ergs s-1. Using the corrected EPIC image astrometry, the estimated position of XMMU J013359.5+303634 is (J2000 equinox) with an uncertainty of (Fig. 1). The projected galactocentric distance of XMMU J013359.5+303634 is or pc. The analysis of other archival observations of the same field with Chandra did not yield any source detection with an upper limit (2) ranging from to ergs s-1 (or 24-230 times lower than the observed outburst luminosity), depending on the duration of the observation and instrument used (Fig. 3). In addition, the source was not detected in the combined 2001-2003 XMM-Newton survey observations of M33 (Pietsch et al., 2004) down to a luminosity level of ergs s-1.
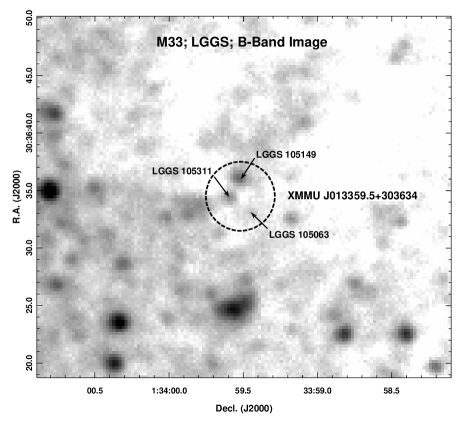
| LGGS ID | RA (J2000) | Dec (J2000) | mag | |||
|---|---|---|---|---|---|---|
| (h:m:s) | (d:m:s) | (mag) | (mag) | () | ||
| 105063 | 01:33:59.47 | +30:36:33.0 | 22.40 | 0.30 | -0.01 | 1.6 |
| 105149 | 01:33:59.52 | +30:36:36.0 | 20.92 | -0.11 | -0.86 | 1.5 |
| 105311 | 01:33:59.60 | +30:36:34.3 | 21.17 | 0.39 | -0.96 | 1.1 |
The search for the optical counterpart using the images from the Digitized Sky Survey (red and blue) did not reveal any stellar-like object brighter than mag within the 3 error circle of XMMU J013359.5+303634. A cross-correlation with optical catalog based on the deep, high resolution Local Group Galaxies Survey (LGGS) (Massey et al., 2006) yielded three possible counterparts of 21-22 mag in band within 3 distance from the X-ray position (Fig. 2, Table 2). Assuming the M33 optical color excess =0.12 (Massey et al., 2007), the brightest optical object (LGGS 105149) has intrinsic colors and and absolute magnitude consistent with being an early B V main sequence star (Massey et al., 2006; Cox, 2000). It also falls into the Be star domain in the diagram, as does its reddening-free Johnson Q-index of (Feinstein & Marraco, 1979; Massey et al., 2007). The second brightest optical object (LGGS 105311) with estimated absolute magnitude of is probably a blend of two or more unresolved stars of different spectral class, having typical of O to B star and of late A to early F spectral class (Cox, 2000). The third object (LGGS 105063) shows colors of an A/F class main sequence star with absolute magnitude .
 |
 |

3.2 X-ray pulsations
The data from EPIC detectors in the 0.3-10 keV energy band was used to perform timing analysis of XMMU J013359.5+303634. After a barycentric correction of the event arrival times, I performed a Fast Fourier Transform (FFT) and Lomb-Scargle periodogram analysis, in order to search for coherent periodicities. The combined EPIC-pn and MOS light curves with 2.6 s time bins were used to improve sensitivity. The Fourier spectra and periodograms of data from the 2010 Jul. 9-10 and Jul. 11-12 XMM observations show strong peaks at the frequency of Hz (Fig. 4). The strengths of the peaks in the individual Fourier spectra (Fig. 4) correspond to the spurious detection probabilities of and for the Jul. 9-10 and Jul. 11-12 XMM-Newton observations (Vaughan et al., 1994). The source photon counts during the 2010 Aug. 12-13 observation was too low to obtain a significant signal in the frequency domain.
To refine the estimate of the pulsation period, a light curve folding technique was used, assuming no period change during individual observations. The most likely values of the period (Table 3) were obtained fitting the peaks in the versus trial period distribution with a combination of Gaussian function and a constant. The period errors shown in Table 3 were computed following the procedure described in (Leahy, 1987). Then, the source light curves were folded using the periods determined from the folding analysis. The resulting folded light curves of XMMU J013359.5+303634 in the 0.3-10 keV energy band during the first two observations are shown in Fig. 4. The source demonstrates quasi-sinusoidal pulse profiles with an additional significant peak around phase 0.3 (Fig. 4). To account for deviations from the sinusoidal shape, the harmonic representation of the folded pulse profiles was used (i.e. sum of harmonics plus a constant). Only the first four harmonics were kept because higher order harmonics were not significant. To characterize the amplitude of the pulsations, the source pulsed fraction is defined as ()/(), where and represent the harmonic fit at the maximum and minimum of the pulse profile excluding background photons. The pulsed fraction was found to be stable over a period covered by 2010 Jul. 9-10 and 11-12 observations with respective amplitudes of 465 and 473 per cent (Table 3).
In order to search for a possible change in the pulsation period on the time scale of the individual observation, each observation was divided into a shorter 10 ks segments and timing analysis was performed on each light curve segment. In the course of both the 2010 Jul. 9-10 and Jul. 11-12 observations, the pulsation period was stable within measurement errors. In addition, no significant change of the average pulsation period was detected between the 2010 Jul. 9-10 and Jul. 11-12 XMM-Newton observations (Table 3).
No significant energy dependence of the source pulse profile was detected during the 2010 Jul. 9-12 observations. For the 2010 Jul. 11-12 observation, pulse profiles in the soft (0.3-2 keV) and hard (2-10 keV) bands folded at the best pulsation period along with their ratio are shown in Fig. 5. The corresponding background-corrected pulsed fractions were 464 for the 0.3-2 keV energy band and 474 per cent for the 2-10 keV energy band.
 |
 |

3.3 X-ray spectra
The pulse phase averaged XMM-Newton/EPIC spectra of XMMU J013359.5+303634 during the 2010 July 9-12 observations can be adequately fit with an absorbed simple power law model with photon index, and an equivalent hydrogen column density N cm-2. The corresponding absorption-corrected luminosity of the source in the 0.3-10 keV band is ergs s-1. The best-fit spectral model parameters of the source are given in Table 3. The shape of the energy spectra of XMMU J013359.5+303634 in the 0.3-10 keV energy band did not change significantly between the 2010 July 9-10 and July 11-12 observations. The measured absorbing column is 2.5 times higher than the Galactic hydrogen column in the direction of M33, 6 cm-2 (Dickey & Lockman, 1990). The excess absorbing column is consistent with an additional intrinsic absorption within the system and inside the disk of M33. For the 2010 Aug. 12-13 observation, the number of source counts was not sufficient to perform spectral analysis.
| Timing Parameters | POWERLAW*WABS Spectral Model Parameters | ||||||||
| Date | Period | PF0.3-10keV | NH | Photon | Fluxb | Fluxc | d | e | |
| (s) | (per cent)a | ( cm-2) | Index | (d.o.f.) | |||||
| 2010 Jul. 9-10 | 1.28 | 1.41 | 67.6(69) | ||||||
| 2010 Jul. 11-12 | 1.35 | 1.48 | 190.2(143) | ||||||
a – pulsed fraction in the keV energy band
b – absorbed model flux in the keV energy range in units of erg s-1 cm-2
c – unabsorbed model flux in the keV energy range in units of erg s-1 cm-2
d – absorbed luminosity in the keV energy range in units of erg s-1, assuming the distance of 817 kpc
e – unabsorbed luminosity in the keV energy range in units of erg s-1, assuming the distance of 817 kpc

4 Discussion and Conclusions
The absence of a bright optical counterpart to XMMU J013359.5+303634, its overall X-ray properties and positional coincidence with one of the major spiral arms in M 33 (Fig. 1) imply that it is not a Galactic foreground object and almost certainly belongs to M33. The X-ray pulsations and spectra of the source are consistent with an accreting highly magnetized neutron star in a binary system.
In the high-mass system scenario, the 285.4 s pulse period places XMMU J013359.5+303634 squarely among Be systems or underfilled Roche Lobe supergiant systems on the Corbet diagram (Corbet, 1986; Charles & Coe, 2006). The transient behavior of the source strongly favors the Be X-ray binary interpretation, in which the X-ray outbursts are attributed to either periastron passages of the compact companion (Type I outbursts) or changes in the Be star circumstellar disk that might occur at any binary phase (Type II outbursts) (Stella et al., 1986; Negueruela et al., 2001). Possible optical counterparts to XMMU J013359.5+303634 are all fainter than 20 mag in the V band (Table 2), with absolute magnitudes between and at 817 kpc, supporting the Be system identification, but not ruling out a supergiant system with a luminosity class II companion. In addition, the brightest optical object located within the error circle of XMMU J013359.5+303634 has properties consistent with being an early B V star and possibly belonging to the Be class. Assuming the distance of 817 kpc, the absorption-corrected keV X-ray luminosity of XMMU J013359.5+303634 measured in the Jul. 9-12 observations ( ergs s-1) also falls within the range observed for Be X-ray binary pulsars and exceeds typical luminosities observed in the wind-fed supergiant systems (Bildsten et al., 1997; Charles & Coe, 2006).
If XMMU J013359.5+303634 is indeed a Be system, its binary period, estimated from the Corbet diagram falls in the day range. The observed time span between XMM-Newton observations when the source was detected allows to put an additional limit on the orbital period. Assuming that a single Type I outburst was observed and that it was lasting less than one orbital cycle requires days.
Another possibility is that XMMU J013359.5+303634 is a transient low-mass binary system (Bildsten et al., 1997). In that scenario, the transient outbursts could be explained as a result of a viscous-thermal instability of the quiescent accretion disk. The relatively long pulsation period of the source almost certainly excludes low-mass short orbital period systems. On the other hand, the possibility of a very long period system with red giant companion similar to the Galactic source GX 1+4 (Chakrabarty & Roche, 1997) can not be completely ruled out, since the expected brightness of the red giant companion ( mag) does not exceed the brightness of the individual optical objects detected within the error circle of XMMU J013359.5+303634.
Although most of the observed properties of XMMU J013359.5+303634 favor a Be/X-ray binary identification, a proper optical identification is essential to determine the actual nature of the system. To facilitate it, deeper high-resolution optical observations of the source region are needed along with an improved X-ray position measurement. Regular monitoring X-ray observations of the central region of M33 have a potential to detect new outbursts from XMMU J013359.5+303634, improve source localization and put constraints on its orbital parameters.
The number of X-ray pulsar candidates with non-supersoft spectra located outside our own Galaxy and Magellanic Clouds is still very small with only four such systems known so far, including XMMU J013359.5+303634. All of them were discovered as transient sources with X-ray luminosities in the ergs s-1 range, and probably belong to a luminous Be/X-ray binary class. Because of their higher mass transfer rates, luminous X-ray pulsars are ideal laboratories to study effects of angular momentum transfer and interaction between pulsar magnetosphere and the accretion flow through the evolution of their pulsation periods (Rappaport & Joss, 1977; Ghosh & Lamb, 1979). Analysis of the pulse profiles and spectral properties of these objects can provide extremely valuable information on the accretion flow and magnetic field geometry, neutron star compactness and emission properties (Basko & Sunyaev, 1976; Annala & Poutanen, 2010). The discovery of XMMU J013359.5+303634 is yet another demonstration that monitoring observations with current X-ray missions can detect these and similar pulsating sources (both transient and persistent) in the galaxies located up to a few Mpc away. Observations of nearby galaxies allow us to monitor a significantly bigger X-ray source population when compared to just our own Galaxy and its immediate neighbors. In the galaxies with recent and ongoing star formation, X-ray pulsars should constitute a sizable fraction of the total X-ray source population, with some of them expected to be bright enough ( ergs s-1) for detection by current instruments, opening a way to significantly increase the statistics of luminous X-ray pulsars.
Acknowledgments
The author would like to thank the referee for comments and suggestions that helped to improve the paper. This research has made use of data obtained through the High Energy Astrophysics Science Archive Research Center Online Service, provided by the NASA/Goddard Space Flight Center. XMM-Newton is an ESA Science Mission with instruments and contributions directly funded by ESA Member states and the USA (NASA). Chandra X-ray observatory is operated by the Smithsonian Astrophysical Observatory on behalf of NASA. This research also made use of NASA/IPAC Extragalactic Database (NED), which is operated by the Jet Propulsion Laboratory, California Institute of Technology, under contract with NASA.
References
- Annala & Poutanen (2010) Annala, M., & Poutanen, J. 2010, A&A, 520, 76
- Arnaud (1996) Arnaud, K. 1996, in Astronomical Data Analysis Software and Systems V, ASP Conference Series 101, ed. G. Jacoby & J. Barnes (San Francisco: ASP) 17
- Barnard et al. (2007) Barnard, R., Trudolyubov, S., Kolb, U. C., Haswell, C. A., Osborne, J. P., & Priedhorsky, W. C. 2007, A&A, 469, 875
- Basko & Sunyaev (1976) Basko, M. M., & Sunyaev, R. A. 1976, MNRAS, 175, 395
- Bildsten et al. (1997) Bildsten, L., Chakrabarty, D., Chiu, J., et al. 1997, ApJSS, 113, 367
- Chakrabarty & Roche (1997) Chakrabarty, D., & Roche, P. 1997, ApJ, 489, 254
- Charles & Coe (2006) Charles, P. A., & Coe, M. J. 2006, in Compact Stellar X-ray Sources, ed. W. H. G. Lewin & M. van der Klis (Cambridge: Cambridge Univ. Press), 215
- Corbet (1986) Corbet, R. H. D. 1986, MNRAS, 220, 1047
- Cox (2000) Cox, A. N. 2000, in Allen’s Astrophysical Quantities, ed. A. N. Cox (4th ed.; New York: AIP)
- Dickey & Lockman (1990) Dickey, J. M., & Lockman F. J. 1990, ARA&A, 28, 215
- Fabbiano (2006) Fabbiano, G. 2006, ARA&A, 44, 323
- Fabbiano & White (2006) Fabbiano, G., & White, N. E. 2006, in Compact Stellar X-ray Sources, ed. W. H. G. Lewin & M. van der Klis (Cambridge: Cambridge Univ. Press)
- Feinstein & Marraco (1979) Feinstein, A., & Marraco, H. G. 1979, AJ, 84, 1713
- Freedman et al. (2001) Freedman, W. L., et al. 2001, ApJ, 553, 47
- Ghosh & Lamb (1979) Ghosh, P., & Lamb, F. K. 1979, ApJ, 234, 296
- Giacconi et al. (1971) Giacconi, R., Gursky, H., Kellogg, E., Schreier, E., & Tananbaum, H. 1971, ApJ, 167, L67
- Haberl & Pietsch (2001) Haberl, F. & Pietsch, W. 2001, A&A, 373, 438
- Leahy (1987) Leahy, D. A. 1987, A&A, 180, 275
- Mason et al. (2001) Mason, K.O., et al. 2001, A&A, 365, 36
- Massey et al. (2006) Massey, P., Olsen, K. A. G., Hodge, P. W., Strong, S. B., Jacoby, G. H., Schlingman, W., Smith, R. 2006, AJ, 131, 2478
- Massey et al. (2007) Massey, P., McNeill, R. T., Olsen, K. A. G., et al. 2007, AJ, 134, 2474
- Misanovic et al. (2006) Misanovic, Z., Pietsch,W., Haberl, F., Ehle, M.,Hatzidimitriou, D., & Trinchieri, G. 2006, A&A, 448, 1247
- Monet et al. (2003) Monet, D.G., et al. 2003, AJ, 125, 984
- Nagase (1989) Nagase, F. 1989, PASJ, 41, 1
- Negueruela et al. (2001) Negueruela, I., Okazaki, A. T., Fabregat, J., Coe, M. J., Munari, U., & Tomov, T. 2001, A&A, 369, 117
- Osborne et al. (2001) Osborne, J. P., Borozdin, K. N., Trudolyubov, S. P., et al. 2001, A&A, 378, 800
- Pietsch et al. (2004) Pietsch,W., Misanovic, Z.,Haberl, F.,Hatzidimitriou, D., Ehle, M., & Trinchieri, G. 2004, A&A, 426, 11
- Plucinsky et al. (2008) Plucinsky, P. P., et al. 2008, ApJS, 174, 366
- Press et al. (2007) Press, W. H., Teukolsky, S. A., Vetterling, W. T., & Flannery, B. P. 2007, Numerical Recipes: The Art of Scientific Computing, 3rd Ed. (Cambridge: Cambridge Univ. Press)
- Rappaport & Joss (1977) Rappaport, S., & Joss, P. C. 1977, Nature, 266, 683
- Scargle (1982) Scargle, J. D. 1982, ApJ, 263, 835
- Stella et al. (1986) Stella, L., White, N. E., & Rosner, R. 1986, ApJ, 308, 669
- Strueder et al. (2001) Strueder, L. et al., 2001, A&A, L18
- Trinchieri et al. (1988) Trinchieri, G., Fabbiano, G., & Peres, G. 1988, ApJ, 325, 531
- Trudolyubov et al. (2005) Trudolyubov, S., Kotov, O., Priedhorsky, W., Córdova, F., & Mason, K. 2005, ApJ, 634, 314
- Trudolyubov, Priedhorsky & Córdova (2007) Trudolyubov, S. P., Priedhorsky, W. C., & Córdova, F. A. 2007, ApJ, 663, 487
- Trudolyubov & Priedhorsky (2008) Trudolyubov, S. P., & Priedhorsky, W. C. 2008, ApJ, 676, 1218
- Trudolyubov (2008) Trudolyubov, S. P. 2008, MNRAS, 387, L36
- Tüllmann et al. (2011) Tüllmann, R., Gaetz, T. J., Plucinsky, P. P., et al. 2011, ApJS, 193, 31
- Turner et al. (2001) Turner, M. et al., 2001, A&A, 365, L27
- Vaughan et al. (1994) Vaughan, B. A., van der Klis, M., Wood, K. S., et al. 1994, ApJ, 435, 362
- White, Swank & Holt (1983) White, N. E., Swank, J. H., & Holt, S. S. 1983, ApJ, 270, 711