The low energy spectrum of TeO2 bolometers: results and dark matter perspectives for the CUORE-0 and CUORE experiments
Abstract
We collected 19.4 days of data from four 750 g TeO2 bolometers, and in three of them we were able to set the energy threshold around 3 keV using a new analysis technique. We found a background rate ranging from 25 cpd/keV/kg at 3 keV to 2 cpd/keV/kg at 25 keV, and a peak at 4.7 keV. The origin of this peak is presently unknown, but its presence is confirmed by a reanalysis of 62.7 kgdays of data from the finished CUORICINO experiment. Finally, we report the expected sensitivities of the CUORE-0 (52 bolometers) and CUORE (988 bolometers) experiments to a WIMP annual modulation signal.
pacs:
07.57.Kp, 29.85.Ca, 95.35.+dI Introduction
Tellurium dioxide bolometers are excellent detectors to search for rare processes. Operated at a temperature of about 10, these detectors feature an energy resolution of a few keV over an energy range extending from a few keV up to several MeV. This, together with the low level of radioactive background achievable and the low cost, makes them ideal detectors for CUORE, an experiment that will search for neutrinoless double beta decay (0DBD) of Arnaboldi:2003tu ; ACryo .
CUORE will consist of 988 bolometers of 750 each and is expected to reach a background level at the Q-value (around 2528 keV Redshaw:2009zz ; scielzo09 ; Rahaman:2011zz ) of the order of 0.01, thus allowing a sensitivity to 0DBD down to the inverted hierarchy of neutrino masses. CUORE is currently being installed at the Laboratori Nazionali del Gran Sasso (LNGS) in Italy and is scheduled to start taking data in 2014. The experimental design was validated by CUORICINO, an array of 62 bolometers (for total mass of 40.7) which took data at LNGS from 2003 to 2008 and put stringent limits on the 0DBD half-life Andreotti:2010vj ; Andreotti:2011in . To test the new assembly line and the materials chosen for CUORE, an array of 52 bolometers, named CUORE-0, has been recently built. It is expected to have a smaller background than CUORICINO and will start taking data in Fall 2012.
Given the high mass, the good energy resolution, and the low background, CUORE-0 and CUORE experiments can search for rare processes such as Dark Matter interactions. While there is significant evidence that Dark Matter exists Bertone:2004pz , its composition is as of yet unknown. Weakly Interacting Massive Particles (WIMPs) are the theoretically favored candidates Steigman:1984ac , and several earthbound experiments have been designed to detect their scattering off nuclei, which should produce energy releases of a few keV Goodman:1984dc . Many experiments use multiple signatures (e.g. phonon, scintillation and ionization) to discriminate nuclear recoils from the background originating from natural radioactivity. Other experiments search for the expected annual modulation of the interaction rate as the Earth traverses the uniform Dark Matter distribution in the galactic halo Drukier:1986tm . Some experiments have reported compatibility with the signal expected for a galactic halo WIMP population, but have been met with skepticism pdg2012 . As our knowledge of the properties of Dark Matter is limited, a variety of different experimental approaches are required and the search for Dark Matter with bolometers could provide important new information.
Such searches were not performed in CUORICINO because the energy threshold was too high, of the order of tens of keV. A new software trigger was developed to lower the energy threshold DiDomizio:2010ph . The trigger is based on the matched filter algorithm Gatti:1986cw ; Radeka:1966 and also provides a pulse shape parameter to suppress false signals generated by detector vibrations and electronics noise.
In this paper we show the energy spectrum of four bolometers originally operated at LNGS to test the performances of CUORE crystals Alessandria:2011vj . In three of them we were able to set the energy threshold around 3, while the fourth was set to 10 because of higher detector noise. The energy spectrum of the three bolometers exhibits a peak at 4.7 whose origin is presently unknown. The peak has a constant rate in time, and its presence is confirmed by a reanalysis of the data from the last two months of operation of CUORICINO. Given the observed counting rate, we also evaluate the sensitivity of CUORE-0 and CUORE to an annual modulation signal induced by WIMP Dark Matter candidates, comparing it to the results of other experiments.
II Experimental setup
A CUORE bolometer is composed of two main parts: a crystal and a neutron transmutation doped Germanium (NTD-Ge) thermistor wang ; Itoh . The crystal, a cube of side length , is held by PTFE supports in copper frames. The frames are connected to the mixing chamber of a dilution refrigerator, which keeps the bolometers at a temperature of about . The thermistor is glued to the crystal and acts as thermometer. The temperature increase due to an energy deposition in the crystal is measured by the decrease in the resistance of the thermistor Mott:1969 ; Itoh:1996 . The thermistor is biased by a constant current and a change in the voltage across it constitutes the signal AProgFE . In the setup presented in this paper, called CUORE Crystal Validation Run 2 (CCVR2), each crystal was provided with two thermistors for redundancy. Two Joule heaters were also glued on two crystals and used to inject heat pulses with controlled amounts of energy to monitor the detector gain and efficiencies stabilization ; Arnaboldi:2003yp ; Andreotti:2012zz . The bolometers were operated in the cryogenic R&D facility of CUORE whose details can be found in Refs. Pirro:2006mu ; Arnaboldi:2006mx ; Arnaboldi:2004jj .
Data were collected over 23 with small interruptions for calibrations and cryostat maintenance. The effective live time amounted to 19.4. On each of the four bolometers, labeled B1, B2, B3 and B4, we selected the thermistor in which the trigger reached the lowest energy threshold.
The energy calibration was performed by inserting two wires of thoriated tungsten in proximity of the detector, between the cryostat and the lead shields placed externally. The main lines of 232Th, ranging from 511 to 2615, and the lines generated by metastable Te isotopes in the crystals, ranging from 30 to 150, were used for the determination of the calibration function. These isotopes are produced by cosmogenic activation during production and air-shipment of the crystals outside the underground laboratory.
III Detector performance
The energy resolution was evaluated both at the baseline level and on the lowest energy peak in the spectrum. Randomly triggered events, not containing pulses, were used to evaluate the fluctuation of the baseline after the application of the matched filter. A Gaussian fit was performed on the 30.5 Sb line, which is due to EC decays of metastable Te isotopes. As one can see from Tab. 1, baseline and 30.5 resolutions are quite close, since at these energies the resolution of bolometers is expected to be dominated by the noise. The bolometers feature excellent energy resolution, with B2, B3, and B4 below 1, and B1 at 3.3.
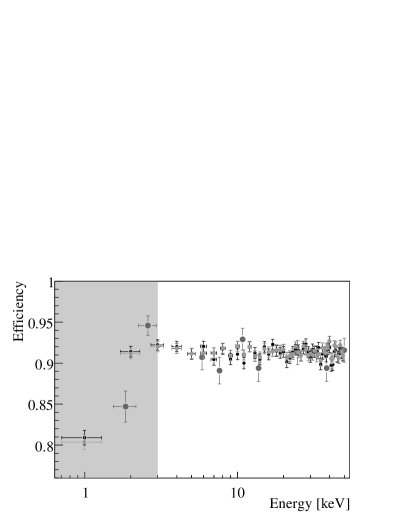
The detection efficiencies were measured via an energy scan performed at the end of the run by using the Joule heaters to provide sequences of pulses from 1 to . However, heater events and actual particle events have slightly different pulse shapes which could result in slightly different energies and detection efficiencies. The trigger efficiency and any differences that may result from the difference between the heater pulses and particle events were investigated by Monte Carlo simulations.
Heater pulses between 1–50 and particle pulses in the same energy range were simulated separately using the tools described in Ref. Carrettoni:2011rn . Only B2 and B3 were simulated for heater pulses while all the four bolometers were considered for the particle pulses simulation. Both Monte Carlo runs included simulated detector noise and the background from particle pulses, randomly generated to match the event rate and the entire measured energy spectrum from threshold up to 5.4, i.e. the energy of 210Po decays in the crystal. We processed the output of the simulation in the same way as the heater scan measurement. The estimated efficiencies on B2 are shown in Fig. 1, where the good agreement between Monte Carlo and data is evident.
The similarities in the energy dependence demonstrate that the trigger acts in the same way on particle and heater pulses. This feature is visible also on B3, the other bolometer with a heater. We estimate the detection efficiencies on the two bolometers without heater (B1 and B4) using the Monte Carlo. For each bolometer, we set the energy threshold for the data analysis as the energy at which the plateau is reached. The detection efficiency is computed as the weighted average of each point in the plateau and it is considered constant in the data analysis above threshold. The energy threshold, the heater-measured, and particle-simulated detection efficiencies of each bolometer are reported in Tab. 1. The heater-simulated detection efficiencies are found consistent with the heater-measured ones within .
The residual 10-20% inefficiency in the plateau is due to the trigger dead time, which is mainly due to 210Po decays. 210Po is introduced in the crystal growth and has a half-life of 147 days. For sufficiently aged crystals, such as the CUORE-0 and CUORE ones, the dead time is expected to be negligible because this activity has decayed away, raising the efficiencies up to 100% (see Ref. DiDomizio:2010ph for further details).
| Bolo | |||||
| [keV FWHM] | [keV] | ||||
| B1 | 10.0 | n/a | |||
| B2 | 3.0 | ||||
| B3 | 2.5 | ||||
| B4 | 2.5 | n/a | |||
IV Energy calibration
The calibration function is a third order polynomial without intercept. The residual with respect to the nominal energy of the peaks in the low energy spectrum is shown in Fig. 2.
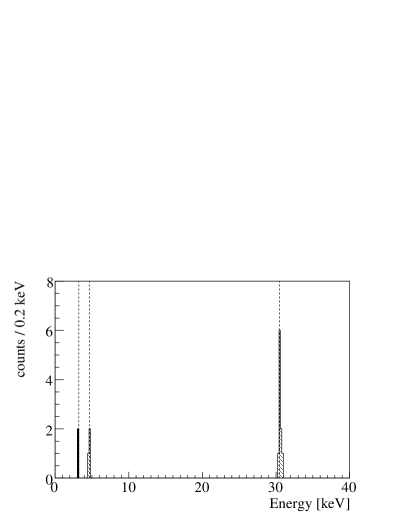
The accuracy at energies lower than was verified by using events from 121Te and 40K contaminations in the crystals. These isotopes may decay via EC to 121Sb and 40Ar, respectively, with the emission of a -ray from the daughter nucleus de-excitation ( or from 121Te and 1461 from 40K) and the de-excitation of the atomic shell L1 and K ( or from 121Te and from 40K). The atomic de-excitation process is fully contained in the crystal while, in some cases, the can escape and hit another crystal, thus producing a double hit event. To select double hit events, we set the time coincidence window to 10 , i.e. the measured jitter between the response of the bolometers. We required that in one of the two crystals there is an energy release corresponding to the -rays from 121Te or 40K, and then, after applying the SI cut, we selected energy depositions between threshold and 40 in the other crystal (Fig. 3). Two events from 40K were found (3.04 and 3.18), three from the L1 (4.48, 4.67 and 4.74), and ten from the K de-excitation after the 121Te decay (). Since all the events are compatible with their expected energy, the accuracy of the low-energy calibration is confirmed. We also note that the K/L capture ratio for 121Te is compatible within two standard deviations with the expected value of 7 Ohya20101619 .
V Event selection
We selected signal events using the shape indicator variable (SI) described in Ref. DiDomizio:2010ph . This variable is based on the of the fit of the waveforms with the expected shape of the signal. The distribution of SI versus energy for B2 is shown in Fig. 4. The signal region is easily identified, and a considerable part of the pulses generated by thermal and electronic noise can be removed with a cut on this variable.
We evaluated the optimal value of the cut on SI using the Sb K line at . We performed a series of extended unbinned maximum-likelihood fits, selecting the events below a fixed SI value. For each SI cut, the spectra of cut accepted events and cut rejected events were simultaneously fitted with a Gaussian, representative of the signal, plus a first-order polynomial function, representative of the background. Signal () and background () efficiencies after the cut were evaluated directly in the fit. For each bolometer we selected the cut which maximized the statistical significance, defined as , corresponding in this case to .
No anti-coincidence cut is applied. Since over the entire energy range multiple-hit events are mainly due to random coincidences, the application of anti-coincidence cuts reduces the statistics without gaining in background reduction.
VI Measured spectra
The energy spectra of the four detectors show several and peaks that are clearly identified as due to U, Th and K contaminations (of the crystals themselves and of the experimental setup) and few low energy peaks identified as being due to Te metastable isotopes. The region between threshold and is shown in Fig. 5.
In the three bolometers with the lowest threshold, a peak appears at about , the energy of the L1 atomic shell of Sb. This in principle indicates that the line could be ascribed to the EC decay of a Te isotope, however none of the known or predicted isotope decays can explain our observation:
-
•
The 121mTe and its daughter 121Te decay via EC with half-lives of 154 and 17 days, respectively. However the intensity of the observed peak is higher than the K line of Sb at 30.5 keV. This is in contradiction with the measured value of the K/L1 capture ratio for these isotopes which is greater than one.
-
•
The other EC decaying metastable Te isotopes (and their daughters) have half-lives smaller than 4.7. As it will demonstrated later, the observed peak rate is constant over 20.
-
•
is a naturally occurring isotope of Tellurium (abundance ohya2004nuclear ) which may decay via EC to 123Sb with a Q-value of . Since the transition is 2nd-forbidden unique, it has been estimated that very little K capture actually occurs and that the majority of EC decays take place from the L3 shell. Several searches for Sb K lines from EC of have been performed. Positive evidence, , was claimed watt1962search but subsequently ruled out zuber:2003 ; PhysRevC.67.014323 . In this paper, we show for the first time an energy spectrum down to the L energy region. The line we observe however cannot be attributed to 123Te, since, as described in the next section, the energy is compatible with the L1 shell (4.6983) and not with the L3 one (4.1322).
To further investigate the peak origin, in the next future we will operate crystals enriched in 128Te and 130Te (therefore depleted in other Te isotopes) and see if the peak intensity changes. In the following we report the analysis of the peak in the energy distribution of single bolometers, to provide all the possible details and to stimulate a discussion within the scientific community that will hopefully lead to its identification.
To determine the intensity, the peaking background due to the EC decay of 121mTe–121Te was removed. The -rays produced by these isotopes can escape without hitting another crystal, such that only the K or the L de-excitations are measured. The number of pure L events from 121Te and 121mTe () were estimated using a Monte Carlo simulation based on GEANT4 allison2006geant4 , normalizing the single hit spectra to the measured rate of the most intense 121mTe peak (294.0).
To estimate the intensity and the energy of the line from the data, we performed a separate extended unbinned maximum-likelihood fit for each bolometer, using a likelihood function constituted by a Gaussian plus two exponential functions to reproduce the background. We set the pulse shape cuts at the estimated optimal values. Since the events in the 4.7 peak are more plentiful than in the Sb K peak at 30.5, the selection efficiencies were recomputed, and confirmed to be equal to 1. The obtained number of events was then corrected taking into account the detection and cut efficiencies and the expected background , according to the equation . Best fits are shown in Fig. 6. In Tab. 2 we report the summary of the peak parameters of each bolometer, also including the estimated peaking background .

| Bolometer | Energy | FWHM | ||
|---|---|---|---|---|
| [keV] | [keV] | [counts] | [counts] | |
| B2 | ||||
| B3 | ||||
| B4 |
We combined the profile negative log-likelihoods of and of the three bolometers (Fig. 6) to compute the average rate. The estimated value of the number of signal events is , from which we evaluated the line intensity in to be . The energy averaged over the three bolometers is .
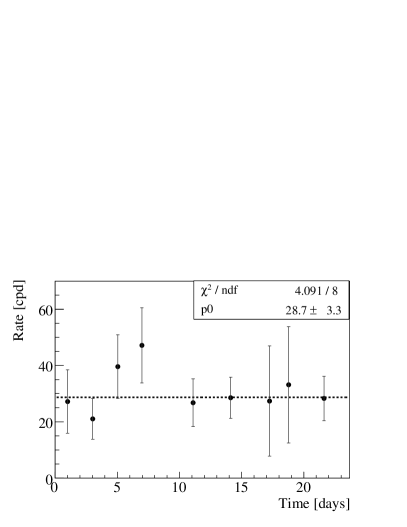
Figure 7 shows the peak rate along the duration of the data-taking, which is in a very good agreement with a constant distribution, indicating that this signal is not due to a short-living radioactive contamination. It also indicates that any variation of the detection efficiency with time is negligible compared to the statistical error.
To check the stability of the line over a longer period of time, we checked its presence in the CUORICINO data. During the last two months of operation of CUORICINO, the data-acquisition system being developed for CUORE (the same used for CCVR2), was run in parallel with the old system, saving to disk the continuous stream of data. The live-time of continuous data amounts to 47.5. We ran the new trigger on these data but we were able to reach a threshold below 4 only on 4 bolometers, because of the high vibrational noise transmitted by the holder to the crystals (CCVR, CUORE-0 and CUORE holders have been explicitly redesigned to lower the transmitted noise). These 4 bolometers had smaller size (3x3x6, 330) than other CUORICINO and CUORE bolometers, and featured higher signal to noise ratio.
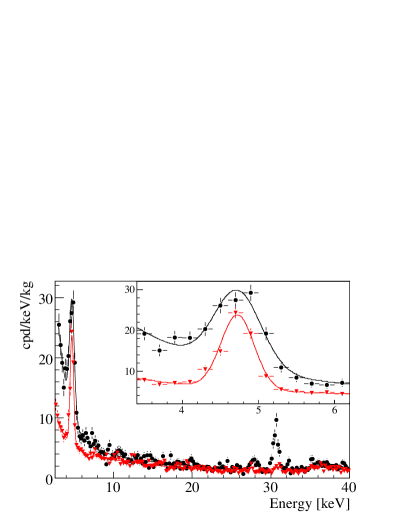
The sum energy spectrum of the four bolometers is overlaid to the sum energy spectrum of the CCVR2 bolometers in Fig. 8. In CUORICINO the heater energy scan was not performed, therefore the spectrum shown is not corrected for the detection efficiencies. As it can be seen from the figure, the peak is very well visible, with a fitted energy resolution of . The intensity and the average energy are found to be similar to the CCVR2 ones, being and , respectively. We also note that the 30.5 peak disappeared, because the 121m-121Te isotopes decayed away during the 5 years of underground data taking.
As the calibration was based on the 232Th source only, and given the lack of low energy peaks, the accuracy of the calibration function at low energies cannot be checked directly on CUORICINO data. To have an estimate of the calibration accuracy, during a new CCVR run we built a new setup in which a 55Fe source was deposited on the copper holder. The detector was operated in the same setup used for the CCVR2 one, reaching an energy resolution of 1.4 and an energy threshold of around 3. To emulate the CUORICINO conditions, the calibration function was estimated using the peaks from the 232Th source only. The X-rays produced by the 55Fe, with nominal energies between 5.888 and 6.490, resulted in detected energies that were shifted, on average, by only from their nominal values. Even if the operating conditions of this setup were not identical to the CUORICINO ones, this shift can be taken as an indication of the systematics associated to the calibration function.
VII Sensitivity to WIMPs
WIMPs can couple to nucleons via both spin-independent and spin-dependent (axial vector) interactions. Spin-independent scattering dominates when because, for low momentum transfer, it benefits from coherence across the nucleus Jungman1996 . In addition, spin-dependent scattering is significant only on nuclei with an odd number of nucleons. Since of Oxygen is constituted by 16O and of Tellurium is composed by even isotopes (mainly 130Te, 128Te and 126Te), will be most sensitive for spin-independent interacting WIMPs. It has to be remarked that bolometers, unlike other bolometric detectors for Dark Matter, do not discriminate the nuclear recoils induced by WIMPs from the radioactive background. Nevertheless, the high mass and low background achievable with these detectors make it possible to search for an annual modulation of the counting rate.
Compared to CUORICINO, the CCVR2 rate has the same behavior at energies greater than 10, but is considerably higher at lower energies (Fig. 8). We are unable to explain this difference at present, however we expect that the CUORE-0 and CUORE low energy background will not be higher than the CCVR2 one. All the materials used in detector construction, in fact, will be the same as those employed for CCVR2. Moreover, in the case of CUORE-0, the bolometers will be operated in the same cryostat of CUORICINO, which has lower radioactive contaminations compared to the one used to operate CCVR2. To be conservative, we estimate the CUORE-0 and CUORE sensitivity to WIMPs assuming the background rate of these experiments to be equal to the one measured on CCVR2. We assume that the noise will be under control and that all bolometers will achieve a 3 threshold. We focus on the energy region between threshold and 25, featuring an observed background counting rate ranging from about 25 to 2.
We perform toy Monte Carlo simulations generating background events from the CCVR2 fit function shown in Fig. 8, and WIMP events from the predicted distribution described in Ref. LewinSmith1996 , using the following WIMP parameters: density , average velocity and escape velocity from the Galaxy . The quenching factor (QF) of the interactions in is set to 1 Alessandrello:1997ca . We include the dependence of the WIMP interaction rate on the time in the year, and estimate the background+signal asymmetry subtracting the 3-month integrated spectrum across December the 2nd from the 3-month integrated spectrum across June the 2nd. The resulting differential spectrum is fitted with the expected shape induced by the modulation, (examples are given in Fig. 9), and with a flat line at zero counts, . The cross section in the toy simulation is lowered as long as, in a set of experiments, the fit probability of the hypothesis is greater than the one at least 90% of the times.
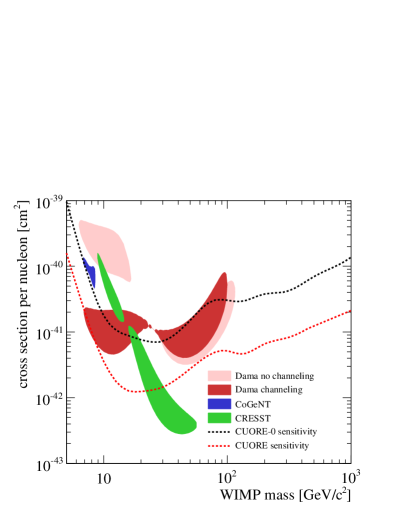
This procedure defines the cross section that could be sensed for a fixed WIMP mass. The 90% CL upper limit sensitivity to the cross-section as a function of the WIMP mass is reported in Fig. 10 for 3-years of CUORE-0 data-taking and 5-years of CUORE. The comparison with other experiments shows that CUORE-0 could test the indication of a WIMP from the DAMA (no-channeling), CoGeNT and CRESST experiments, while CUORE could completely test the DAMA results, under the hypothesis that Dark Matter is purely made of spin-independent interacting WIMPs. We reiterate that because the quenching factor for nuclear recoils compared to electron recoils in bolometers is 1, the 2-6 keV energy region of DAMA corresponds to 7-20 keV assuming scattering on Na (QF=0.3) or 22-67 keV assuming scattering on I (QF=0.9). Therefore, in bolometers it will be possible to look at lower energies and to study with larger detail the shape of the modulation spectrum, thus providing new information to this complicated search.
Acknowledgements.
The CUORE Collaboration thanks the Directors and Staff of the Laboratori Nazionali del Gran Sasso and the technical staffs of our Laboratories. This work was supported by the Istituto Nazionale di Fisica Nucleare (INFN); the Director, Office of Science, of the U.S. Department of Energy under Contract Nos. DE-AC02-05CH11231 and DE-AC52-07NA27344; the DOE Office of Nuclear Physics under Contract Nos. DE-FG02-08ER41551 and DEFG03-00ER41138; the National Science Foundation under Grant Nos. NSF-PHY-0605119, NSF-PHY-0500337, NSF-PHY-0855314, and NSF-PHY-0902171; the Alfred P. Sloan Foundation; and the University of Wisconsin Foundation.References
- (1) C. Arnaboldi et al., Astropart. Phys. 20, 91 (2003).
- (2) C. Arnaboldi et al., Nucl. Instrum. Meth. A 518, 775 (2004).
- (3) M. Redshaw, B. J. Mount, E. G. Myers and F. T. Avignone, Phys. Rev. Lett. 102, 212502 (2009).
- (4) N. D. Scielzo et al., Phys. Rev. C 80, 025501 (2009).
- (5) S. Rahaman et al., Phys. Lett. B 703, 412 (2011).
- (6) E. Andreotti et al., Astropart. Phys. 34, 822 (2011).
- (7) E. Andreotti et al., Phys. Rev. C 85, 045503 (2012).
- (8) G. Bertone, D. Hooper and J. Silk, Phys. Rept. 405, 279 (2005).
- (9) G. Steigman and M. S. Turner, Nucl. Phys. B 253, 375 (1985).
- (10) M. W. Goodman and E. Witten, Phys. Rev. D 31, 3059 (1985).
- (11) A. K. Drukier, K. Freese and D. N. Spergel, Phys. Rev. D 33, 3495 (1986).
- (12) J. Beringer et al. (Particle Data Group), Phys. Rev. D 86, 010001 (2012).
- (13) S. Di Domizio, F. Orio and M. Vignati, JINST 6, P02007 (2011).
- (14) E. Gatti and P. F. Manfredi, Riv. Nuovo Cimento 9, 1 (1986).
- (15) V. Radeka and N. Karlovac, Nucl. Instrum. Methods 52, 86 (1967).
- (16) F. Alessandria et al., Astropart. Phys. 35, 839 (2012).
- (17) N. Wang et al., Phys. Rev. B 41, 3761 (1990).
- (18) K. M. Itoh et al., Appl. Phys. Lett. 64, 2121 (1994).
- (19) N. F. Mott, Philos. Mag. 19, 835 (1969).
- (20) K. M. Itoh et al., Phys. Rev. Lett. 77, 4058 (1996).
- (21) C. Arnaboldi et al., IEEE T. Nucl. Sci. 49, 2440 (2002).
- (22) A. Alessandrello et al., Nucl. Instrum. Meth. A 412, 454 (1998).
- (23) C. Arnaboldi, G. Pessina and E. Previtali, IEEE T. Nucl. Sci. 50, 979 (2003).
- (24) E. Andreotti et al., Nucl. Instrum. Meth. A 664, 161 (2012).
- (25) S. Pirro, Nucl. Instrum. Meth. A 559, 672 (2006).
- (26) C. Arnaboldi, G. Pessina and S. Pirro, Nucl. Instrum. Meth. A 559, 826 (2006).
- (27) C. Arnaboldi et al., Nucl. Instrum. Meth. A 520, 578 (2004).
- (28) M. Carrettoni and M. Vignati, JINST 6, P08007 (2011).
- (29) S. Ohya, Nucl. Data Sheets 111, 1619 (2010).
- (30) S. Ohya, Nucl. Data Sheets 102, 547 (2004).
- (31) D. Watt and R. Glover, Philos. Mag. 7, 105 (1962).
- (32) D. Munstermann and K. Zuber, J. Phys. G Nucl. Partic. 29, B1 (2003).
- (33) A. Alessandrello et al., Phys. Rev. C 67, 014323 (2003).
- (34) J. Allison et al., IEEE T. Nucl. Sci. 53, 270 (2006).
- (35) G. Jungman, M. Kamionkowski and K. Griest, Phys. Rept. 267, 195 (1996).
- (36) J. D. Lewin and P. F. Smith, Astropart. Phys. 6, 87 (1996).
- (37) A. Alessandrello et al., Phys. Lett. B 408, 465 (1997).
- (38) R. Bernabei et al., Eur. Phys. J. C 56, 333 (2008).
- (39) C. Aalseth et al., Phys. Rev. Lett. 107, 141301 (2011).
- (40) G. Angloher et al., Eur. Phys. J. C 72, 1971 (2012).