Herschel Detection of Dust Emission from UV-Luminous Star-Forming Galaxies at
Abstract
We report the Herschel SPIRE detection of dust emission arising from UV-luminous () star-forming galaxies at . Our sample of 1,913 Lyman Break Galaxy (LBG) candidates is selected over an area of 5.3 deg2 in the Boötes Field of the NOAO Deep Wide-Field Survey. This is one of the largest samples of UV-luminous galaxies at this epoch and enables an investigation of the bright end of the galaxy luminosity function. We divide our sample into three luminosity bins and stack the Herschel SPIRE data to measure the average spectral energy distribution (SED) of LBGs at far-infrared (FIR) wavelengths. We find that these galaxies have average IR luminosities of and % of their star-formation obscured by dust. The FIR SEDs peak at , suggesting dust temperatures () significantly colder than that of local galaxies of comparable IR luminosities. The observed IR-to-UV luminosity ratio () is low () compared with that observed for LBGs (. The correlation between the slope of the UV continuum and IRX for galaxies in the two lower luminosity bins suggests dust properties similar to those of local starburst galaxies. However, the galaxies in the highest luminosity bin appear to deviate from the local relation, suggesting that their dust properties may differ from those of their lower-luminosity and low-redshift counterparts. We speculate that the most UV luminous galaxies at this epoch are being observed in a short-lived and young evolutionary phase.
Subject headings:
galaxies: high-redshift — infrared: galaxies — ISM: dust, extinction1. Introduction
Measurements of the spectral energy distribution (SED) of high-redshift galaxies can provide insight into their constituents (i.e., stars, gas, dust, AGN), star-formation rates (SFRs), and formation history. While high-redshift () star-forming galaxies have been identified in large numbers using rest-frame UV color selection techniques (e.g., Steidel et al., 1996, 2003; Adelberger et al., 2004; Bouwens et al., 2010), their faintness across the electromagnetic spectrum has limited our understanding of their multiwavelength properties. In particular, UV emission is easily extinguished by dust and re-radiated at far-infrared (FIR) wavelengths. Without direct measurements of the FIR emission, the amount of dust extinction and the intrinsic SFRs remain uncertain. Thus far, our understanding of the SFRs largely rests on the assumption that the UV-selected high- galaxies are similar in their dust properties to local starburst galaxies, and specifically that the dust extinction in the UV (as measured by the slope, , of the UV continuum) can be used to predict the infrared luminosity () due to dust emission (e.g., Meurer et al., 1999; Calzetti et al., 2000; Reddy et al., 2008; Finkelstein et al., 2009).
The Spitzer and Herschel777Herschel is an ESA space observatory with science instruments provided by European-led Principal Investigator consortia and with important participation from NASA Space Telescopes have enabled direct measurements of the mid- and FIR emission from distant galaxies and thus a direct test of this assumption. While these telescopes still lack the sensitivity to individually detect any but the most IR-luminous high- galaxies, stacking analyses of UV-selected galaxy samples have resulted in useful constraints (Rigopoulou et al., 2010; Magdis et al., 2010b; Reddy et al., 2012). Several studies of galaxies at (Reddy et al., 2006; Daddi et al., 2007; Magdis et al., 2010a; Reddy et al., 2010, 2012) have demonstrated that the ratio of the average UV continuum slope to the average far-infrared luminosity is similar to that in local starburst galaxies. There are exceptions: most notably, there is evidence that the local - relation may not apply to very dusty, UV-faint galaxies, or to extremely young galaxies (e.g., Goldader et al., 2002; Reddy et al., 2010). Also, the studies thus far are based primarily on galaxy samples with luminosity ranges that do not include large numbers of the most luminous galaxies, and the dependence of the - relation on luminosity is not well understood at high-.
In this paper, we extend this test to higher-redshift and higher-luminosity UV-selected galaxies. We investigate the far-IR properties of a very large sample of galaxies. We stack the Herschel Spectral and Photometric Imaging Receiver (SPIRE: Griffin et al., 2010) observations of this sample and present the first (stacked) detections of the far-IR emission of UV-selected galaxies at this epoch. We use a CDM cosmology with .
2. Data and Galaxy Sample
The datasets used in our analyses are: optical data () in the Boötes field of the NOAO Deep Wide-Field Survey (Jannuzi & Dey, 1999); near-infrared data taken with the NEWFIRM camera (Gonzalez et al., in prep); mid- and far-infrared (3.6–160) data from the Spitzer Infrared Array Camera (IRAC) and the Multiband Imaging Photometer (MIPS) obtained by the Spitzer Deep Wide-Field Survey (Ashby et al., 2009) and the MIPS AGN and Galaxy Evolution Survey (Jannuzi et al., in prep); and far-IR (250–500) Herschel SPIRE observations obtained by the Herschel Multi-tiered Extragalactic Survey (HerMES: Oliver et al., 2012). We reduced and mosaiced the SPIRE data using the Herschel Interactive Processing Environment (HIPE; Ott, 2010), removing striping, astrometry offsets, and glitches missed by the standard pipeline (Alberts et al., in prep). The SPIRE maps include a deep 2 deg2 region surrounded by a shallower outer region. The depths at 250, 350 and 500 are 3, 2, 3 mJy in the inner region and 5, 4, 5 mJy in the outer region respectively.
We use broad-band () color selection to identify sources that exhibit a continuum break between the and bands (Lee et al., 2011). This technique, pioneered by Steidel & Hamilton (1993), successfully identifies UV-emitting star-forming galaxies (also known as Lyman Break Galaxies, or LBGs) which exhibit a strong break in their rest-frame UV spectra at 912Å (the Lyman limit) and additional flux attenuation due to the intervening Lyman alpha forest at Å. Spectroscopic redshifts of 5% of the sample (Lee et al., 2011; Kochanek et al., 2012, Lee et al. 2012, in prep) have confirmed a broad redshift distribution (, ), and a contamination rate of (the limits representing the optimistic/pessimistic scenario based on the nature of the ambiguous spectra). Our final sample consists of 1,913 LBG candidates selected over a contiguous 5.3 deg2 region of the Boötes field (see Lee et al., 2011).
We divide the sample into three bins according to the -band magnitudes as . For reference, the characteristic luminosity at corresponds to (Bouwens et al., 2007). The magnitude bins correspond to overlapping luminosity ranges due to the finite width of the redshift distribution. By using the observed magnitude and redshift distributions of the sample, we find that the magnitude bins correspond to roughly Gaussian bins of , with widths at half-maxima of [2.3], [1.4,2.5], and [0.9,1.5], respectively. We refer to these bins as the “high-”, “intermediate-”, and “low-luminosity” sample. The majority (97%) of galaxies in the high-luminosity bin are . The median UV luminosities of our samples are presented in Table 1.
| Sample | NgalaaThe number of LBGs and the number of LBGs included in the Herschel stacking | bbIn units of | bbIn units of | IRX | SFRUVccIn units of . The Kennicutt (1998) calibration is used assuming the Salpeter IMF (), solar metallicity | SFRIRccIn units of . The Kennicutt (1998) calibration is used assuming the Salpeter IMF (), solar metallicity | |
|---|---|---|---|---|---|---|---|
| =[21.3,23.7] | 325/293 | ||||||
| =[23.7,24.3] | 784/686 | ||||||
| =[24.3,25.0] | 794/694 |
3. Data Stacking
We measured the average optical-to-mid-IR SED of the galaxy samples by using photometry of stacked images in the individual optical, near-IR and IRAC bands. We first convolved all images in a given band to a common point-spread function (PSF), then extracted a cutout centered on each source, subtracted a local sky background, and produced a composite image by taking the median flux over all sources at each pixel position (for further details, see Lee et al., 2011).
The Spitzer MIPS and Herschel data both suffer from large beams and spatial variations in the sensitivity. For the MIPS data, we used a variance-weighted median to account for small-scale variations in the S/N of the images as a function of position. The stacked data only yielded upper limits. The limits, measured in apertures of diameter , , (matched to the full-width-at-half-maximum of the PSFs in the , and images, respectively) are presented in Table 2.
The HerMES SPIRE data only cover a portion of our field, and sample 1673 LBGs (i.e., 85%). Thirty five (2%) LBGs have a 250 detection () within 8″; 33 of these have more than one optical counterpart in the beam. Of these, only two sources exhibit increasing flux densities towards longer wavelengths, as would be expected for galaxies (sampling the Wien side of the dust emission). However, both have another optical counterpart other than the LBG candidate within the beam, making it uncertain whether the far-IR emission is uncontaminated. We therefore assumed that the detected sources are contaminated by unresolved interlopers, and excluded all 35 sources from the stacking. We stacked the SPIRE data by calculating the variance-weighted average flux. The measurement significance was determined using a bootstrap resampling technique (e.g., Press et al., 1992). We measured the flux using 10,000 random samples of the source list (replacing chosen sources each time) and measured the RMS from the resulting flux distribution. Our results are presented in Table 2. For completeness, we repeated our analyses with and without the 250 detected sources; the differences are within the uncertainties.
High-redshift submillimeter galaxies are known to be strongly clustered (Blain et al., 2004; Hickox et al., 2012) and are often found in close proximity to LBGs (Chapman et al., 2009). The large SPIRE beam could be contaminated by such sources. In order to estimate the degree of contamination, we used the substantially deeper 24 MIPS data and measured photometry in large apertures matched to the SPIRE beamsize. We carried out this measurement at both on-source (LBGs) and random sky positions. We found that (1) there is no significant difference between the on-source and sky distributions, and (2) the distributions are similar at both the 250 and 500 beamsizes. This suggests that the contribution of clustered sources to the flux measured for the LBGs is small. Therefore, our stacked fluxes likely represent the FIR emission from a typical LBG.
| Sample 1 | Sample 2 | Sample 3 | |
|---|---|---|---|
| =[21.3,23.7] | =[23.7,24.3] | =[24.3,24.7] | |
.
4. Results and Discussion
4.1. The Panchromatic View of UV-Luminous Star-Forming Galaxies at
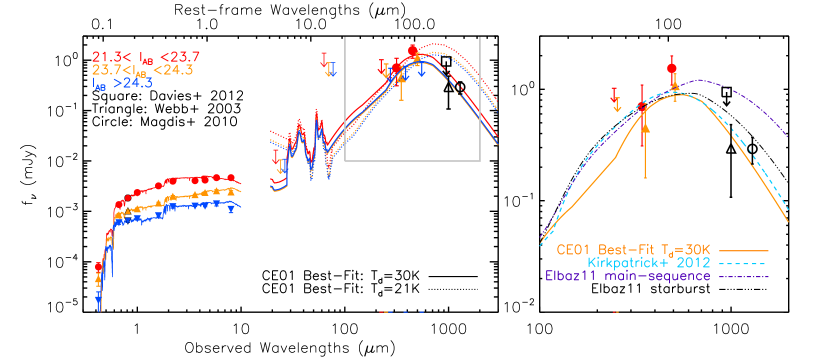
Figure 1 shows the stacked SEDs of the LBGs in the three magnitude bins. At , the SEDs show similar shapes, with two noticeable differences. First, the UV continuum slope ( measured at =1300-3000Å) increases with luminosity from (low-luminosity bin) to (high-luminosity bin). Shifting the median redshift changes the level of intergalactic attenuation and but does not impact the observed colors significantly (e.g., would result in ). Second, the break observed between and decreases in strength with increasing luminosity. If this is the Balmer break, the trend suggests that galaxies in the high-luminosity bin are, on average, younger than their lower luminosity counterparts (e.g., Bruzual & Charlot, 1993).
In the far-IR, only the intermediate- and high-luminosity bins show detections in the 350 and 500 SPIRE bands. To measure the total IR luminosities, we modeled the SEDs using the templates of Chary & Elbaz (2001, hereafter CE01). The CE01 templates are designed to match the SEDs of present-day IR-luminous galaxies and to reproduce the observed local correlation between dust temperature () and IR luminosity. If we only use CE01 templates that correspond to the observed IR luminosity ranges, the resulting fits are poor (; 90% confidence). This is primarily because the observed SEDs of our samples peak at longer wavelengths than those of local galaxies of comparable IR luminosities. The longer peak wavelength observed for our galaxies may suggest that galaxies at have colder dust than local galaxies at similar IR luminosities. Similar results have been found for various types of high-redshift () galaxies (Pope et al., 2006; Dannerbauer et al., 2010; Muzzin et al., 2010; Elbaz et al., 2011; Kirkpatrick et al., 2012).
To account for possible redshift evolution of IR SEDs, we fit all the CE01 templates leaving the normalization as a free parameter, effectively eliminating the local - correlation from the fitting procedure. The upper limits were included in the calculation only when the model exceeds the limit. For the low-luminosity bin with no Herschel detection, we determined the upper limit on the IR luminosity using the best-fit templates of the two other bins. The total IR luminosities (: integrated between ) are computed by integrating the scaled best-fit CE01 template. Typically, for the best-fit models.
We find values of , , and , in the order of decreasing UV luminosities (Table 1). Despite the uncertainties, a clear trend emerges: more UV-luminous galaxies are also more IR-luminous. The main source of uncertainty is the peak location of dust emission (and therefore ). The lower limit corresponds to K (modeled as a grey-body function where is the Planck function, =1.5 is the dust emissivity). The upper limit is set by the coldest CE01 template (K).
As all SPIRE bands lie at shorter wavelengths than the FIR peak at , we are unable to constrain the SED shape from our data alone. However, it is instructive to consider the existing measurements at longer wavelengths on other UV-selected LBG samples at . At Webb et al. (2003) reported a detection at 850 (using SCUBA) for LBGs, while Magdis et al. (2010a) found a detection at 1.1mm (using AzTEC) of IRAC-detected LBGs. At , Davies et al. (2012) determined a upper limit of 1.6 mJy at 1.2mm (using MAMBO). In Figure 1, we show these points after correcting the wavelengths and flux densities to . Even though the different selection methods and redshift ranges of these studies make direct comparisons difficult, the measurements still provide a useful constraint on the SED, preferring a peak wavelength near . The inferred dust temperature is K. When compared to recent Herschel-based templates, the combined FIR constraints are in good agreement with the star-forming template of Kirkpatrick et al. (2012) and the starburst template of Elbaz et al. (2011). The main-sequence Elbaz template is ruled out () as it predicts higher flux densities in the sub-mm/mm wavelengths (see Kirkpatrick et al., 2012, for further discussion). Further constraints can be easily obtained by ALMA. Our best-fit model for the LBGs predicts the flux densities of 0.83 (0.51) mJy in the , which, according to the ALMA Sensitivity Calculator, can be detected () in 2.1 hr (5.6 min).
4.2. Dust-Obscured Star Formation
Having measured the IR luminosity of the LBG samples, we now compare the relative energy budget of star-formation in the UV and infrared. For each bin, we estimate the luminosity ratio IRX assuming two dust temperatures, K and 21K (see Table 1). In all luminosity bins, the IRX remains relatively low at , implying % of the star formation in these LBGs is obscured by dust. The IRX is weaker than that observed at (80%: Reddy et al., 2012), suggesting the buildup of dust with cosmic time as low-mass stars continue to evolve into the AGB phase (e.g., Bouwens et al., 2009).
Next, we investigate how dust extinction inferred from the UV compares with dust emission in the IR. Meurer et al. (1999) derived the scaling law between dust extinction and the UV slope based on the observed correlation for local starbursts. Such a correlation is explained if local starburst galaxies are governed by the Calzetti et al. (2000) extinction law, which gives a flatter attenuation curve than that found for the Large and Small Magellanic Clouds Fitzpatrick (1986); Bouchet et al. (1985).
At , Reddy et al. (2010, 2012) found that most UV-selected star-forming galaxies follow the local IRX- relation, demonstrating that the dust properties and relative geometry between dust and stars within the star-forming galaxies are similar to those in local starbursts (see also Nandra et al., 2002; Daddi et al., 2007; Magdis et al., 2010a). However, there are also exceptions: several galaxies lie off this relation (Reddy et al 2006, 2012; Siana et al. 2008, 2009) and are interpreted as being very young (100 Myr).
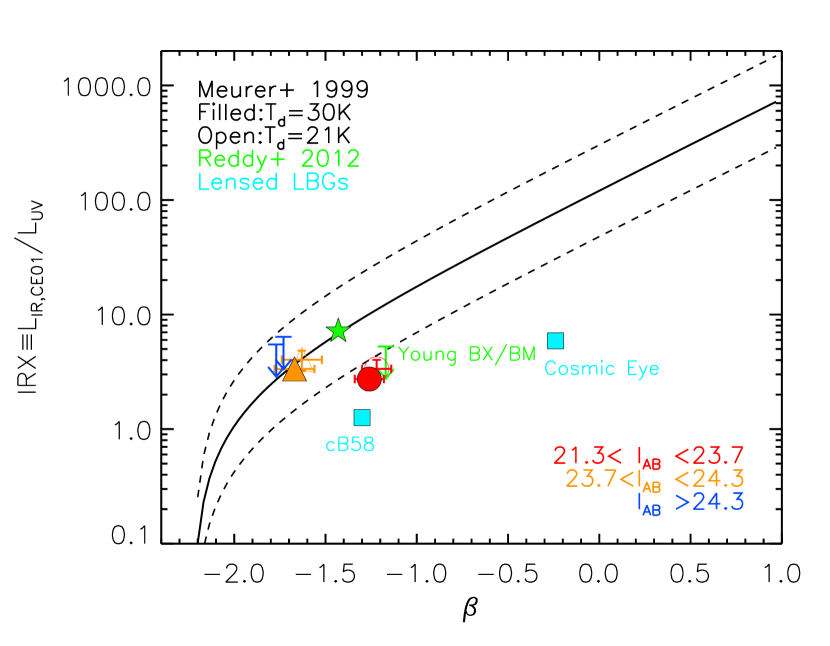
Figure 2 shows the locations of the three LBG subsamples on the IRX- plane and the local relation of Meurer et al. (1999)111The correlation is scaled by 0.24 dex to match our definition of as IR luminosity integrated at from that of Meurer et al. (1999, at ) . For comparison, we also show the locations of the galaxies of Reddy et al. (2012) and two lensed galaxies (the Cosmic Eye and MS1512-cB58: Siana et al., 2008, 2009). The galaxies in the intermediate-luminosity bin closely trace the local relation. The upper limits for our low-luminosity sample are also consistent with the local relation. Hence, our results suggest that the dust properties in the LBGs at are similar to those of local starbursts.
The high-luminosity bin lies significantly (0.5 dex) below the Meurer relation, closer to the location of the young galaxies (Reddy et al., 2012). The observed offset suggests that the dust properties of the galaxies in the high-luminosity bin may be different from those of their lower-luminosity counterparts. Also, since the values for these galaxies cannot predict the using the local IRX- relation, it implies that SFRs derived from the UV using the standard relationship overpredict the true SFR in these systems. The impact of this result on the total cosmic SFR density is minimal. Nevertheless, the offset in the IRX- plane has interesting implications for the evolutionary state of these high-luminosity galaxies.
The high-luminosity LBGs appear to have a weaker Balmer break than those in less-luminous bins, implying that they may have younger population ages. Reddy et al. (2010, 2012) made similar observations that galaxies with ages Myr have lower IRX values. This offset suggests that the most UV-luminous galaxies may be undergoing a short evolutionary phase during which the dust covering fraction and/or the dust grain size distribution is different than that in their less luminous counterparts (Siana et al. 2009, Reddy et al. 2010).
The statistics from the existing spectroscopy supports the possibility that a large dust covering fraction may be suppressing the emergence of Ly photons in the most UV-luminous galaxies. Of the 13 galaxies at , none has strong Ly emission (rest-frame equivalent width 20Å). In contrast, 12/30 galaxies at have Å. While the spectroscopic confirmation of the fainter LBGs may be biased toward the stronger Ly emitters, the lack of Ly emission among the most UV-luminous galaxies is significant (see Stark et al., 2010; Kornei et al., 2010).
The suggested luminosity-age relation we observe in the LBGs is not observed for galaxies as the median luminosity of their youngest (IRX-outlier) population is similar to that of the overall sample. However, the luminosity range of our high-luminosity sample is not well represented in the Reddy et al. sample. It is also possible that our results may have been influenced by sample contamination. Interlopers such as dusty low-redshift () galaxies or low-luminosity quasars could simulate a smaller Balmer break and depressed FIR flux. Based on our DEIMOS spectroscopy, the contamination rate in the high-luminosity bin is 15%, slightly higher than that of the full sample (%). Even if the FIR flux is zero for the interlopers, the resulting UV flux correction to the IRX would be insufficient to explain the observed offset in Figure 2. If the low-redshift interlopers contribute disproportionately to the measured average IR flux, the true IRX offset of our high-luminosity LBGs from the Meurer relation would be even larger than observed. Spectroscopic confirmation of a larger number of candidates can place more stringent limits on the interloper populations, and also allow the stacking of confirmed LBGs.
References
- Adelberger et al. (2004) Adelberger, K. L., Steidel, C. C., Shapley, A. E., et al. 2004, ApJ, 607, 226
- Ashby et al. (2009) Ashby et al. 2009, ApJ, 701, 428
- Blain et al. (2004) Blain, A. W., Chapman, S. C., Smail, I., & Ivison, R. 2004, ApJ, 611, 725
- Bouchet et al. (1985) Bouchet, P., Lequeux, J., Maurice, E., Prevot, L., & Prevot-Burnichon, M. L. 1985, A&A, 149, 330
- Bouwens et al. (2007) Bouwens, R. J., Illingworth, G. D., Franx, M., & Ford, H. 2007, ApJ, 670, 928
- Bouwens et al. (2009) Bouwens, R. J., Illingworth, G. D., Franx, M., Chary, R., Meurer, G. R., Conselice, C. J., Ford, H., Giavalisco, M., & van Dokkum, P. 2009, ApJ, 705, 936
- Bouwens et al. (2010) Bouwens, R. J., Illingworth, G. D., Oesch, P. A., Stiavelli, M., van Dokkum, P., Trenti, M., Magee, D., Labbé, I., Franx, M., Carollo, C. M., & Gonzalez, V. 2010, ApJ, 709, L133
- Bruzual & Charlot (1993) Bruzual A., G., & Charlot, S. 1993, ApJ, 405, 538
- Calzetti (1997) Calzetti, D. 1997, AJ, 113, 162
- Calzetti et al. (2000) Calzetti, D., Armus, L., Bohlin, R. C., Kinney, A. L., Koornneef, J., & Storchi-Bergmann, T. 2000, ApJ, 533, 682
- Chapman et al. (2009) Chapman, S. C., Blain, A., Ibata, R., Ivison, R. J., Smail, I., & Morrison, G. 2009, ApJ, 691, 560
- Chary & Elbaz (2001) Chary, R. & Elbaz, D. 2001, ApJ, 556, 562
- Daddi et al. (2007) Daddi et al. 2007, ApJ, 670, 156
- Dannerbauer et al. (2010) Dannerbauer et al. 2010, ApJ, 720, L144
- Davies et al. (2012) Davies, L. J. M., Bremer, M. N., Stanway, E. R., Mannering, E., Lehnert, M. D., & Omont, A. 2012, ArXiv e-prints
- Elbaz et al. (2011) Elbaz et al. 2011, A&A, 533, A119+
- Finkelstein et al. (2009) Finkelstein, S. L., Malhotra, S., Rhoads, J. E., Hathi, N. P., & Pirzkal, N. 2009, MNRAS, 393, 1174
- Fitzpatrick (1986) Fitzpatrick, E. L. 1986, AJ, 92, 1068
- Goldader et al. (2002) Goldader, J. D., Meurer, G., Heckman, T. M., Seibert, M., Sanders, D. B., Calzetti, D., & Steidel, C. C. 2002, ApJ, 568, 651
- Griffin et al. (2010) Griffin, M. J., Abergel, A., Abreu, A., et al. 2010, A&A, 518, L3
- Hickox et al. (2012) Hickox et al. 2012, MNRAS, 421, 284
- Jannuzi & Dey (1999) Jannuzi, B. T. & Dey, A. 1999, in Astronomical Society of the Pacific Conference Series, 111
- Kennicutt (1998) Kennicutt, Jr., R. C. 1998, ARA&A, 36, 189
- Kirkpatrick et al. (2012) Kirkpatrick et al., 2012, Accepted for publication in ApJ
- Kochanek et al. (2012) Kochanek et al. 2012, ApJS, 200, 8
- Kornei et al. (2010) Kornei, K. A., Shapley, A. E., Erb, D. K., Steidel, C. C., Reddy, N. A., Pettini, M., & Bogosavljević, M. 2010, ApJ, 711, 693
- Lee et al. (2011) Lee, K.-S., Dey, A., Reddy, N., Brown, M. J. I., Gonzalez, A. H., Jannuzi, B. T., Cooper, M. C., Fan, X., Bian, F., Glikman, E., Stern, D., Brodwin, M., & Cooray, A. 2011, ApJ, 733, 99
- Magdis et al. (2010a) Magdis, G. E., Elbaz, D., Daddi, E., Morrison, G. E., Dickinson, M., Rigopoulou, D., Gobat, R., & Hwang, H. S. 2010a, ApJ, 714, 1740
- Magdis et al. (2010b) Magdis et al. 2010b, ApJ, 720, L185
- Meurer et al. (1999) Meurer, G. R., Heckman, T. M., & Calzetti, D. 1999, ApJ, 521, 64
- Muzzin et al. (2010) Muzzin, A., van Dokkum, P., Kriek, M., Labbé, I., Cury, I., Marchesini, D., & Franx, M. 2010, ApJ, 725, 742
- Nandra et al. (2002) Nandra, K., Mushotzky, R. F., Arnaud, K., Steidel, C. C., Adelberger, K. L., Gardner, J. P., Teplitz, H. I., & Windhorst, R. A. 2002, ApJ, 576, 625
- Oliver et al. (2012) Oliver et al. 2012, ArXiv e-prints
- Ott (2010) Ott, S. 2010, Astronomical Data Analysis Software and Systems XIX, 434, 139
- Pilbratt et al. (2010) Pilbratt, G. L., Riedinger, J. R., Passvogel, T., Crone, G., Doyle, D., Gageur, U., Heras, A. M., Jewell, C., Metcalfe, L., Ott, S., & Schmidt, M. 2010, A&A, 518, L1
- Pope et al. (2006) Pope, A., Scott, D., Dickinson, M., Chary, R.-R., Morrison, G., Borys, C., Sajina, A., Alexander, D. M., Daddi, E., Frayer, D., MacDonald, E., & Stern, D. 2006, MNRAS, 370, 1185
- Press et al. (1992) Press, W. H., Teukolsky, S. A., Vetterling, W. T., & Flannery, B. P. 1992, Cambridge: University Press, —c1992, 2nd ed.,
- Reddy et al. (2012) Reddy, N., Dickinson, M., Elbaz, D., Morrison, G., Giavalisco, M., Ivison, R., Papovich, C., Scott, D., Buat, V., Burgarella, D., Charmandaris, V., Daddi, E., Magdis, G., Murphy, E., Altieri, B., Aussel, H., Dannerbauer, H., Dasyra, K., Hwang, H. S., Kartaltepe, J., Leiton, R., Magnelli, B., & Popesso, P. 2012, ApJ, 744, 154
- Reddy et al. (2010) Reddy, N. A., Erb, D. K., Pettini, M., Steidel, C. C., & Shapley, A. E. 2010, ApJ, 712, 1070
- Reddy et al. (2006) Reddy, N. A., Steidel, C. C., Fadda, D., Yan, L., Pettini, M., Shapley, A. E., Erb, D. K., & Adelberger, K. L. 2006, ApJ, 644, 792
- Reddy et al. (2008) Reddy, N. A., Steidel, C. C., Pettini, M., et al. 2008, ApJS, 175, 48
- Rigopoulou et al. (2010) Rigopoulou et al., 2010, MNRAS, 409, L7
- Siana et al. (2009) Siana, B., Smail, I., Swinbank, A. M., Richard, J., Teplitz, H. I., Coppin, K. E. K., Ellis, R. S., Stark, D. P., Kneib, J.-P., & Edge, A. C. 2009, ApJ, 698, 1273
- Siana et al. (2008) Siana, B., Teplitz, H. I., Chary, R.-R., Colbert, J., & Frayer, D. T. 2008, ApJ, 689, 59
- Stark et al. (2010) Stark, D. P., Ellis, R. S., Chiu, K., Ouchi, M., & Bunker, A. 2010, MNRAS, 408, 1628
- Steidel & Hamilton (1993) Steidel, C. C. & Hamilton, D. 1993, AJ, 105, 2017
- Steidel et al. (1996) Steidel, C. C., Giavalisco, M., Pettini, M., Dickinson, M., & Adelberger, K. L. 1996, ApJ, 462, L17
- Steidel et al. (2003) Steidel, C. C., Adelberger, K. L., Shapley, A. E., et al. 2003, ApJ, 592, 728
- Webb et al. (2003) Webb, T. M. et al. 2003, ApJ, 582, 6