Submillimetre galaxies in a hierarchical universe: number counts, redshift distribution, and implications for the IMF
Abstract
High-redshift submillimetre galaxies (SMGs) are some of the most rapidly star-forming galaxies in the Universe. Historically, galaxy formation models have had difficulty explaining the observed number counts of SMGs. We combine a semi-empirical model with 3-D hydrodynamical simulations and 3-D dust radiative transfer to predict the number counts of unlensed SMGs. Because the stellar mass functions, gas and dust masses, and sizes of our galaxies are constrained to match observations, we can isolate uncertainties related to the dynamical evolution of galaxy mergers and the dust radiative transfer. The number counts and redshift distributions predicted by our model agree well with observations. Isolated disc galaxies dominate the faint ( mJy, or mJy) population. The brighter sources are a mix of merger-induced starbursts and galaxy-pair SMGs; the latter subpopulation accounts for per cent of all SMGs at all mJy ( mJy). The mean redshifts are , depending on the flux cut, and the brightest sources tend to be at higher redshifts. Because the galaxy-pair SMGs will be resolved into multiple fainter sources by ALMA, the bright ALMA counts should be as much as 2 times less than those observed using single-dish telescopes. The agreement between our model, which uses a Kroupa IMF, and observations suggests that the IMF in high-redshifts starbursts need not be top-heavy; if the IMF were top-heavy, our model would over-predict the number counts. We conclude that the difficulty some models have reproducing the observed SMG counts is likely indicative of more general problems – such as an under-prediction of the abundance of massive galaxies or a star formation rate–stellar mass relation normalisation lower than that observed – rather than a problem specific to the SMG population.
keywords:
galaxies: high-redshift – galaxies: starburst – infrared: galaxies – radiative transfer – stars: luminosity function, mass function – submillimetre: galaxies.1 Introduction
Submillimetre galaxies (SMGs; Smail et al. 1997; Barger et al. 1998; Hughes et al. 1998; Eales et al. 1999; see Blain et al. 2002 for a review) are amongst the most luminous, rapidly star-forming galaxies known, with luminosities in excess of and star formation rates (SFR) of order (e.g., Kovács et al., 2006; Coppin et al., 2008; Michałowski et al., 2010, 2012; Magnelli et al., 2010, 2012; Chapman et al., 2010). They have stellar masses of , although recent estimates (Hainline et al., 2011; Michałowski et al., 2010, 2012) differ by a factor of , and typical gas fractions of per cent (Greve et al. 2005; Tacconi et al. 2006, 2008; but cf. Narayanan, Bothwell, & Davé 2012a).
The most luminous local galaxies, ultra-luminous infrared galaxies (ULIRGs, defined by ), are almost exclusively late-stage major mergers (e.g., Lonsdale et al., 2006) because the strong tidal torques exerted by the galaxies upon one another when they are near coalescence cause significant gas inflows and, consequently, bursts of star formation (e.g., Hernquist, 1989; Barnes & Hernquist, 1991, 1996; Mihos & Hernquist, 1996). Thus, it is natural to suppose that SMGs, which are the most luminous, highly star-forming galaxies at high redshift, are also late-stage major mergers undergoing starbursts. There is significant observational support for this picture (e.g., Ivison et al., 2002, 2007, 2010; Chapman et al., 2003; Neri et al., 2003; Smail et al., 2004; Swinbank et al., 2004; Greve et al., 2005; Tacconi et al., 2006, 2008; Bouché et al., 2007; Biggs & Ivison, 2008; Capak et al., 2008; Younger et al., 2008, 2010; Iono et al., 2009; Engel et al., 2010; Bothwell et al., 2010, 2012; Riechers et al., 2011a, b; Magnelli et al., 2012). However, there may not be enough major mergers of galaxies of the required masses to account for the observed SMG abundances (Davé et al., 2010). Consequently, explaining the abundance of SMGs has proven to be a challenge for galaxy formation models.
Much observational effort has been invested to determine the number counts and redshift distribution of SMGs (e.g., Chapman et al., 2005; Coppin et al., 2006; Knudsen et al., 2008; Chapin et al., 2009; Weiß et al., 2009; Austermann et al., 2009, 2010; Scott et al., 2010; Zemcov et al., 2010; Aretxaga et al., 2011; Banerji et al., 2011; Hatsukade et al., 2011; Wardlow et al., 2011; Roseboom et al., 2012; Yun et al., 2012) because this information is key to relate the SMG population to their descendants and to understand SMGs in the context of hierarchical galaxy formation models. Various authors have attempted to explain the observed abundance of SMGs using phenomenological models (e.g., Pearson & Rowan-Robinson, 1996; Blain et al., 1999b; Devriendt & Guiderdoni, 2000; Lagache et al., 2003; Negrello et al., 2007; Béthermin et al., 2012), semi-analytic models (SAMs; e.g., Guiderdoni et al., 1998; Blain et al., 1999a; Granato et al., 2000; Kaviani et al., 2003; Granato et al., 2004; Baugh et al., 2005; Fontanot et al., 2007; Fontanot & Monaco, 2010; Lacey et al., 2008, 2010; Swinbank et al., 2008; Lo Faro et al., 2009; González et al., 2011), and cosmological hydrodynamical simulations (Fardal et al., 2001; Dekel et al., 2009; Davé et al., 2010; Shimizu et al., 2012).
Granato et al. (2000) presented one of the first SAMs to self-consistently calculate dust absorption and emission by coupling the Galform SAM (Cole et al., 2000) with the Grasil spectrophotometric code (Silva et al., 1998). This was a significant advance over previous work, which effectively treated the dust temperature as a free parameter. Self-consistently computing dust temperatures made matching the submm counts significantly more difficult: the submm counts predicted by the Granato et al. model were a factor of less than those observed (Baugh et al., 2005; Swinbank et al., 2008).
The work of Baugh et al. (2005, hereafter B05) has attracted significant attention to the field because of its claim that a flat IMF is necessary to reproduce the properties of the SMG population, which we will discuss in detail here. B05 set out to modify the Granato et al. (2000) model so that it would reproduce the properties of both SMGs and Lyman-break galaxies (LBGs) while also matching the observed optical and IR luminosity functions. Adopting a flat IMF111Specifically, the IMF they use is constant for the mass range . The Kroupa (2001) IMF has for , so the difference between the B05 IMF and that observed locally is considerable. in starbursts rather than the Kennicutt (1983) IMF used in Granato et al. (2000) was the key change that enabled B05 to match the observed SMG counts and redshift distribution while still reproducing the local -band luminosity function. A more top-heavy IMF results in both more luminosity emitted and more dust produced per unit SFR; consequently, the submm flux per unit SFR is increased significantly (see B05 and Hayward et al. 2011a, hereafter H11, for details). The B05 modifications increased the per unit SFR for starbursts by a factor of (G.-L. Granato, private communication), which caused starbursts to account for a factor of times more sources at mJy than in Granato et al. (2000). As a result, in the B05 model, ongoing starbursts dominate the counts for mJy. Interestingly, these starbursts are triggered predominantly by minor mergers (B05; González et al., 2011). Swinbank et al. (2008) present a detailed comparison of the properties of SMGs in the B05 model with those of observed SMGs. The far-IR SEDs, velocity dispersions, and halo masses (see also Almeida et al. 2011) are in good agreement; however, recent observations suggest that the typical redshift of SMGs may be higher than predicted by the B05 model and, contrary to the B05 prediction, brighter SMGs tend to be at higher redshifts (Yun et al., 2012; Smolčić et al., 2012). Furthermore, the rest-frame -band fluxes of the B05 SMGs are a factor of lower than observed; the most plausible explanation is that the masses of the SMGs in the B05 SAM are too low (Swinbank et al., 2008), but the top-heavy IMF in starbursts used by B05 makes a direct comparison of masses difficult. These disagreements are reasons it is worthwhile to explore alternative SMG models.
Granato et al. (2004) presented an alternate model, based on spheroid formation via monolithic collapse, that predicts submm counts in good agreement with those observed and reproduces the evolution of the -band luminosity function. However, the typical redshift they predict for SMGs is lower than recent observational constraints (Yun et al., 2012; Smolčić et al., 2012), and this model does not include halo or galaxy mergers.
The Fontanot et al. (2007) model predicts SMG number counts in reasonable agreement with those observed using a standard IMF; they argue that the crucial difference between their model and that of B05 is the cooling model used (see also Viola et al. 2008 and De Lucia et al. 2010). However, their SMG redshift distribution peaks at a lower redshift than the redshift distribution derived from recent observations (Yun et al., 2012; Smolčić et al., 2012). Furthermore, the Fontanot et al. (2007) model produces an overabundance of bright galaxies at . However, this problem has been significantly reduced in the latest version of the model (Lo Faro et al., 2009), which provides a significantly better fit to the galaxy stellar mass function at low redshift (Fontanot et al., 2009). In the revised model, the submm counts are reduced by dex, primarily because of the change in the IMF from Salpeter to Chabrier, but the redshift distribution is unaffected. Thus, the submm counts for the new model are consistent with the data for mJy, but they are slightly less than the observed counts at higher fluxes (Fontanot & Monaco, 2010). No fine-tuning of the dust parameters has been performed for the new model.
A compelling reason to model the SMG population in an alternative manner is to test whether a top-heavy IMF is required to explain the observed SMG counts. Matching the submm counts is the primary reason B05 needed to adopt a flat IMF in starbursts.222Recent observations suggest the number counts are as much as a factor of 2 lower than those used by B05. Thus, if Baugh et al. were to attempt to match the revised counts, the required IMF variation would be more modest. Using the same model, Lacey et al. (2008) show that the flat IMF is necessary to reproduce the evolution of the mid-IR luminosity function. Others (e.g., Guiderdoni et al., 1998; Blain et al., 1999a; Davé et al., 2010) have also suggested that the IMF may be top-heavy in SMGs, but they do not necessarily require variation as extreme as that assumed in B05. However, the use of a flat IMF in starbursts remains controversial: though there are some theoretical reasons to believe the IMF is more top-heavy in starbursts (e.g., Larson, 1998, 2005; Elmegreen & Shadmehri, 2003; Elmegreen, 2004; Hopkins, 2012; Narayanan & Davé, 2012), there is to date no clear evidence for strong, systematic IMF variation in any environment (Bastian et al. 2010 and references therein). Furthermore, in local massive ellipticals, the probable descendants of SMGs, the IMF may actually be bottom-heavy (e.g., van Dokkum & Conroy, 2010, 2011; Conroy & van Dokkum, 2012; Hopkins, 2012). Finally, the large parameter space of SAMs can yield multiple qualitatively distinct solutions that satisfy all observational constraints (Bower et al., 2010; Lu et al., 2011, 2012), so it is possible that a top-heavy IMF in starbursts is not required to match the observed submm counts even though it enables B05 to match the submm counts.333However, whether a unique solution, if any solution at all, can be found when all possible observational constraints are included is an open question. Thus, it is useful to explore other methods to predict the submm counts and to determine whether a match can be achieved without using a top-heavy IMF.
Another reason to model the SMG population is to investigate whether, like local ULIRGs, they are predominantly merger-induced starbursts. Some observational evidence suggests that some SMGs may be early-stage mergers in which the discs have not yet coalesced and are likely not undergoing starbursts (e.g., Tacconi et al., 2006, 2008; Engel et al., 2010; Bothwell et al., 2010; Riechers et al., 2011a, b), and massive isolated disc galaxies may also contribute to the population (e.g., Bothwell et al., 2010; Carilli et al., 2010; Ricciardelli et al., 2010; Targett et al., 2011, 2012) In H11 and H12, we suggested that the inefficient scaling of (sub)mm flux with SFR in starbursts results in an SMG population that is heterogeneous: major mergers contribute both as coalescence-induced starbursts and during the pre-coalescence infall stage, when the merging discs are blended into one (sub)mm source because of the large (”, or kpc at ) beams of the single-dish (sub)mm telescopes used to perform large SMG surveys. We refer to the latter subpopulation as ‘galaxy-pair SMGs’. Similarly, compact groups may be blended into one source and can thus also contribute to the population. The most massive, highly star-forming isolated discs may also contribute (H11). Finally, it has been observationally demonstrated that there is a contribution from physically unrelated galaxies blended into one source (Wang et al., 2011). It is becoming increasingly clear that the SMG population is a mix of various classes of sources; if one subpopulation does not dominate the population, physically interpreting observations of SMGs is significantly more complicated than previously assumed.
In previous work, we demonstrated that major mergers can reproduce the observed 850-µm fluxes and typical SED (Narayanan et al., 2010b); CO spatial extents, line-widths, and excitation ladders (Narayanan et al., 2009); stellar masses (Narayanan et al. 2010b; H11; Michałowski et al. 2012); –effective dust temperature relation, IR excess, and star formation efficiency (Hayward et al., 2012, hereafter H12) observed for SMGs. In this work, we present a novel method to predict the (sub)mm counts from mergers and quiescently star-forming disc galaxies. We utilise a combination of 3-D hydrodynamical simulations, on which we perform radiative transfer in post-processing to calculate the UV-to-mm SEDs, and a semi-empirical model (SEM) of galaxy formation – both of which have been extensively validated in previous work – to predict the number counts and redshift distribution of SMGs in our model. We address four primary questions: 1. Can our model reproduce the observed SMG number counts and redshift distribution? 2. What are the relative contributions of merger-induced starbursts, galaxy pairs, and isolated discs to the SMG population? 3. How will the number counts and redshift distribution of ALMA-detected SMGs differ from those determined using single-dish surveys? 4. Does the SMG population provide evidence for a top-heavy IMF in high-redshift starbursts?
The remainder of this paper is organised as follows: In Section 3, we present the details of the simulations we use to determine the time evolution of galaxy mergers and to translate physical properties of model galaxies into observed-frame (sub)mm flux densities. In Section 4, we discuss how we combine the simulations with a SEM to predict the (sub)mm counts for merger-induced starburst SMGs (Section 4.1) and isolated disc and galaxy-pair SMGs (Section 4.2). In Section 5, we present the predicted counts and redshift distribution of our model SMGs and the relative contribution of each subpopulation. We discuss implications for the IMF, compare to previous work, and highlight some uncertainties in and limitations of our model in Section 6, and we conclude in Section 7.
2 Summary of the model
Predicting SMG counts requires three main ingredients: 1. Because SFR and dust mass are the most important properties for predicting the (sub)mm flux of a galaxy (H11), one must model the time evolution of those properties for individual discs and mergers. 2. The physical properties of the model galaxies must be used to determine the observed-frame (sub)mm flux density of those galaxies. 3. One must put the model galaxies in a cosmological context. Ideally, one could combine a cosmological hydrodynamical simulation with dust radiative transfer to self-consistently predict the (sub)mm counts. However, this is currently infeasible because the resolution required for reliable radiative transfer calculations cannot be achieved for a cosmological simulation large enough to contain a significant number of SMGs (see, e.g., Davé et al. 2010).444Recently, Shimizu et al. (2012) predicted SMG number counts using a cosmological simulation with a self-consistent model to calculate the far-IR emission. However, their model assumes a single dust temperature and neglects dust self-absorption, so the submm fluxes predicted by their model may be significantly ( dex) greater those calculated using full 3-D dust radiative transfer (H11). An investigation of the effects of this uncertainty on the predicted counts is underway.
[ caption = Summary of methods, center, star ]llll \FLIngredient & Isolated discs Early-stage mergers Merger-induced starbursts \MLPhysical properties semi-empirical semi-empirical simulations \NN(Sub)mm flux density H11 relations H11 relations simulations \NNCosmological context observed SMF merger rates from SEM merger rates from SEM \NN + duty cycle from sims + duty cycle from sims \LL
Here, we develop a novel method to predict the number counts and redshift distribution of high-z SMGs while still resolving the dusty ISM on scales of pc. We predict (sub)mm counts using a combination of a simple SEM (Hopkins et al., 2008a, c) and idealised high-resolution simulations of galaxy mergers. The method we use for each of the three model ingredients depends on the subpopulation being modelled. The physical properties of the isolated disc galaxies and early-stage mergers are determined using the SEM. For the late-stage mergers, hydrodynamical simulations are used because of the complexity of modelling a merger’s evolution. Dust radiative transfer is performed on the hydrodynamical simulations to translate the physical properties into observed (sub)mm flux density. For the isolated discs and early-stage mergers, fitting functions derived from the simulations are used, whereas for the late-stage mergers, the (sub)mm light curves are taken directly from the simulations. Finally, the isolated galaxies are put in a cosmological context using an observed stellar mass function (SMF). For the mergers, merger rates from the SEM and duty cycles from the simulations are used. The methods are summarised in Table 2, and each component of the model is discussed in detail below.
We emphasize that we do not attempt to model the SMG population in an ab initio manner. Instead, we construct our model so that the SMF, gas fractions, and metallicities are consistent with observations. This will enable us to test whether, given a demographically accurate galaxy population, we are able to reproduce the SMG counts and redshift distribution. If we are not able to reproduce the counts and redshift distribution, then our simulations or radiative transfer calculations must be incomplete. If we can reproduce the counts and redshift distribution, then it is possible that the failure of some SAMs and cosmological simulations to reproduce the SMG counts may be indicative of a more general problem with those models (e.g., a general under-prediction of the abundances of massive galaxies) rather than a problem specific to the SMG population.
In the next two sections, we describe our model in detail. Readers whom are uninterested in the details of the methodology may wish to skip to Section 5.
3 Simulation methodology
3.1 Hydrodynamical simulations
We have performed a suite of simulations of isolated and merging disc galaxies with Gadget-2 (Springel et al., 2001; Springel, 2005), a TreeSPH (Hernquist & Katz, 1989) code that computes gravitational interactions via a hierarchical tree method (Barnes & Hut, 1986) and gas dynamics via smoothed-particle hydrodynamics (SPH; Lucy, 1977; Gingold & Monaghan, 1977; Springel, 2010).555Recently, some authors (Agertz et al., 2007; Springel, 2010; Bauer & Springel, 2012; Sijacki et al., 2012) have noted several significant flaws inherent in the traditional formulation of SPH, including the artificial suppression of fluid instabilities, artificial damping of turbulent eddies in the subsonic regime, and a lack of efficient gas stripping of infalling structures. Consequently, the results of cosmological simulations performed using Gadget-2 can differ significantly from those performed with the more accurate moving-mesh code Arepo (Springel, 2010) even when the physics included in the codes is identical (Vogelsberger et al., 2011; Kereš et al., 2012; Torrey et al., 2011). Fortunately, a comparison of idealised merger simulations run with Gadget-2 and Arepo suggests that these issues do not significantly alter the global properties (e.g., star formation histories) of the mergers (Hayward et al., in preparation), so the results presented here should be robust to these numerical issues. It explicitly conserves both energy and entropy when appropriate (Springel & Hernquist, 2002). Beyond the core gravitational and gas physics, the version of Gadget-2 we use includes radiative heating and cooling (Katz et al., 1996). Star formation is implemented using a volume-density-dependent Kennicutt-Schmidt (KS) law (Schmidt, 1959; Kennicutt, 1998), , with a low-density cutoff. We use , which reproduces the global KS law and is consistent with observations of high-redshift disc galaxies (Krumholz & Thompson 2007; Narayanan et al. 2008, 2011; but see Narayanan et al. 2012b).
Furthermore, our simulations include a two-phase sub-resolution model for the interstellar medium (ISM; Springel & Hernquist, 2003) in which cold dense clouds are in pressure equilibrium with a diffuse hot medium. The division of mass, energy, and entropy between the two phases is affected by star formation, radiative heating and cooling, and supernova feedback, which heats the diffuse phase and evaporates the cold clouds (Cox et al., 2006b). Metal enrichment is calculated assuming each particle behaves as a closed box the yield appropriate for a Kroupa (2001) IMF. The simulations also include the Springel et al. (2005) model for feedback from active galactic nuclei (AGN), in which black hole (BH) sink particles, initialised with mass , undergo Eddington-limited Bondi-Hoyle accretion (Hoyle & Lyttleton, 1939; Bondi & Hoyle, 1944; Bondi, 1952). They deposit per cent of their luminosity (, where is the mass accretion rate and is the speed of light) to the surrounding ISM. This choice is made so that the normalisation of the relation is recovered (Di Matteo et al., 2005). Note that our results do not depend crucially on the implementation of BH accretion and feedback for two reasons: 1. the AGN typically do not dominate (but can still contribute significantly to) the luminosity of our model SMGs because the SEDs during the phase of strong AGN activity tend to be hotter than during the starburst phase (e.g., Younger et al. 2009, Snyder et al., in preparation), so the mergers are typically not SMGs during the AGN-dominated phase. 2. Even in the absence of AGN feedback, the SFR decreases sharply after the starburst simply because the majority of the cold gas is consumed in the starburst.
[ caption = Progenitor disc galaxy properties, center, doinside=, star, notespar ]lcccccc \tnote[a]Virial velocity. \tnote[b]Virial mass. \tnote[c]Halo concentration. \tnote[d]Initial stellar mass. \tnote[e]Initial gas mass. \tnote[f]Disc scale length. \FL& \tmark[a] \tmark[b] c\tmark[c] \tmark[d] \tmark[e] \tmark[f] \NNName (km s-1) () () () ( kpc) \MLb6 500 6.4 2.3 5.3 22 3.3 \NNb5.5 400 3.3 2.5 2.7 11 2.6 \NNb5 320 1.7 2.8 1.4 5.6 2.0 \NNb4 260 0.60 3.2 0.49 2.0 1.7 \LL
Each disc galaxy is composed of a dark matter halo with a Hernquist (1990) profile and an exponential gas and stellar disc in which gas initially accounts for 80 per cent of the total baryonic mass. At merger coalescence, the baryonic gas fractions are typically 20-30 per cent, which is consistent with the estimates of Narayanan et al. (2012a). The mass of the baryonic component is 4 per cent of the total. The galaxies are scaled to following the method described in Robertson et al. (2006). Dark matter particles have gravitational softening lengths of pc, whereas gas and star particles have pc. We use dark matter, stellar, gas, and 1 BH particle per disc galaxy. The detailed properties of the progenitor galaxies are given in Table 3.1. Note that we have chosen galaxy masses such that most of the mergers, based upon our simulations, will contribute to the bright SMG population (i.e., at some time during the simulation they have observed 850-µm flux density mJy). More massive galaxies will also contribute but are increasingly more rare, so our simulations should be representative of all but the brightest, rarest SMGs (Michałowski et al., 2012). Note also that we have included some slightly lower mass mergers for completeness.
[ caption = Merger parameters , center, notespar]lcccc \tnote[a]Baryonic mass ratio . \tnote[b]Pericentric-passage distance. \tnote[c]Initial separation of the discs. \FL& \tmark[b] \tmark[c] \NNName \tmark[a] ( kpc) ( kpc) \MLb6b6 1 6.7 70 \NNb6b5.5 0.52 6.7 70 \NNb6b5 0.26 6.7 70 \NNb6b4 0.09 6.7 70 \NNb5.5b5.5 1 5.3 57 \NNb5b5 1 4.0 44 \LL
We simulate each disc galaxy listed in Table 3.1 in isolation for Gyr and use these isolated disc simulations as part of our simulation suite. Our suite also includes a number of simulations of major and minor galaxy mergers. For the merger simulations, two of the progenitor disc galaxies are placed on parabolic orbits (which are motivated by cosmological simulations; Benson 2005; Khochfar & Burkert 2006) with initial separation and pericentric-passage distance equal to twice the disc scale length, (Robertson et al., 2006). The evolution of the system is followed for Gyr, which is sufficient time for the galaxies to coalescence and for significant star formation and AGN activity to cease. The details of the merger simulations are given in Table 3.1. For each combination of progenitor discs in Table 3.1, we simulate a subset of the i-p orbits of Cox et al. (2006a). Specifically, we use the i-p orbits for the major mergers (b6b6, b5.5b5.5, and b5b5) and the i and j orbits for the unequal-mass mergers (b6b5.5, b6b5, and b6b4) because the latter have shorter duty cycles and the variation in duty cycles amongst orbits is not a primary source of uncertainty. Consequently, we use a total of 34 Gadget-2 simulations.
3.2 Dust radiative transfer
In post-processing, we use the 3-D Monte Carlo radiative transfer code Sunrise 666Sunrise is publicly available at http://code.google.com/p/sunrise/. to calculate the UV-to-mm SEDs of the simulated galaxies. We have previously simulated galaxies with colours/SEDs consistent with local SINGS (Kennicutt et al., 2003; Dale et al., 2007) galaxies (Jonsson, Groves, & Cox, 2010); local ULIRGs (Younger et al., 2009); massive, quiescent, compact galaxies (Wuyts et al., 2009, 2010); 24 µm-selected galaxies (Narayanan et al., 2010a); K+A/post-starburst galaxies (Snyder et al., 2011); and extended UV discs (Bush et al., 2010), among other populations, so we are confident that Sunrise can be used to model the high-z SMG population. As discussed above, previous work has demonstrated that many properties of our simulated SMGs agree with observations (Narayanan et al., 2009, 2010b; Hayward et al., 2011a, 2012), but we have yet to put our simulated SMGs in a cosmological context. We briefly review the details of Sunrise here, but we refer the reader to Jonsson et al. (2006), Jonsson et al. (2010), and Jonsson & Primack (2010) for full details of the Sunrise code.
Sunrise uses the output of the Gadget-2 simulations to specify the details of the radiative transfer problem to be solved, specifically the input radiation field and dust geometry. The star and BH particles from the Gadget-2 simulations are used as sources of emission. Star particles are assigned Starburst99 (Leitherer et al., 1999) SEDs according to their ages and metallicities. We conservatively use the Kroupa (2001) IMF when calculating the simple stellar population SED templates. Star particles present at the start of the Gadget-2 simulation are assigned ages by assuming that their stellar mass was formed at a constant rate equal to the star formation rate of the initial snapshot, but the results are insensitive to this choice because we discard the early snapshots and the stars present at the start of the simulation account for a small fraction of the luminosity at later times. The initial gas and stellar metallicities are (; Asplund et al. 2009). We have chosen this value so that the starbursts lie roughly on the observed mass-metallicity relation; however, the results are fairly robust to this choice because a factor of 2 change in dust mass changes the (sub)mm flux by only per cent because (sub)mm flux scales approximately as (Equations 15 and 16). BH particles are assigned luminosity-dependent templates derived from observations of un-reddened quasars (Hopkins et al., 2007), where the luminosity is determined using the accretion rate from the Gadget-2 simulations as described above.
The dust distribution is determined by projecting the total gas-phase metal density in the Gadget-2 simulations on to a 3-D adaptive mesh refinement grid assuming a dust-to-metal ratio of 0.4 (Dwek, 1998; James et al., 2002). We have used a maximum refinement level of 10, which results in a minimum cell size of 55 pc. This refinement level is sufficient to ensure the SEDs are converged to within a few per cent because the structure present in the Gadget-2 simulations is sufficiently resolved; if the resolution of the Gadget-2 simulations were finer, the radiative transfer would require correspondingly smaller cell sizes. Note that we assume the ISM is smooth on scales below the Gadget-2 resolution and do not make use of the Groves et al. (2008) sub-resolution photodissociation region model. The details of, motivation for, and implications of this choice are discussed in sections 2.2.1 and 4.6 of H11. We assume the dust has properties given by the Milky Way dust model of Weingartner & Draine (2001) as updated by Draine & Li (2007). The (sub)mm fluxes are similar if the LMC or SMC dust models are used.
Once the star and BH particles are assigned SEDs and the dust density field is specified, Sunrise performs the radiative transfer using a Monte Carlo approach by emitting photon packets that are scattered and absorbed by dust as they propagate through the ISM. The energy absorbed by dust is re-radiated in the IR. Dust temperatures, which depend on both grain size and the local radiation field, are calculated by assuming the dust is in thermal equilibrium. The ISM of our simulated galaxies can often be optically thick at IR wavelengths, so Sunrise calculates the effects of dust self-absorption using an iterative method. This is crucial for ensuring accurate dust temperatures.
The Sunrise calculation yields spatially resolved SEDs (analogous to integral field unit spectrograph data) of the simulated galaxies viewed from different viewing angles. Here, we use 7 cameras distributed isotropically in solid angle. We use the SCUBA-2 850-, AzTEC 1.1-mm, and ALMA Bands 6 and 7 filter response curves to calculate the (sub)mm flux densities. Depending on the mass and the SMG flux cut, the simulations are selected as SMGs for snapshots, and each is viewed from 7 viewing angles. Consequently, we have a sample of distinct synthetic SMG SEDs that we use to derive fitting functions for the isolated disc and galaxy-pair SMGs and duty cycles for the starburst SMGs.
4 Predicting (sub)mm number counts
To calculate the total SMG number counts predicted by our model, we must account for all subpopulations, including the infall-stage galaxy-pair SMGs discussed in H11 and H12, late-stage merger-induced starbursts, and isolated discs. To calculate the counts for the two subpopulations associated with mergers, we must combine the duty cycles of the mergers [the time the merger has (sub)mm flux greater than some flux cut] with merger rates because the number density is calculated by multiplying the duty cycles by the merger rates. For the isolated discs, we require the number density of a disc galaxy as a function of its properties and the (sub)mm flux associated with that galaxy. We describe our methods for predicting the counts of each subpopulation now.
4.1 Late-stage merger-induced starbursts
To predict the number counts for the population of late-stage merger-induced starburst SMGs, we combine merger rates – which depend on mass, mass ratio, gas fraction, and redshift – from the SEM with (sub)mm light curves from our simulations. We use the (sub)mm light curves from the simulations directly because it is difficult to analytically model the dynamical evolution of the mergers, which can depend on the galaxy masses, merger mass ratio, progenitor redshift, gas fraction, and orbital properties. For the SMG subpopulation attributable to mergers, the number density of sources with flux density greater than at redshift is
| (1) | |||||
where is the number of mergers per comoving volume element per unit time per dex baryonic mass per unit mass ratio per unit gas fraction, which is a function of progenitor baryonic mass , merger mass ratio , gas fraction at merger , and redshift , and is the amount of time (duty cycle) for which a merger with most-massive-progenitor baryonic mass , mass ratio , and gas fraction at redshift has flux density .
4.1.1 Duty cycles
We calculate the duty cycles and for various and values for the late-stage merger-induced starburst phase of our merger simulations. We neglect the dependence of duty cycle on gas fraction because sampling the range of initial gas fractions in addition to masses, mass ratios, and orbits is computationally prohibitive. Instead, as described above, we initialise the mergers with gas fraction so that sufficient gas remains at merger coalescence.777Note, however, that we calculate the starburst duty cycle using only the snapshots that sample the final starburst induced at merger coalescence, so the gas fraction is typically less than 40 per cent. We treat the early-stage galaxy-pair SMG contribution separately below.
Similarly, because of computational limitations, we scale all initial disc galaxies to . We will see below that all else being equal, the dependence of (sub)mm flux density on is small ( dex) for the redshift range of interest (), so we assume the duty cycles are independent of redshift and place the mergers at (which is approximately the median redshift for our model SMGs) when calculating the duty cycles. Note, however, that the submm duty cycles for the starbursts may differ for mergers with progenitor disc properties scaled to different redshifts, but our model does not capture this effect. However, because most SMGs in our model have (see below), this uncertainty should be subdominant.
For each , we average the duty cycles for each set of models with identical and then fit the resulting surface with a second-degree polynomial in and to estimate the duty cycle for values not explicitly sampled by our simulations.
4.1.2 Merger rates
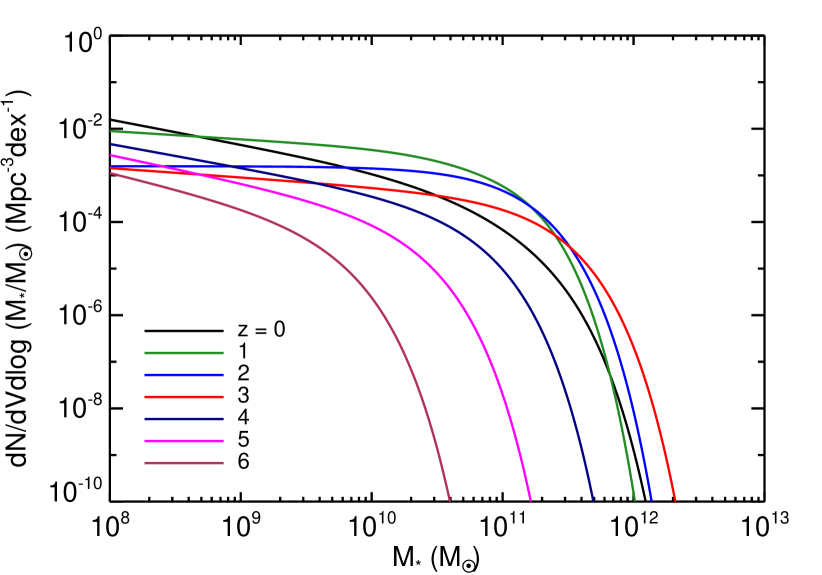
The other ingredient needed to predict the counts for merger-induced starbursts is the merger rates. We use rates from the SEM described in detail in Hopkins et al. (2008c, 2010a, 2010b, 2010c), which we will briefly summarise here. The model starts with a halo mass function that has been calibrated using high-resolution -body simulations. Galaxies are assigned to haloes using an observed SMF for star-forming galaxies and the halo occupation formalism (Conroy & Wechsler, 2009). We use a fiducial SMF that is a combination of multiple observed SMFs, in which each covers a subset of the total redshift range. For , we use the SMF of star-forming galaxies from Ilbert et al. (2010). For , we use the SMF of Marchesini et al. (2009) because their survey is amongst the widest and deepest available and because they have performed a thorough analysis of the random and systematic uncertainties affecting the SMF determination. For , we use the Fontana et al. (2006) SMF parameterization; though they only constrained the SMF out to , the extrapolation agrees reasonably well with the constraints from González et al. (2011), so this extrapolation is not unreasonable. Because the SMF at is uncertain, it may be possible to constrain the SMF at those redshifts by using the observed SMG redshift distribution and relative contributions of the subpopulations; we discuss these possibilities below. The interested reader should see Hayward (2012) for a detailed exploration of how the choice of SMF affects the predictions of our model. We do not correct for the passive galaxy fraction beyond , but this fraction is relatively small at and decreases rapidly at higher redshifts (e.g., Wuyts et al., 2011; Brammer et al., 2011). Our composite SMF at integer redshifts in the range is plotted in Fig. 1. Finally, we use halo-halo merger rates from high-resolution -body simulations and translate to galaxy-galaxy merger rates by assuming the galaxies merge on a dynamical friction time-scale.
The merger rates, SMF, and observed gas fractions are all uncertain. The merger rates are uncertain at the factor of level; the various sources of uncertainty and effects of modifying the model assumptions are discussed in detail in Hopkins et al. (2010a, b). At the redshifts of interest the random and systematic uncertainties in the SMF are comparable to the total uncertainty in the merger rates.
4.1.3 Predicted counts
Using the above assumptions, Equation (1) becomes
| (2) | |||||
To calculate the observable cumulative counts (deg-2), we must multiply by , the comoving volume element in solid angle and redshift interval , and integrate over redshift:
| (3) |
where
| (4) |
Here, is the angular diameter distance at redshift and .
4.2 Isolated discs and early-stage mergers
We treat the isolated discs and early-stage mergers, which are dominated by quiescent star formation, in a semi-empirical manner, in which we assign galaxy properties based off observations. To calculate the observed (sub)mm flux densities using scaling relations similar to those of H11, we must determine the SFR and dust mass of a galaxy as a function of stellar mass and redshift. We then use SMF and merger rates to calculate the (sub)mm counts for these populations.
4.2.1 Assigning galaxy properties
Following Hopkins et al. (2010a, c), we assign gas fractions and sizes as a function of stellar mass using observationally derived relations. We present the relevant relations below, but we refer the reader to Hopkins et al. (2010a, b, c) for full details, including the list of observations used to derive the relations and justifications for the forms used. Hopkins et al. (2010c) have shown that this model reproduces global constraints, such as the IR luminosity function at various redshifts and the star formation history of the Universe, among others; these results support the application of the model in this work.
The baryonic gas fraction, , of a galaxy of stellar mass and redshift , as determined from the observations listed in Hopkins et al. (2010c), is given by Equation (1) of Hopkins et al. (2010c),
| (5) |
where is the fractional look-back time to redshift . At a given mass, galaxy gas fractions increase with redshift. At fixed redshift, they decrease with stellar mass. Using , we can calculate the gas mass as a function of and ,
| (6) |
Similarly, we parameterize the radius of the gas disc as a function of mass and redshift using the observations listed in Hopkins et al. (2010c). (Note that the stellar disc radii are significantly smaller.) The relation (Equation 2 of Hopkins et al. 2010c; see also Somerville et al. 2008) is
| (7) | |||||
| (8) |
We assume the quiescently star-forming discs obey the KS relation (Schmidt, 1959; Kennicutt, 1998),
| (9) |
where and are the SFR and gas surface densities, respectively and (Kennicutt, 1998), at all redshifts, as is supported by observations (e.g., Narayanan et al. 2008; Daddi et al. 2010; Genzel et al. 2010; Narayanan et al. 2011; but c.f. Narayanan et al. 2012b). We normalise the relation assuming a Kroupa (2001) IMF. Assuming and , where is the SFR, we find
| (10) | |||||
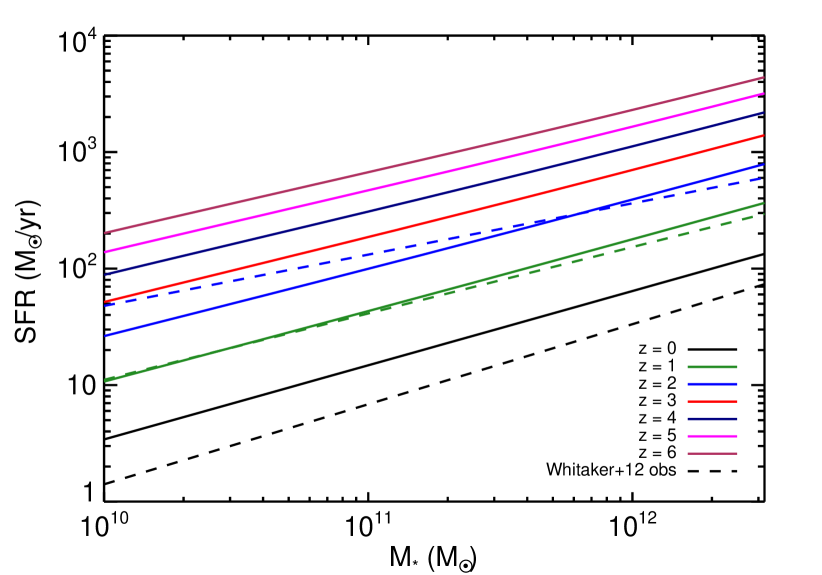
which can be recast in terms of rather than using Equations (4.2.1) and (6). Fig. 2 shows the SFR- relation given by Equation (10) for integer redshifts in the range and the observed relations from Whitaker et al. (2012) for , 1, and 2. The agreement between our relation and those observed for and 2 is reasonable for the masses () relevant to the SMG population. The agreement is less good for , but, as we shall see below, this is unimportant because the fraction of SMGs at is small. If the Whitaker et al. (2012) SFRs were used instead of those calculated from Equation (10), the contribution would be even smaller.
In addition to the SFR, we require the dust mass to calculate the (sub)mm flux densities. To determine the dust mass, we must know the gas-phase metallicity. Observations have demonstrated that metallicity increases with stellar mass; this relationship has been constrained for redshifts (Tremonti et al., 2004; Savaglio et al., 2005; Erb et al., 2006; Kewley & Ellison, 2008; Maiolino et al., 2008). Maiolino et al. (2008) parameterized the evolution of the mass-metallicity relation (MMR) with redshift using the form
| (11) | |||||
They determine the values of and at redshifts 0.07, 0.7, 2.2, and 3.5 using the observations of Kewley & Ellison (2008), Savaglio et al. (2005), Erb et al. (2006), and their own work, respectively. To crudely capture the evolution of the MMR with redshift, we fit the values of and given in Table 5 of Maiolino et al. (2008) as power laws in ; the result is and
Using (Asplund et al., 2009), we have
| (12) | |||||
The solar metal fraction is (Asplund et al., 2009), so
| (13) |
We assume the dust mass is proportional to the gas-phase metal mass, . Thus,
| (14) |
where we use a dust-to-metal ratio (Dwek, 1998; James et al., 2002).
Motivated by equation (1) of H11, we fit the (sub)mm flux densities of our simulated galaxies as power laws in SFR and . We find that
| (15) | |||||
| (16) | |||||
is accurate to within dex for . (The flux for galaxies at is underestimated significantly by these equations, but such galaxies contribute little to the overall counts because of the smaller cosmological volume probed and the significantly lower gas fractions and SFRs, so this underestimate is unimportant for our results.) The (sub)mm flux is insensitive to redshift in this redshift range because as redshift increases, the decrease in flux caused by the increased luminosity distance is almost exactly cancelled by the increase in flux caused by the rest-frame wavelength moving closer to the peak of the dust emission (this effect is referred to as the negative K correction; see, e.g., Blain et al. 2002). By combining Equations (10) and (14) with Equations (15) and (16), we can calculate and ,
| (17) | |||||
| (18) | |||||
where we can substitute the appropriate expressions for , , and to express and in terms of and only.
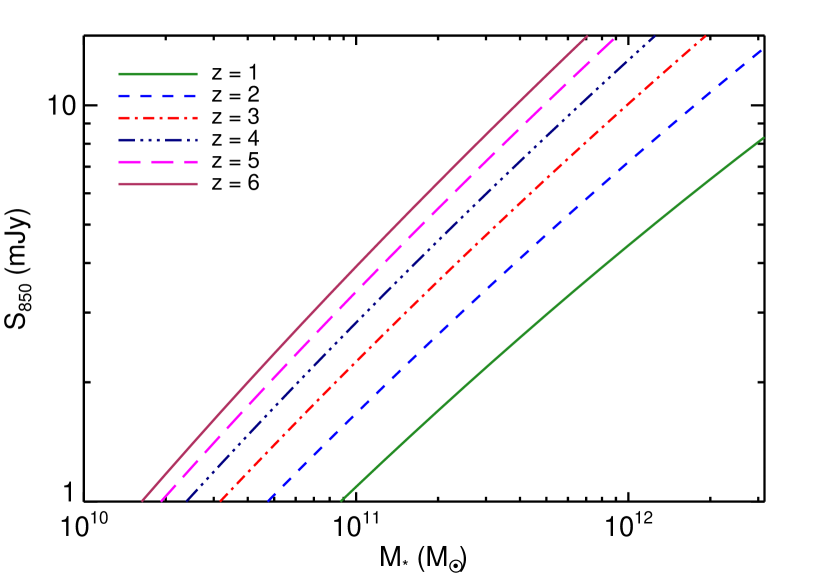
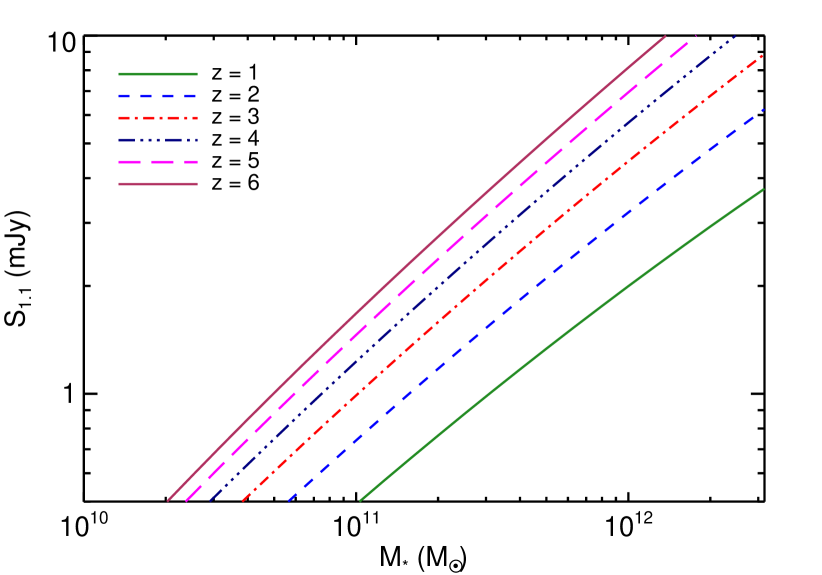
Fig. 3 shows the and relations given by Equations (17) and (18), respectively, for isolated discs at integer redshifts in the range . As redshift increases, galaxies become more gas-rich and compact; both effects cause the SFR for a given to increase (see Fig. 2). For fixed , a higher gas fraction corresponds to a higher gas-phase metal mass. However, because the normalisation of the MMR decreases as increases, the increase of the gas-phase metal mass with gas fraction is partially mitigated.888For very high redshifts, at which there should be very few metals and thus very little dust, the (sub)mm flux of a galaxy of a given mass should decrease sharply. However, the precise redshift dependence depends on still-uncertain details of dust production; thus, it is possible that constraints on the fraction of SMGs with will yield insight into the physics of dust production. The increased SFR and both result in a higher (sub)mm flux for a given . To produce an isolated disc SMG ( mJy, or mJy) at , we require . This value is consistent with the results of Michałowski et al. (2010, 2012).
Note also that we can use these relations to calculate the expected ratio, (this is similar to observational estimates; e.g., Austermann et al. 2010). For simplicity, we will use this ratio to derive approximate values to also show an axis on the relevant plots.
4.2.2 Infall-stage galaxy-pair SMGs
During the infall stage of a merger, the discs are dominated by quiescent star formation that would occur even if they were not merging. Only for nuclear separation kpc999This value is derived for the simulations presented here, and it may differ for simulations because of differences in structural properties and gas fractions. do the discs have SFRs that are significantly elevated by the mutual tidal interactions (H12); this result is consistent with observed SFR elevations in mergers (e.g., Scudder et al., 2012). Thus, during the infall stage, we assume the discs are in a steady state (i.e., they have constant SFR and dust mass); even without a source of additional gas, this is a reasonable approximation for the infall stage to within a factor of (see fig. 1 of H11). For a merger of two progenitors with stellar masses and , the total flux density is . The typical beam sizes of single-dish (sub)mm telescopes are 15”, or kpc at ; schematically, when the projected separation is less than this distance, the sources are blended into a single source.101010Because of the computational expense involved, we do not create synthetic maps, add noise, convolve the maps with a Gaussian beam, and then calculate the fluxes of the sources. However, the uncertainty caused by our simple method of calculating the total flux is subdominant to other uncertainties inherent in the model. To predict single-dish counts, we assume the galaxies should be treated as a single source if the physical separation is kpc. From our simulations, which use cosmologically motivated orbits, we find that this time-scale is of order Myr. Though the time-scale depends slightly on the most-massive-progenitor mass, we neglect this dependence because it is subdominant to various other uncertainties. However, this time-scale is derived from the simulations and thus may be too long for mergers at higher . Given the above assumptions, the duty cycle for a given and merger described by more-massive progenitor mass and stellar mass ratio is 0.5 Gyr if and 0 otherwise. With the duty cycle in hand, we can use Equations (2) and (3) to calculate the predicted number density and counts.
To predict counts for ALMA, we simply assume that the two discs are resolved into individual sources and thus treat them as two isolated disc galaxies, as described below.
4.2.3 Isolated disc counts
For a given and , we invert the functions (Equations 17 and 18) to calculate the minimum required for a galaxy at redshift to have (sub)mm flux density , . To calculate the number density , we then simply use the star-forming galaxy SMF to calculate
| (19) |
and we use Equation (3) to calculate the predicted counts. To predict counts for single-dish (sub)mm telescopes, where the galaxy-pair SMGs are blended into a single source, we subtract the fraction of galaxies with that are in mergers from the isolated disc counts to avoid double counting.
5 Results
Here, we present the key results of this work, the SMG cumulative number counts, the relative contributions of the subpopulations, and the redshift distribution predicted by our model. We focus on the AzTEC (Wilson et al., 2008) 1.1-mm counts here because to our knowledge, the best-constrained blank-field counts (i.e., those from the deepest and widest surveys) have been determined using that instrument (Austermann et al., 2010; Aretxaga et al., 2011). However, because for our simulated SMGs, to within per cent, we can easily convert the 1.1-mm counts to 850- counts. Thus, we include both and values on the relevant plots and convert observed 850- counts to 1.1-mm counts by assuming the same ratio holds for real SMGs.
5.1 SMG number counts for single-dish observations
[ caption = Single-dish-detected SMG cumulative number counts , center, star, notespar ]lccccc \tnote[a]1.1-mm flux density. \tnote[b]Approximate 850- flux density calculated assuming . \tnote[c]Cumulative number counts of SMGs with 1.1-mm flux density greater than the value given in the first column. \tnote[d-f]Fractional contribution of each subpopulation to the total cumulative counts for the given . \FL\tmark[a] & \tmark[b] \tmark[c] Fractional contribution \NN(mJy) (mJy) (deg-2) Isolated discs\tmark[d] Galaxy pairs\tmark[e] Starbursts\tmark[f] \ML0.5 1.1 8038 0.52 0.35 0.13 \NN1.0 2.3 2676 0.25 0.36 0.39 \NN1.5 3.4 773 0.20 0.52 0.28 \NN2.0 4.6 354 0.14 0.51 0.35 \NN2.5 5.7 200 0.09 0.45 0.46 \NN3.0 6.9 110 0.06 0.41 0.52 \NN3.5 8.0 65 0.04 0.38 0.58 \NN4.0 9.2 41 0.03 0.33 0.64 \NN4.5 10.3 27 0.02 0.28 0.70 \NN5.0 11.5 13 0.01 0.29 0.69 \NN5.5 12.6 6 0.01 0.40 0.59 \NN6.0 13.8 2 0.01 0.53 0.45 \LL
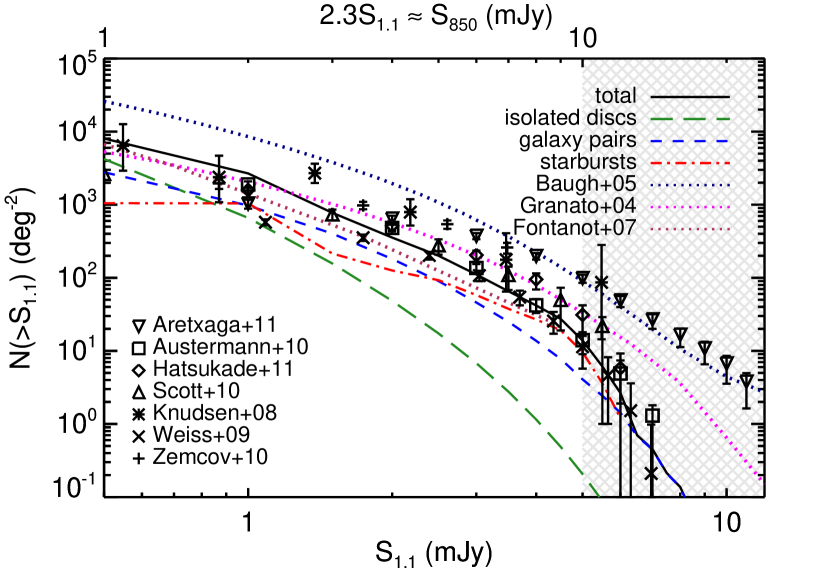
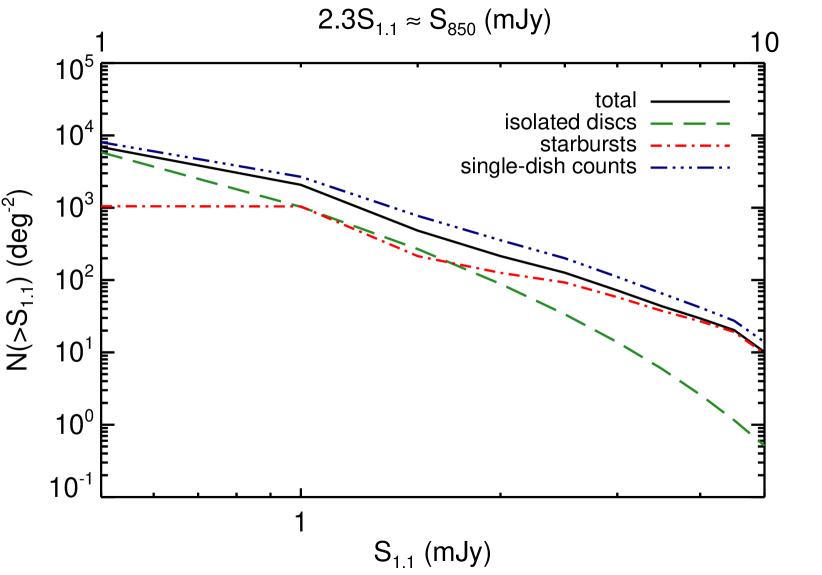
Fig. 4 shows the total cumulative 1.1-mm number counts (black solid line), which are calculated from the cumulative number density using Equation (3). We decompose the counts into isolated discs (green long-dashed), galaxy pairs (blue dashed), and starbursts induced at merger coalescence (red dash-dotted); the relative contribution of each subpopulation is discussed in Section 5.2. The data points in Fig. 4 are observed counts from various surveys: 1.1-mm counts from Aretxaga et al. (2011, circles), Austermann et al. (2010, squares), Hatsukade et al. (2011, diamonds), and Scott et al. (2010, triangles); 850- counts from Knudsen et al. (2008, asterisks) and Zemcov et al. (2010, plus signs); and 870- counts from Weiß et al. (2009, x’s). The 850- and 870- counts have been converted to 1.1-mm counts by assuming . The model predictions of Baugh et al. (2005), Granato et al. (2004), and Fontanot et al. (2007) are shown for comparison.
The predicted and observed counts are in good agreement at the lowest fluxes, but the predicted counts are less than some of those observed at the bright end. The Austermann et al. (2010) and Aretxaga et al. (2011) surveys are the two largest ( deg-2), so their counts should be least affected by cosmic variance and thus most robust. Thus, it is encouraging that the agreement between our predicted counts and those of Austermann et al. (2010) is very good at all fluxes. The disagreement between our predicted counts and those observed by Aretxaga et al. (2011) is significant even for the lower flux bins (a factor of for the mJy bin). However, Aretxaga et al. (2011) conclude that the excess of sources at mJy compared with the SHADES field observed by Austermann et al. (2010) is caused by sources moderately amplified by galaxy-galaxy and galaxy-group lensing. At higher fluxes, the effect of lensing is more significant (Negrello et al., 2007; Paciga et al., 2009; Lima et al., 2010), and it would be incredibly difficult to explain the sources with mm flux density mJy observed by Vieira et al. (2010) and Negrello et al. (2010) if they are not strongly lensed. We do not include the effects of gravitational lensing in our model, so it is unsurprising that we significantly under-predict the counts of Aretxaga et al. (2011) despite the excellent agreement between our counts and those observed by Austermann et al. (2010).
Additionally, it is important to note that the steepness of the cutoff in the starburst counts at mJy is artificial: because we determine the fluxes of the isolated discs and galaxy pairs in an analytic way, we can extrapolate to arbitrarily high masses for those populations. For the starbursts however, we are limited by the parameter space spanned by our merger simulations. None of our starburst SMGs reach mJy (or mJy), so the duty cycle for all starbursts for mJy is zero. If we were to simulate a galaxy more massive than our most massive model (b6), the simulation would reach a correspondingly higher flux, so the predicted counts for mJy would no longer be zero. However, the rarity of such objects does not justify the additional computational expense. Thus for mJy (or mJy), the starburst counts should be considered a lower limit. A simple extrapolation from the lower-flux starburst counts suggests that our model may even over-predict the counts of the brightest sources. However, the observed number density of sources with mJy is highly uncertain because of the effects of small number statistics, cosmic variance, and lensing, and the uncertainty in the model prediction is significant because of uncertainties in the abundances and merger rates of such extreme systems. Thus, the counts for the brightest sources should be interpreted with caution.
Furthermore, we do not attempt to model some other potential contributions to the SMG population. In particular, we do not include contributions from mergers of more than two discs, clusters, or physically unrelated sources blended into a single (sub)mm source (see Wang et al. 2011 for evidence of the last type).
Given these caveats and the modelling uncertainties, our predicted counts are clearly consistent with those observed, and including lensing and the previously mentioned additional possible contributions to the SMG population would tend to increase the number counts. Also, we stress that our model is conservative in the sense that it uses a Kroupa – rather than top-heavy or flat – IMF and is tied to observations whenever possible. The consistency of the predicted and observed counts suggests that the observed SMG counts may not provide evidence for IMF variation; this will be discussed in detail in Section 6.1.
5.2 Relative contributions of the subpopulations
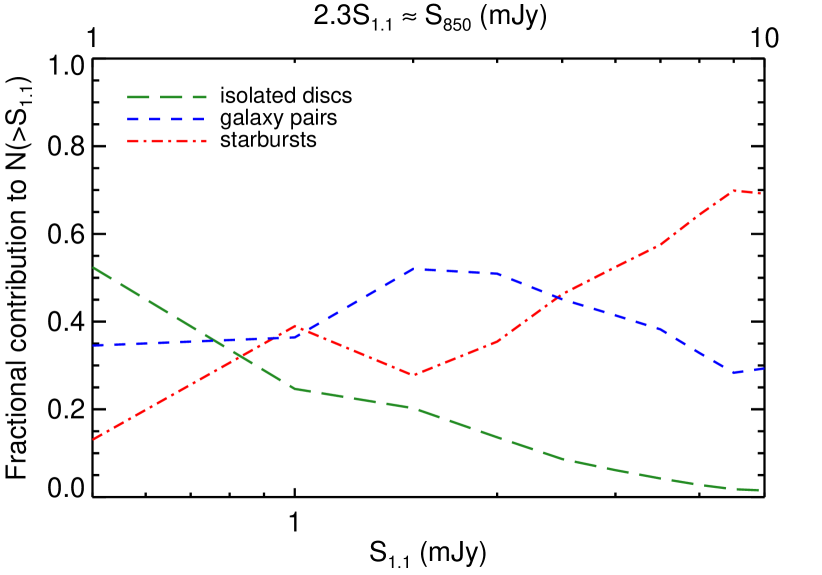
In previous work (H11; Hayward et al. 2011b; H12), we argued that the SMG population is not exclusively late-stage merger-induced starbursts but rather a heterogeneous collection of starbursts, infall-stage mergers (‘galaxy-pair SMGs’), and isolated discs. However, so far we have only presented the physical reasons one should expect such heterogeneity. It is crucial to quantify the relative importance of each subpopulation, so we do this now.
The counts shown in Fig. 4 are divided into subpopulations, but the relative contributions can be read more easily from Fig. 5, which shows the fractional contribution of each subpopulation to the total cumulative counts. At the lowest fluxes, the isolated disc contribution is the most significant. At mJy ( mJy), the three subpopulations contribute almost equally. As expected from conventional wisdom, the starbursts dominate at the highest fluxes. However, contrary to conventional wisdom, the bright SMGs are not exclusively merger-induced starbursts: from Fig. 5, we see that at all fluxes plotted, the galaxy pairs account for 30-50 per cent of the total predicted counts, so they are a significant subpopulation of SMGs in our model. As explained in H12, the galaxy-pair SMGs are not physically analogous to the merger-induced starburst SMGs; thus, their potentially significant contribution to the SMG population can complicate physical interpretation of the observed properties of SMGs.
It is interesting to compare the relative contributions of the isolated disc and galaxy-pair subpopulations because the relative contributions can be understood – at least schematically – in a simple manner. For a major merger of two galaxies with , the flux of the resulting galaxy-pair SMG is approximately twice that of the individual isolated discs, . Because depends sub-linearly on (see Fig. 3), for an isolated disc to have equal to that of the galaxy pair, it must have . Thus, the relative contribution of the two subpopulations depends on whether the number density of discs divided by that of discs, , is greater than the fraction of discs undergoing a major merger, which is the merger rate times the duty cycle of the infall phase (500 Myr). If the former is larger, the discs will dominate the pairs of discs, whereas if the merger fraction is higher than the relative number density, the galaxy pairs will dominate.
The latter scenario is likely for bright SMGs, which are on the exponential tail of the SMF. For example, at , a galaxy with undergoes mergers per Gyr. Thus, if we assume a duty cycle of 500 Myr for the galaxy-pair phase, approximately 15 per cent of such galaxies will be in galaxy pairs. For the Marchesini et al. (2009) SMF, the number density of galaxies is per cent that of galaxies. Therefore, by the above logic, the pairs of galaxies will contribute more to the submm counts than the isolated discs. This simple argument demonstrates why the galaxy pairs become dominant over the isolated discs for mJy ( mJy). However, the threshold for dominance depends on both the scaling and the shape of the SMF at the high-mass end. Thus, observationally constraining the fraction of the SMG population that is galaxy pairs can provide useful constraints on both the (sub)mm flux- relation and the shape of the massive end of the SMF.
Unfortunately, the relative contribution of the starburst subpopulation cannot be explained in as simple a manner. The duty cycles for the merger-induced starbursts depend sensitively on progenitor mass and merger mass ratio, so the mapping from merger rate to number density is not as simple as it is for the isolated discs and galaxy pairs. Fortunately, the SMF uncertainty, which is very significant for the overall counts, is relatively unimportant for the relative contribution of starbursts and galaxy pairs. Thus, the relative contributions of starbursts and galaxy pairs depend primarily on their relative duty cycles. (To achieve a given flux density, one requires a less massive starburst than galaxy pair because the starburst increases the (sub)mm flux density moderately. Thus, the relative number density also matters. However, the inefficiency of starbursts at increasing the (sub)mm flux density of the system prevents significantly less massive but more common starbursts from dominating over more massive and rarer galaxy pairs.) The duty cycles are uncertain, but given that in our fiducial model the galaxy pairs contribute per cent of the total counts and the uncertainty in the duty cycles is definitely less than a factor of , the prediction that both the starburst and galaxy pair subpopulations are significant (i.e., more than a few per cent of the population) is robust.
Though there have been many observational hints suggesting the importance of the galaxy-pair contribution (see H11 and H12 for discussion), the physical importance of this subpopulation has to date not been fully appreciated, and the fractional contribution of galaxy-pair SMGs to the total counts remains relatively poorly constrained. However, clear observational evidence supporting the significance of this subpopulation is accumulating: of the 12 SMGs presented in Engel et al. (2010), 5 have CO emission that is resolved into two components with kinematics consistent with two merging discs. In two of the cases, the projected separation of the two components is kpc; such objects are prime examples of the galaxy-pair subpopulation. (See also Tacconi et al. 2006, 2008; Bothwell et al. 2010; Riechers et al. 2011a, b.) Smolčić et al. (2012) presented a larger sample of SMGs with (sub)mm-interferometric detections. They found that when observed with interferometers with ” resolution, per cent of single-dish SMGs were resolved into multiple sources, which is consistent with our prediction for the relative contribution of the galaxy-pair subpopulation. ALMA observations will significantly increase the number of SMGs observed with ” resolution and thus better constrain the galaxy-pair contribution to the SMG population.
Further evidence for a galaxy-pair contribution consistent with what we predict is the fraction of the SMGs with multiple counterparts at other wavelengths. One of the earliest observational indications of this population came from the SCUBA 8-mJy survey: of this sample of 850- sources, Ivison et al. (2002) found that per cent have multiple radio counterparts. Approximately ten per cent of the GOODS-N 850- (Pope et al., 2006), GOODS-N 1.1-mm (Chapin et al., 2009), SHADES 850 (Ivison et al., 2007; Clements et al., 2008), and GOODS-S 1.1-mm (Yun et al., 2012) sources have multiple counterparts. These fractions are somewhat smaller than the 30-50 per cent contribution shown in Fig. 5, but both the predicted and observed fractions are uncertain. As explained above, the predicted fraction depends sensitively on the shape of the upper-end of the SMF and the relation between (sub)mm flux and . Observations, on the other hand, may miss the more widely separated counterparts and cases when one of the counterparts is significantly more obscured or is radio-quiet.
5.3 Redshift distribution
[ caption = Single-dish-detected SMG redshift distribution, center, notespar]lcc \tnote[a]Redshift. \tnote[b-c]Fractional contribution of sources in the redshift bin to the total sources with 1.1-mm flux density greater than the specified limit. \FL\tmark[a] \NN 1 mJy\tmark[b] 4 mJy\tmark[c] \ML0.0 – 0.5 0.001 0.004 \NN0.5 – 1.0 0.013 0.022 \NN1.0 – 1.5 0.026 0.033 \NN1.5 – 2.0 0.136 0.066 \NN2.0 – 2.5 0.192 0.071 \NN2.5 – 3.0 0.260 0.163 \NN3.0 – 3.5 0.268 0.369 \NN3.5 – 4.0 0.050 0.073 \NN4.0 – 4.5 0.027 0.067 \NN4.5 – 5.0 0.015 0.057 \NN5.0 – 5.5 0.008 0.044 \NN5.5 – 6.0 0.005 0.031 \LL
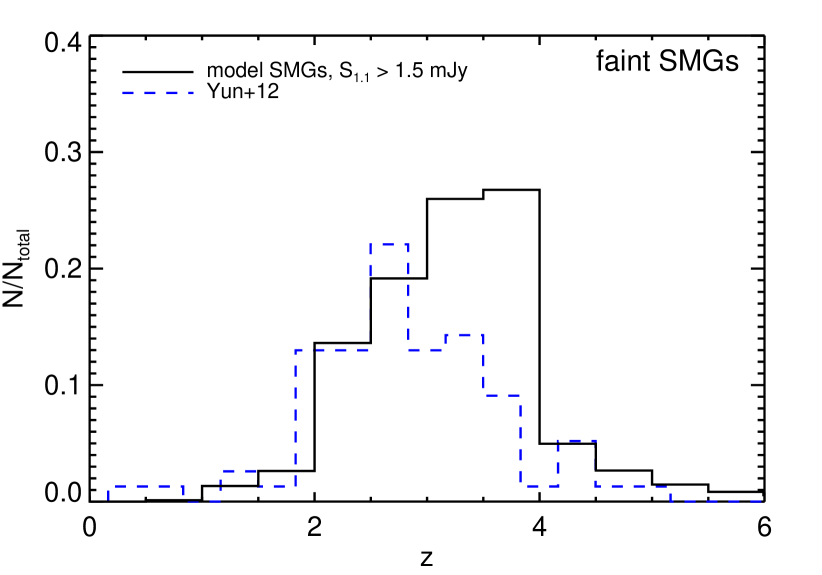
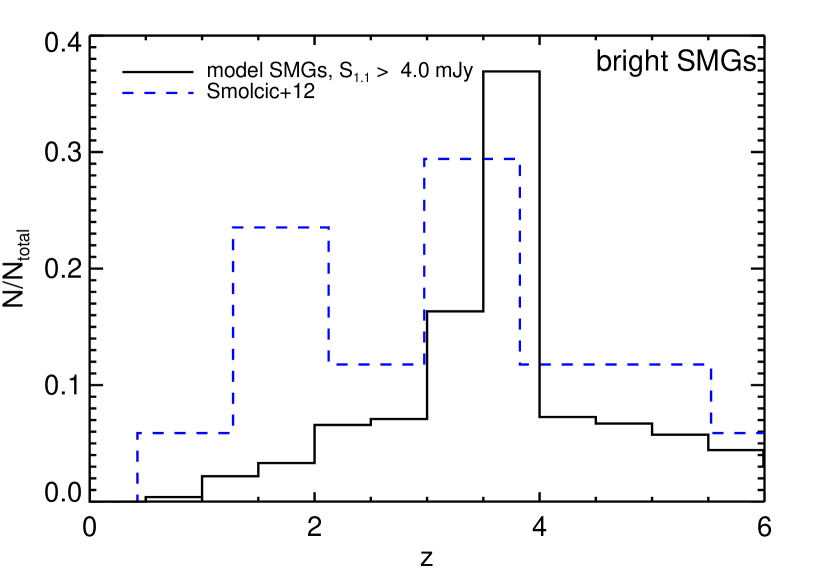
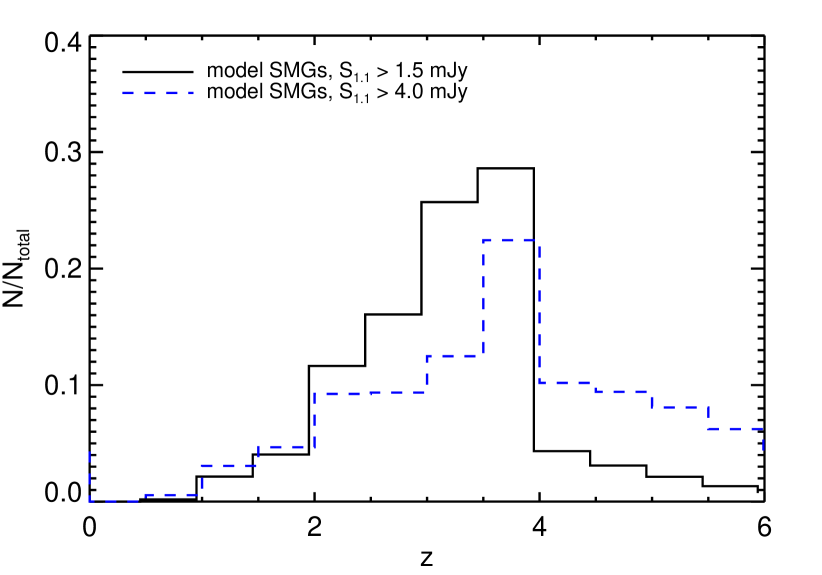
In addition to the number counts, a successful model for the SMG population must reproduce the redshift distribution. Fig. 6 shows the redshift distribution of 1.1-mm sources predicted by our model for different 1.1-mm flux cuts ( mJy, or mJy, in the top panel and mJy, or mJy, in the bottom) along with some observed distributions that have similar flux limits. The redshift distributions are relatively broad, and they peak in the range and decline at lower and higher redshifts. The mJy sources have mean redshift 3.0, whereas the mJy sources have mean redshift 3.5, so there is a tendency for the brighter sources to be at higher redshifts; this trend agrees with observations (Ivison et al., 2002; Yun et al., 2012; Smolčić et al., 2012).
For the mJy SMGs (top panel of Fig. 6), compared with the observations, our model predicts a higher mean redshift and a greater fraction of SMGs at . This discrepancy may suggest that the extrapolation of the Fontana et al. (2006) SMF we use for over-predicts the number of massive galaxies at the highest redshifts. Furthermore, merger time-scales may be shorter at high redshift, and the dust content may be lower than in our models; both of these effects would decrease the high-redshift contribution. Additionally, constraining the redshift distribution is complicated by selection effects, counterpart identification, and, in some cases, a lack of spectroscopic redshifts. Typically, the selection effects and counterpart identification make identifying higher-redshift SMGs more difficult. Finally, the significant differences amongst observed distributions (see Smolčić et al. 2012 for discussion) demonstrate the difficulty of determining the redshift distribution. Thus, the differences in the distributions may not be significant; spectroscopic follow-up of ALMA sources should clarify this issue (but note that the redshift distribution of ALMA sources, which is shown in the next section, should differ slightly). The typical redshift for the brighter SMGs (bottom panel of Fig. 6) is also somewhat higher than that observed (3.5 compared with 3.1), and the peak at is not reproduced. However, the observed distribution is based on a sample of 17 sources, so small-number statistics might explain the differences.
5.4 Predicted ALMA-detected SMG number counts and redshift distribution
[ caption = ALMA-detected SMG cumulative number counts , center, star, notespar ]lcccccc \tnote[a]1.1-mm flux density. \tnote[b-d]Approximate 850- and ALMA Bands 6 & 7 flux densities calculated using the conversion factors , , and . \tnote[e]Cumulative number counts of SMGs with 1.1-mm flux density greater than the value given in the first column. \tnote[f-g]Fractional contribution of each subpopulation to the total cumulative counts for the given . \FL\tmark[a] \tmark[b] \tmark[c] \tmark[d] \tmark[e] Fractional contribution \NN(mJy) (mJy) (mJy) (mJy) (deg-2) Isolated discs\tmark[f] Starbursts\tmark[g] \ML0.5 1.1 0.4 0.8 6897 0.85 0.15 \NN1.0 2.3 0.8 1.6 2072 0.50 0.50 \NN1.5 3.4 1.2 2.4 482 0.56 0.44 \NN2.0 4.6 1.6 3.2 214 0.41 0.59 \NN2.5 5.7 2.0 4.0 126 0.27 0.73 \NN3.0 6.9 2.4 4.8 71 0.19 0.81 \NN3.5 8.0 2.8 5.6 43 0.14 0.86 \NN4.0 9.2 3.2 6.4 29 0.09 0.91 \NN4.5 10.3 3.6 7.2 20 0.06 0.94 \NN5.0 11.5 4.0 8.0 10 0.05 0.95 \NN5.5 12.6 4.4 8.8 3 0.06 0.94 \NN6.0 13.8 4.8 9.6 1 0.08 0.92 \LL
[ caption = ALMA-detected SMG redshift distribution , center, notespar]lcc \tnote[a]Redshift. \tnote[b-c]Fractional contribution of sources in the redshift bin to the total sources with 1.1-mm flux density greater than the specified limit. \FL\tmark[a] \NN 1 mJy\tmark[b] 4 mJy\tmark[c] \ML0.0 – 0.5 0.002 0.006 \NN0.5 – 1.0 0.021 0.031 \NN1.0 – 1.5 0.040 0.047 \NN1.5 – 2.0 0.116 0.092 \NN2.0 – 2.5 0.161 0.094 \NN2.5 – 3.0 0.257 0.125 \NN3.0 – 3.5 0.286 0.224 \NN3.5 – 4.0 0.043 0.102 \NN4.0 – 4.5 0.031 0.094 \NN4.5 – 5.0 0.021 0.081 \NN5.0 – 5.5 0.013 0.062 \NN5.5 – 6.0 0.007 0.043 \LL
In the above sections, we have presented our model predictions for surveys performed with single-dish (sub)mm telescopes such as the JCMT, for which the arcsec beam causes the galaxy-pair SMGs to be blended into a single source for much of their evolution. If larger single-dish (sub)mm telescopes such as the LMT and CCAT are used, then the galaxy-pair SMGs will be blended for a smaller fraction of the infall stage of the merger. Thus, the duty cycle for the galaxy-pair phase will be shorter and the number counts of the bright sources consequently less. For interferometers with angular resolution arcsec (or kpc at ), such as ALMA, essentially all galaxy-pair SMGs will be resolved into multiple sources because for such separations, the mergers are typically dominated by the starburst mode (H12). Thus, the galaxy pairs would contribute to the number counts as two quiescently star-forming galaxies rather than one blended source.
To predict the counts and redshift distribution of ALMA sources, we modify our model by removing the galaxy-pair contribution and re-distributing those galaxies into the isolated disc subpopulation. The predicted cumulative number counts are shown in Fig. 7, in which the total single-dish counts are also plotted for comparison. The values of the counts and the fractional contributions of the isolated discs and starbursts for various flux bins are given in Table 7. To facilitate comparison with observations, the table includes approximate flux densities for ALMA Bands 6 and 7 calculated using the mean ratios for our simulated SMGs, and .
As for the single-dish counts, the isolated discs dominate at the lowest fluxes ( mJy, or mJy), and the brightest sources are pre-dominantly starbursts. Because the galaxy-pair SMGs are resolved into multiple fainter sources, the cumulative number counts for ALMA-detected SMGs are lower at all fluxes by per cent, and the differential counts should be steeper. (At fluxes fainter than those shown, for which the isolated discs completely dominate and the bright sources contribute negligibly to the cumulative counts, the single-dish and ALMA cumulative counts will be almost identical.) This effect has also been discussed by Kovács et al. (2010) and Smolčić et al. (2012).
The redshift distributions for two flux cuts are shown in Fig. 8, and the values are given in Table 8. The mean redshifts for the 1.5 and 4 mJy ( and 9 mJy) bins are 3.0 and 3.5, respectively. The mean values are almost identical to those for the single-dish counts, and there is also the same tendency for the brightest SMGs to be at higher redshifts. The redshift distributions are similar, but the distribution for the mJy sources is less strongly peaked than for the single-dish sources. The latter’s redshift distribution is more strongly peaked because the redshift distribution of the bright galaxy pairs peaks at .
6 Discussion
6.1 Are modifications to the IMF required to match the observed SMG counts?
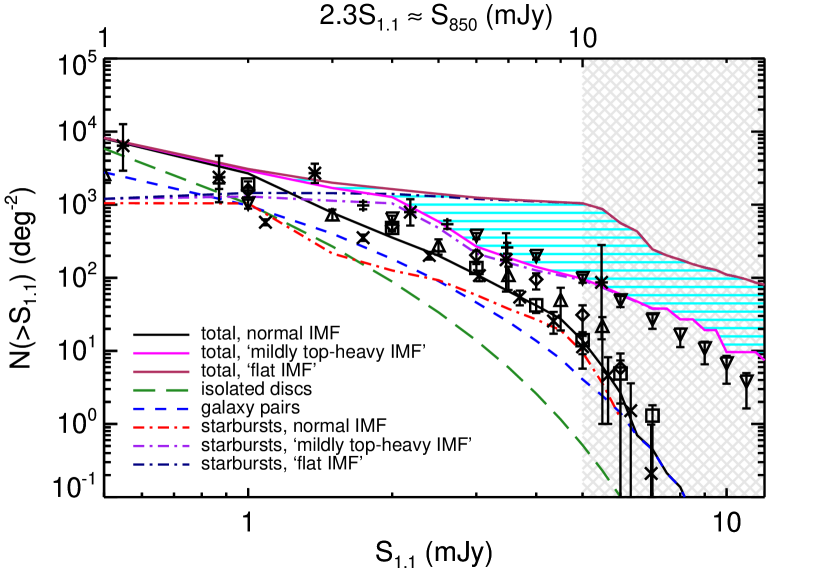
One of the primary motivations for this work is to reexamine the possibility that SMG number counts provide evidence for a flat IMF (B05, Swinbank et al. 2008; Davé et al. 2010). To test this claim, we have assumed the null hypothesis – that the IMF in SMGs does not differ from what is observed locally – and used a Kroupa IMF. Furthermore, our model is constrained to match the present-day mass function – or, more accurately, to not over-produce massive galaxies – by construction; this is an important ‘litmus test’ for putative models of the SMG population. The counts predicted by our model agree well with the observed counts for fields believed not to be significantly affected by gravitational lensing (e.g., Austermann et al. 2010). Thus, our model does not require modifications to the IMF to match the observed counts. As an additional check, we crudely approximate the effect of varying the IMF in starbursts in our model by multiplying the (sub)mm fluxes of our starbursts by factors of 2 (to represent a ‘mildly top-heavy IMF’) and 5 (to represent a ‘flat IMF’, because this is the factor appropriate for the IMF used in B05; G.-L. Granato, private communication).
Fig. 9 shows the range in number counts predicted for this range of IMF variation. This modification causes starbursts to completely dominate the counts for mJy (as is the case for the B05 model), and the predicted counts are significantly greater than most of the observed counts for unlensed SMGs.111111Amusingly, the counts predicted for the ‘mildly top-heavy IMF’ agree well with those of Aretxaga et al. (2011) even though no lensing is included in our model. However, field-dependent IMF variation seems unlikely, so the preferred explanation is still that the Aretxaga et al. (2011) counts are boosted by lensing. (At the lower fluxes, the similarity between the starbursts counts for the various IMF factors is an artificial effect caused by the limited parameter space spanned by our simulation suite. If the suite included mergers of lower-mass galaxies, adopting a top-heavy IMF would cause them to contribute to the counts at these fluxes and thus boost the counts at all fluxes. Furthermore, the strength of the effect at the highest fluxes is underestimated because of the aforementioned artificial cutoff of our starburst counts at mJy; see 5.1 for details.) Applying the ‘flat IMF’ factor causes the model to significantly overpredict all the observed counts for mJy ( mJy), and as explained above, the lack of an effect for lower fluxes is an artificial consequence of our merger simulation suite not including lower-mass galaxies. The clear conclusion is that in our model, significant modification to the IMF in starbursts is unjustified.
Admittedly, the above arguments against IMF variation depend on the details and assumptions of our model. However, there is a much simpler argument against the IMF in starbursts being flat or significantly top-heavy: as discussed above (and in detail in H11 and H12), there is growing observational evidence that a significant fraction of the single-dish-detected SMG population is attributable to multiple sources blended into one (sub)mm source. In some cases, the SMGs are early-stage mergers with components separated by kpc (see Engel et al. 2010 and Riechers et al. 2011a, b for excellent examples). Hydrodynamical simulations suggest that at such separations, a strong starburst is typically not induced (H12); this is consistent with observations of local galaxy pairs (e.g., Scudder et al., 2012). When the galaxies eventually merge, their SFRs will increase by a factor of a few at the least (typically significantly more for major mergers, but we will be conservative) and if the IMF is flat in starbursts, the (sub)mm flux per unit SFR produced will increase by a factor of . Thus, the (sub)mm flux of the galaxies should increase by a factor of during the starburst. The relative duty cycles of the galaxy-pair and starburst phases are similar (to within a factor of a few), so for a given mass and mass ratio, the number density of starbursts and mergers in the galaxy-pair phase should be similar. Thus, if the (sub)mm flux is times greater in the starburst phase than in the quiescently star-forming galaxy-pair phase, mergers during the galaxy-pair phase should contribute negligibly to the bright SMG population, as is the case in Fig. 4, even when a more modest boost (a factor of 2) is used. This is in stark contradiction with observational evidence. Indeed, the existence of the galaxy-pair subpopulation is a natural consequence of starbursts being very inefficient at boosting the (sub)mm flux of merging galaxies (see the discussion in Section 5.2). The only means to circumvent this argument is to argue that the multiple-component SMGs observed are all starbursts, but as explained above, this is unlikely.
The above argument does not rule out the possibility of a mildly top-heavy IMF in starbursts or systematic global evolution of the IMF with redshift (as suggested by, e.g., van Dokkum 2008; Davé 2008; Narayanan & Davé 2012); it only requires that the IMFs in starburst and galaxy-pair SMGs at a given redshift be similar. Furthermore, the argument does not rule out the possibility of a bottom-heavy IMF in starbursts, which has been suggested recently for local massive ellipticals, the descendants of high-z starbursts (e.g., van Dokkum & Conroy, 2010, 2011; Conroy & van Dokkum, 2012; Hopkins, 2012). If the IMF were bottom-heavy in starbursts, the scaling between (sub)mm flux and SFR would be weaker than what we have shown in H11 and here. The weaker scaling would further increase the contribution of galaxy-pair SMGs to the SMG population. Unfortunately, the model and observational uncertainties are sufficiently large that we cannot use the observed galaxy-pair fraction to argue for or against a bottom-heavy IMF in starbursts, but the above arguments suggest that a significantly top-heavy IMF is unlikely.
6.2 Differences between our model and other work
Because we find that, contrary to some previous suggestions (B05, Swinbank et al. 2008; Davé et al. 2010), a top-heavy IMF is not required to match the observed SMG counts, it is worthwhile to examine why our results differ from those works. There are multiple reasons our results may differ: the cosmological context (abundances and merger rates), the evolution of SFR and dust mass for individual mergers, the radiative transfer calculation, the effects of blending, and differences in the observed counts used. We explore these in turn now.
6.2.1 Radiative transfer calculation
In H11, we demonstrated that the (sub)mm flux density of our simulated galaxies can be well parameterized as a power law in SFR and dust mass (see Equations 15 and 16). If the same relation does not hold in the B05 model, then differences in the radiative transfer may be one cause of the discrepancy between our counts and theirs. While we have been unable to compare directly with the B05 model, we have compared our results with those of a SAM that uses a similar radiative transfer treatment (Benson, 2012). We find that relations similar to Equations (15) and (16) hold for the SMGs in the SAM, so it appears that the radiative transfer is not the primary cause of the discrepancy even though some aspects of the radiative transfer differ significantly [e.g., the geometry used in the Sunrise calculations is taken directly from the 3-D Gadget-2 simulations, whereas the geometry assumed by Grasil is analytically specified and azimuthally symmetric; the Grasil calculations include a sub-resolution model for obscuration from the birth clouds around young stars, but we opt not to use the corresponding sub-resolution model that is implemented in Sunrise (Groves et al., 2008) for the reasons discussed in sections 2.2.1 and 4.6 of H11].
Davé et al. (2010) did not perform radiative transfer; instead, they assumed that the most rapidly star-forming galaxies in their simulation were SMGs. However, as noted previously (H11), this simple ansatz is not necessarily true because of differences in dust mass amongst galaxies and the effects of blending. Thus, if dust radiative transfer were performed in or our fitting functions were applied to the Davé et al. (2010) simulations, the conclusions might differ.
6.2.2 Merger evolution
Perhaps the time evolution of the SFR or dust mass in the B05 SAM and our model differs. B05 parameterize the SFR in bursts as , where is the cold gas mass and is a SFR time-scale given by . Here, , is the dynamical time of the newly formed spheroid, and Gyr. The major merger shown in fig. 1 of H11 has when the galaxies are at coalescence. Let us suppose that all the gas is cold. Then, the maximum SFR possible give the B05 prescription is Gyr = 500 , times less than that of the simulation. If the dust mass is kept constant, Equations (15) and (16) imply that a factor of 9 decrease in SFR results in a factor of decrease in (sub)mm flux, which would significantly affect the predicted counts. This is of course only a crude comparison, but it demonstrates that the SFHs of starbursts in the B05 model may disagree with those in our simulations, and differences in the dust content may also be important.
Further evidence that the physical modelling of merger-induced starbursts may account for some of the discrepancy is provided by the different importance of starbursts in the two models. In the B05 model, starbursts dominate the submm counts by a large margin and contribute significantly to the SFR density of the universe; they dominate over quiescently star-forming discs for . In our model, isolated discs dominate the (sub)mm counts at the lowest (sub)mm fluxes and quiescently star-forming galaxy-pair SMGs provide a significant contribution to the bright counts. Furthermore, in our model, merger-induced starbursts account for per cent of the SFR density of the universe at all redshifts (Hopkins et al., 2010c); this is consistent with the starburst-mode contribution inferred from the stellar densities, surface brightness profiles, kinematics, and stellar populations of observed merger remnants (Hopkins et al., 2008b, 2009a, 2009b; Hopkins & Hernquist, 2010).
Differences in the SFHs of mergers may also contribute to the discrepancy between our model and that of Davé et al. (2010). It is not clear that the resolution of the Davé et al. (2010) simulation ( kpc comoving) is sufficient to resolve the tidal torques that drive merger-induced starbursts. If it is not, the SFRs during mergers of their simulated galaxies would be underestimated, and part of the discrepancy between their simulated SMGs’ SFRs and those observed could be attributed to resolution rather than IMF variation. Furthermore, their wind prescription may artificially suppress the SFR enhancement in merger-induced starbursts (Hopkins et al., 2012). Fig. 2 of Davé et al. (2010) shows that all their simulated galaxies lie significantly under the observed SFR- relation, so it is perhaps not surprising that they cannot reproduce the SFRs of SMGs, which are a mix of merger-induced starbursts that are outliers from the SFR- relation and very massive quiescently star-forming galaxies that lie near the relation (H12; Magnelli et al. 2012; Michałowski et al. 2012).
6.2.3 Cosmological context
The third major component of the models that can disagree is the cosmological context, which includes the SMF and merger rates. In Hayward (2012), we demonstrated that the predicted number densities and redshift distribution of isolated disc SMGs are very sensitive to the assumed SMF. Thus, it is worthwhile to compare the SMF in the SAMs to the observationally derived SMF we have used. While a direct comparison of the B05 SMF to those in the literature is complicated by the B05 model’s use of the flat IMF in starbursts (see section 4.2 of Lacey et al. 2010), Swinbank et al. (2008) have shown that the B05 model under-predicts the rest-frame -band fluxes of SMGs, which suggests the masses of their model SMGs are lower than observed. This would be a natural result of an under-prediction of the abundance of massive galaxies.
If the B05 model under-predicts the SMF, then they must compensate by making the starburst contribution significantly higher; they do this by enabling very gas-rich minor mergers to cause strong starbursts (in their model, minor mergers, which only produce a starburst if the most-massive progenitor has baryonic gas fraction greater than 70 per cent, account for approximately three-quarters of the SMG population; González et al. 2011) and by modifying the IMF in starbursts such that for a given SFR, they produce significantly greater submm flux. An under-prediction of the abundance of all massive galaxies and subsequent need to strongly boost the starburst contribution would explain why the relative contributions of starbursts and quiescently star-forming galaxies differ so significantly.
6.2.4 Blending
An additional reason for the discrepancy is that neither B05 nor Davé et al. (2010) account for the blending of multiple galaxies into one (sub)mm source, which can be significant for both merging discs (H11, H12) and physically unrelated galaxies (Wang et al., 2011). Our model suggest that galaxy-pair SMGs can account for per cent of the SMG population attributable to isolated discs and mergers. The types of sources Wang et al. (2011) observed could also be important. Thus, not accounting for blending could account for a factor of discrepancy between the predicted and observed counts.
6.2.5 Revised counts
Finally, B05 compared with and Davé et al. (2010) utilised number counts that have since been superseded by surveys covering significantly larger areas. The new counts are as much as a factor of 2 lower than those of, e.g., Chapman et al. (2005), so the difference in counts is another non-trivial factor that can explain part of the discrepancy between our conclusion and that of some previous works.
6.3 Uncertainties in and limitations of our model
Our model has several advantages: the SEM enables us to isolate possible discrepancies between our model and other work that originate from differences in the dynamical evolution of galaxy mergers and the dust radiative transfer calculation rather than more general issues, such as an overall under-prediction of the SMF at . By constraining the SMF and gas fractions to match observations and including no additional gas in our models, we match the mass function by construction. Because we use 3-D hydrodynamical simulations combined with 3-D dust radiative transfer calculations, we can more accurately calculate the dynamical evolution of galaxies and the (sub)mm flux densities than can either SAMs or cosmological simulations. Furthermore, we conservatively assume a Kroupa IMF rather than invoke ad hoc modifications to the IMF.
However, our model also has several limitations: first, computational constraints prevent us from running simulations scaled to different redshifts. Instead, we scale all initial disc galaxies to . Ideally, we would run simulations with structural parameters and gas fractions scaled to various redshifts because the variation in the galaxies’ physical properties with redshift may cause the (sub)mm light curves to depend on redshift. In future work, we will run a large suite of simulations that will more exhaustively sample the relevant parameter space; such a suite could be used to more accurately predict the SMG counts and redshift distribution. However, because our predicted counts are dominated by galaxies at , our conclusions would likely not differ qualitatively.
Second, to have the resolution necessary to perform accurate radiative transfer on a sufficient number of simulated galaxies, we must use idealised simulations of isolated disc galaxies and mergers rather than cosmological simulations. In principle, including gas supply from cosmological scales (e.g., Kereš et al., 2005) could change the results. However, such gas supply is implicitly included in our model for the isolated discs and galaxy-pair subpopulations because we use observationally derived gas fractions for these subpopulations. Because the duty cycles for mergers are calculated directly from the merger simulations, which do not include additional gas supply, the gas contents, and thus SFRs, of the starburst SMGs could be increased if cosmological simulations were used. However, because the (sub)mm flux density depends only weakly on SFR [a factor of 2 increase in the SFR increases the (sub)mm flux density by per cent; H11], this would not change our results qualitatively. Similarly, differences in the dust content could affect the results, but a factor of 2 decrease in the dust mass decreases the (sub)mm flux density by per cent.
Third, our predictions are affected by uncertainties in the observations used to constrain the model. Of particular importance are uncertainties in the normalisation and shape of the SMF, which are especially significant at . For , the merger rates predicted by our model are uncertain by a factor of , but the uncertainties are higher at higher redshifts. A decrease in the normalisation of the SMF or merger rates would decrease the counts predicted by our model. However, the most interesting conclusions would remain: 1.Galaxy pairs would still provide a significant contribution to the SMG population. 2. Depending on the factor by which the abundances are decreased, a mildly top-heavy IMF might not be ruled out. However, a flat IMF would still over-predict the counts even if the SMF normalisation and merger rates were decreased by times, which is surely an overestimate of the uncertainty.
Fourth, we do not include the contribution from physically unrelated (i.e., non-merging) galaxies blended into a single (sub)mm source. From observations, it is known that such galaxies contribute to the SMG population (Wang et al., 2011). Whether such sources contribute significantly to the population is an open question that should be addressed by obtaining redshifts for SMGs observed with ALMA. If they do contribute significantly, inclusion of this subpopulation would increase the number counts predicted by our model, change the relative contributions of the subpopulations, and potentially alter the redshift distributions; however, this would only strengthen the evidence against a top-heavy IMF.
Finally, we do not model the effects of gravitational lensing. Whereas the fainter sources are likely dominated by un-lensed SMGs, the bright counts ( mJy, or mJy) are likely boosted significantly by lensing (Negrello et al., 2007, 2010; Paciga et al., 2009; Lima et al., 2010; Vieira et al., 2010). Furthermore, the likely cause of the discrepancy between the counts observed by Austermann et al. (2010) and Aretxaga et al. (2011) is that the latter counts are boosted by galaxy–galaxy weak lensing (see the discussion in Aretxaga et al. 2011), so the discrepancy between our predicted counts and the Aretxaga et al. (2011) counts might be resolved if we included the effects of lensing from a foreground overdensity of galaxies. Again, our model predictions are conservative because inclusion of gravitational lensing would boost the counts; thus, inclusion of lensing would strengthen the argument against a top-heavy IMF.
7 Conclusions
We have presented a novel method to predict the number counts and redshift distribution of SMGs. We combined a simple SEM with the results of 3-D hydrodynamical simulations and dust radiative transfer to calculate the contributions of isolated discs, galaxy pairs (i.e., infall-stage mergers), and late-stage merger-induced starbursts to the SMG number counts. Our model is constrained to observations as much as possible; consequently, we are able to isolate the effects of uncertainties related the dynamical evolution of mergers and the dust radiative transfer – which are perhaps uniquely relevant to the SMG population – from more general issues that affect the high-redshift galaxy population as a whole, such as the SMF. Furthermore, we have conservatively used a Kroupa – as opposed to flat or top-heavy – IMF because we wish to test whether we can match the observed counts without modifying the IMF from what is observed locally. Our principal results are:
-
1.
Our fiducial model predicts cumulative number counts that agree very well with those observed for fields thought not to be significantly affected by lensing.
-
2.
Except at the lowest fluxes ( mJy, or mJy), merger-induced starbursts account for the bulk of the population not accounted for by galaxy-pair SMGs, and the brightest sources are pre-dominantly merger-induced starbursts. Thus, isolated discs contribute negligibly to the bright SMG population. The contribution of isolated discs to the SMG population is a robust testable prediction of our model.
-
3.
Contrary to the conventional wisdom, bright SMGs are not exclusively merger-induced starbursts; our model predicts that quiescently star-forming galaxy-pair SMGs account for per cent of SMGs with mJy ( mJy). Though the precise fraction is sensitive to the details of the modelling, the prediction that galaxy pairs contribute significantly to the population (i.e., tens of per cent rather than a few per cent or less) is robust. The observational diagnostics presented in H12 can be used to determine the subset of the SMG population that are quiescently star-forming, thereby testing this prediction of our model.
-
4.
The typical redshifts of the model and observed SMGs are similar, but the model may over-predict the number of SMGs at . This may be because the SMF used in our model over-predicts the number of massive galaxies at those redshifts; thus, observations of the abundance of SMGs at may provide useful constraints on the massive end of the SMF at those redshifts.
-
5.
Because we have not modified the IMF, our results suggest that we cannot reject the null hypothesis that the IMF in high-redshift starbursts is no different than the IMF in local galaxies. A crude test suggests that if we use even a mildly top-heavy IMF in our model, the SMG counts are significantly over-predicted. Thus, we conclude that the observed SMG number counts do not provide evidence for a significantly top-heavy IMF.
-
6.
There are multiple possible reasons our conclusions differ from those of previous work, including differences in the radiative transfer calculations, the merger evolution, and the cosmological context and the lack of a treatment of blending in previous work.
Acknowledgments
We thank Andrew Benson, Romeel Davé, Mark Swinbank, and Naoki Yoshida for comments on the manuscript,
Scott Chapman, Michał Michałowski, Pierluigi Monaco, Alex Pope, Isaac Roseboom,
and Josh Younger for useful discussion, Carlton Baugh, Cedric Lacey, Fabio Fontanot, Gian-Luigi Granato, Vernesa Smolčić,
Axel Weiß, and Min Yun for providing data with which we have compared and for useful discussion, and
Volker Springel for providing the non-public version of Gadget-2 used for this work.
DN acknowledges support from a National Science Foundation Grant (AST-1009452).
DK was supported by NASA through Hubble Fellowship grant HST-HF-51276.01-A.
PJ acknowledges support by a grant from the W. M. Keck Foundation.
The simulations in this paper were performed on the Odyssey cluster supported by the FAS Research Computing Group at Harvard University.
References
- Agertz et al. (2007) Agertz O. et al., 2007, MNRAS, 380, 963
- Almeida et al. (2011) Almeida C., Baugh C. M., Lacey C. G., 2011, MNRAS, 1312
- Aretxaga et al. (2011) Aretxaga I. et al., 2011, MNRAS, 415, 3831
- Asplund et al. (2009) Asplund M., Grevesse N., Sauval A. J., Scott P., 2009, ARA&A, 47, 481
- Austermann et al. (2009) Austermann J. E. et al., 2009, MNRAS, 393, 1573
- Austermann et al. (2010) Austermann J. E. et al., 2010, MNRAS, 401, 160
- Banerji et al. (2011) Banerji M., Chapman S. C., Smail I., Alaghband-Zadeh S., Swinbank A. M., Dunlop J. S., Ivison R. J., Blain A. W., 2011, MNRAS, 418, 1071
- Barger et al. (1998) Barger A. J., Cowie L. L., Sanders D. B., Fulton E., Taniguchi Y., Sato Y., Kawara K., Okuda H., 1998, Nat, 394, 248
- Barnes & Hernquist (1991) Barnes J., Hernquist L., 1991, ApJL, 370, L65
- Barnes & Hernquist (1996) Barnes J., Hernquist L., 1996, ApJ, 471, 115
- Barnes & Hut (1986) Barnes J., Hut P., 1986, Nat, 324, 446
- Bastian et al. (2010) Bastian N., Covey K. R., Meyer M. R., 2010, ARA&A, 48, 339
- Bauer & Springel (2012) Bauer A., Springel V., 2012, MNRAS, 423, 2558
- Baugh et al. (2005) Baugh C. M., Lacey C. G., Frenk C. S., Granato G. L., Silva L., Bressan A., Benson A. J., Cole S., 2005, MNRAS, 356, 1191 (B05)
- Benson (2005) Benson A. J., 2005, MNRAS, 358, 551
- Benson (2012) Benson A. J., 2012, NewAstron, 17, 175
- Béthermin et al. (2012) Béthermin M. et al., 2012, arXiv:1208.6512
- Biggs & Ivison (2008) Biggs A. D., Ivison R. J., 2008, MNRAS, 385, 893
- Blain et al. (1999a) Blain A. W., Jameson A., Smail I., Longair M. S., Kneib J.-P., Ivison R. J., 1999a, MNRAS, 309, 715
- Blain et al. (1999b) Blain A. W., Smail I., Ivison R. J., Kneib J.-P., 1999b, MNRAS, 302, 632
- Blain et al. (2002) Blain A. W., Smail I., Ivison R. J., Kneib J.-P., Frayer D. T., 2002, PhysRep, 369, 111
- Bondi (1952) Bondi H., 1952, MNRAS, 112, 195
- Bondi & Hoyle (1944) Bondi H., Hoyle F., 1944, MNRAS, 104, 273
- Bothwell et al. (2010) Bothwell M. S. et al., 2010, MNRAS, 405, 219
- Bothwell et al. (2012) Bothwell M. S. et al., 2012, arXiv:1205.1511
- Bouché et al. (2007) Bouché N. et al., 2007, ApJ, 671, 303
- Bower et al. (2010) Bower R. G., Vernon I., Goldstein M., Benson A. J., Lacey C. G., Baugh C. M., Cole S., Frenk C. S., 2010, MNRAS, 407, 2017
- Brammer et al. (2011) Brammer G. B. et al., 2011, ApJ, 739, 24
- Bush et al. (2010) Bush S. J., Cox T. J., Hayward C. C., Thilker D., Hernquist L., Besla G., 2010, ApJ, 713, 780
- Capak et al. (2008) Capak P. et al., 2008, ApJL, 681, L53
- Carilli et al. (2010) Carilli C. L. et al., 2010, ApJ, 714, 1407
- Chapin et al. (2009) Chapin E. L. et al., 2009, MNRAS, 398, 1793
- Chapman et al. (2005) Chapman S. C., Blain A. W., Smail I., Ivison R. J., 2005, ApJ, 622, 772
- Chapman et al. (2010) Chapman S. C. et al., 2010, MNRAS, 409, L13
- Chapman et al. (2003) Chapman S. C., Windhorst R., Odewahn S., Yan H., Conselice C., 2003, ApJ, 599, 92
- Clements et al. (2008) Clements D. L. et al., 2008, MNRAS, 387, 247
- Cole et al. (2000) Cole S., Lacey C. G., Baugh C. M., Frenk C. S., 2000, MNRAS, 319, 168
- Conroy & van Dokkum (2012) Conroy C., van Dokkum P., 2012, arXiv:1205.6473
- Conroy & Wechsler (2009) Conroy C., Wechsler R. H., 2009, ApJ, 696, 620
- Coppin et al. (2006) Coppin K. et al., 2006, MNRAS, 372, 1621
- Coppin et al. (2008) Coppin K. et al., 2008, MNRAS, 384, 1597
- Cox et al. (2006a) Cox T. J., Dutta S. N., Matteo T. D., Hernquist L., Hopkins P. F., Robertson B., Springel V., 2006a, ApJ, 650, 791
- Cox et al. (2006b) Cox T. J., Jonsson P., Primack J. R., Somerville R. S., 2006b, MNRAS, 373, 1013
- Daddi et al. (2010) Daddi E. et al., 2010, ApJ, 713, 686
- Dale et al. (2007) Dale D. A. et al., 2007, ApJ, 655, 863
- Davé (2008) Davé R., 2008, MNRAS, 385, 147
- Davé et al. (2010) Davé R., Finlator K., Oppenheimer B. D., Fardal M., Katz N., Kereš D., Weinberg D. H., 2010, MNRAS, 404, 1355
- De Lucia et al. (2010) De Lucia G., Boylan-Kolchin M., Benson A. J., Fontanot F., Monaco P., 2010, MNRAS, 406, 1533
- Dekel et al. (2009) Dekel A. et al., 2009, Nat, 457, 451
- Devriendt & Guiderdoni (2000) Devriendt J. E. G., Guiderdoni B., 2000, A&A, 363, 851
- Di Matteo et al. (2005) Di Matteo T., Springel V., Hernquist L., 2005, Nat, 433, 604
- Draine & Li (2007) Draine B. T., Li A., 2007, ApJ, 657, 810
- Dwek (1998) Dwek E., 1998, ApJ, 501, 643
- Eales et al. (1999) Eales S., Lilly S., Gear W., Dunne L., Bond J. R., Hammer F., Fèvre O. L., Crampton D., 1999, ApJ, 515, 518
- Elmegreen (2004) Elmegreen B. G., 2004, MNRAS, 354, 367
- Elmegreen & Shadmehri (2003) Elmegreen B. G., Shadmehri M., 2003, MNRAS, 338, 817
- Engel et al. (2010) Engel H. et al., 2010, ApJ, 724, 233
- Erb et al. (2006) Erb D. K., Steidel C. C., Shapley A. E., Pettini M., Reddy N. A., Adelberger K. L., 2006, ApJ, 646, 107
- Fardal et al. (2001) Fardal M. A., Katz N., Weinberg D. H., Davé R., Hernquist L., 2001, astro-ph/0107290
- Fontana et al. (2006) Fontana A. et al., 2006, A&A, 459, 745
- Fontanot et al. (2009) Fontanot F., De Lucia G., Monaco P., Somerville R. S., Santini P., 2009, MNRAS, 397, 1776
- Fontanot & Monaco (2010) Fontanot F., Monaco P., 2010, MNRAS, 405, 705
- Fontanot et al. (2007) Fontanot F., Monaco P., Silva L., Grazian A., 2007, MNRAS, 382, 903
- Genzel et al. (2010) Genzel R. et al., 2010, MNRAS, 407, 2091
- Gingold & Monaghan (1977) Gingold R. A., Monaghan J. J., 1977, MNRAS, 181, 375
- González et al. (2011) González J. E., Lacey C. G., Baugh C. M., Frenk C. S., 2011, MNRAS, 413, 749
- Granato et al. (2004) Granato G. L., De Zotti G., Silva L., Bressan A., Danese L., 2004, ApJ, 600, 580
- Granato et al. (2000) Granato G. L., Lacey C. G., Silva L., Bressan A., Baugh C. M., Cole S., Frenk C. S., 2000, ApJ, 542, 710
- Greve et al. (2005) Greve T. R. et al., 2005, MNRAS, 359, 1165
- Groves et al. (2008) Groves B., Dopita M. A., Sutherland R. S., Kewley L. J., Fischera J., Leitherer C., Brandl B., van Breugel W., 2008, ApJS, 176, 438
- Guiderdoni et al. (1998) Guiderdoni B., Hivon E., Bouchet F. R., Maffei B., 1998, MNRAS, 295, 877
- Hainline et al. (2011) Hainline L. J., Blain A. W., Smail I., Alexander D. M., Armus L., Chapman S. C., Ivison R. J., 2011, ApJ, 740, 96
- Hatsukade et al. (2011) Hatsukade B. et al., 2011, MNRAS, 411, 102
- Hayward (2012) Hayward C. C., 2012, PhD thesis, Harvard University
- Hayward et al. (2012) Hayward C. C., Jonsson P., Kereš D., Magnelli B., Hernquist L., Cox T. J., 2012, MNRAS, arXiv:1203.1318 (H12)
- Hayward et al. (2011a) Hayward C. C., Kereš D., Jonsson P., Narayanan D., Cox T. J., Hernquist L., 2011a, ApJ, 743, 159 (H11)
- Hayward et al. (2011b) Hayward C. C., Narayanan D., Jonsson P., Cox T. J., Kereš D., Hopkins P. F., Hernquist L., 2011b, in ASP Conf. Ser. 440, Have Observations Revealed a Variable Upper End of the Initial Mass Function?, M. Treyer, T. Wyder, J. Neill, M. Seibert, & J. Lee, ed., ASP, San Francisco, CA, p. 369
- Hernquist (1989) Hernquist L., 1989, Nat, 340, 687
- Hernquist (1990) Hernquist L., 1990, ApJ, 356, 359
- Hernquist & Katz (1989) Hernquist L., Katz N., 1989, ApJS, 70, 419
- Hopkins (2012) Hopkins P. F., 2012, arXiv:1204.2835
- Hopkins et al. (2010a) Hopkins P. F. et al., 2010a, ApJ, 715, 202
- Hopkins et al. (2009a) Hopkins P. F., Cox T. J., Dutta S. N., Hernquist L., Kormendy J., Lauer T. R., 2009a, ApJS, 181, 135
- Hopkins et al. (2012) Hopkins P. F., Cox T. J., Hernquist L., Narayanan D., Hayward C. C., Murray N., 2012, arXiv:1206.0011
- Hopkins et al. (2008a) Hopkins P. F., Cox T. J., Kereš D., Hernquist L., 2008a, ApJS, 175, 390
- Hopkins et al. (2010b) Hopkins P. F. et al., 2010b, ApJ, 724, 915
- Hopkins & Hernquist (2010) Hopkins P. F., Hernquist L., 2010, MNRAS, 402, 985
- Hopkins et al. (2008b) Hopkins P. F., Hernquist L., Cox T. J., Dutta S. N., Rothberg B., 2008b, ApJ, 679, 156
- Hopkins et al. (2008c) Hopkins P. F., Hernquist L., Cox T. J., Kereš D., 2008c, ApJS, 175, 356
- Hopkins et al. (2009b) Hopkins P. F., Lauer T. R., Cox T. J., Hernquist L., Kormendy J., 2009b, ApJS, 181, 486
- Hopkins et al. (2007) Hopkins P. F., Richards G. T., Hernquist L., 2007, ApJ, 654, 731
- Hopkins et al. (2010c) Hopkins P. F., Younger J. D., Hayward C. C., Narayanan D., Hernquist L., 2010c, MNRAS, 402, 1693
- Hoyle & Lyttleton (1939) Hoyle F., Lyttleton R. A., 1939, Proc. Cam. Philos. Soc., 35, 405
- Hughes et al. (1998) Hughes D. H. et al., 1998, Nat, 394, 241
- Ilbert et al. (2010) Ilbert O. et al., 2010, ApJ, 709, 644
- Iono et al. (2009) Iono D. et al., 2009, ApJ, 695, 1537
- Ivison et al. (2007) Ivison R. J. et al., 2007, MNRAS, 380, 199
- Ivison et al. (2002) Ivison R. J. et al., 2002, MNRAS, 337, 1
- Ivison et al. (2010) Ivison R. J., Smail I., Papadopoulos P. P., Wold I., Richard J., Swinbank A. M., Kneib J., Owen F. N., 2010, MNRAS, 404, 198
- James et al. (2002) James A., Dunne L., Eales S., Edmunds M. G., 2002, MNRAS, 335, 753
- Jonsson et al. (2006) Jonsson P., Cox T. J., Primack J. R., Somerville R. S., 2006, ApJ, 637, 255
- Jonsson et al. (2010) Jonsson P., Groves B. A., Cox T. J., 2010, MNRAS, 403, 17
- Jonsson & Primack (2010) Jonsson P., Primack J. R., 2010, New Astron., 15, 509
- Katz et al. (1996) Katz N., Weinberg D. H., Hernquist L., 1996, ApJS, 105, 19
- Kaviani et al. (2003) Kaviani A., Haehnelt M. G., Kauffmann G., 2003, MNRAS, 340, 739
- Kennicutt (1998) Kennicutt R. C., 1998, ApJ, 498, 541
- Kennicutt et al. (2003) Kennicutt R. C. et al., 2003, PASP, 115, 928
- Kennicutt (1983) Kennicutt, Jr. R. C., 1983, ApJ, 272, 54
- Kereš et al. (2005) Kereš D., Katz N., Weinberg D. H., Davé R., 2005, MNRAS, 363, 2
- Kereš et al. (2012) Kereš D., Vogelsberger M., Sijacki D., Springel V., Hernquist L., 2012, MNRAS, 425, 2027
- Kewley & Ellison (2008) Kewley L. J., Ellison S. L., 2008, ApJ, 681, 1183
- Khochfar & Burkert (2006) Khochfar S., Burkert A., 2006, A&A, 445, 403
- Knudsen et al. (2008) Knudsen K. K., van der Werf P. P., Kneib J.-P., 2008, MNRAS, 384, 1611
- Kovács et al. (2006) Kovács A., Chapman S. C., Dowell C. D., Blain A. W., Ivison R. J., Smail I., Phillips T. G., 2006, ApJ, 650, 592
- Kovács et al. (2010) Kovács A. et al., 2010, ApJ, 717, 29
- Kroupa (2001) Kroupa P., 2001, MNRAS, 322, 231
- Krumholz & Thompson (2007) Krumholz M. R., Thompson T. A., 2007, ApJ, 669, 289
- Lacey et al. (2010) Lacey C. G., Baugh C. M., Frenk C. S., Benson A. J., Orsi A., Silva L., Granato G. L., Bressan A., 2010, MNRAS, 405, 2
- Lacey et al. (2008) Lacey C. G., Baugh C. M., Frenk C. S., Silva L., Granato G. L., Bressan A., 2008, MNRAS, 385, 1155
- Lagache et al. (2003) Lagache G., Dole H., Puget J.-L., 2003, MNRAS, 338, 555
- Larson (1998) Larson R. B., 1998, MNRAS, 301, 569
- Larson (2005) Larson R. B., 2005, MNRAS, 359, 211
- Leitherer et al. (1999) Leitherer C. et al., 1999, ApJS, 123, 3
- Lima et al. (2010) Lima M., Jain B., Devlin M., Aguirre J., 2010, ApJL, 717, L31
- Lo Faro et al. (2009) Lo Faro B., Monaco P., Vanzella E., Fontanot F., Silva L., Cristiani S., 2009, MNRAS, 399, 827
- Lonsdale et al. (2006) Lonsdale C. J., Farrah D., Smith H. E., 2006, Ultraluminous Infrared Galaxies, Springer Verlag, p. 285
- Lu et al. (2012) Lu Y., Mo H. J., Katz N., Weinberg M. D., 2012, MNRAS, 2380
- Lu et al. (2011) Lu Y., Mo H. J., Weinberg M. D., Katz N., 2011, MNRAS, 416, 1949
- Lucy (1977) Lucy L. B., 1977, AJ, 82, 1013
- Magnelli et al. (2010) Magnelli B. et al., 2010, A&A, 518, L28
- Magnelli et al. (2012) Magnelli B. et al., 2012, A&A, 539, A155
- Maiolino et al. (2008) Maiolino R. et al., 2008, A&A, 488, 463
- Marchesini et al. (2009) Marchesini D., van Dokkum P. G., Förster Schreiber N. M., Franx M., Labbé I., Wuyts S., 2009, ApJ, 701, 1765
- Michałowski et al. (2012) Michałowski M. J., Dunlop J. S., Cirasuolo M., Hjorth J., Hayward C. C., Watson D., 2012, A&A, 541, A85
- Michałowski et al. (2010) Michałowski M. J., Hjorth J., Watson D., 2010, A&A, 514, A67
- Mihos & Hernquist (1996) Mihos J. C., Hernquist L., 1996, ApJ, 464, 641
- Narayanan et al. (2012a) Narayanan D., Bothwell M., Davé R., 2012a, arXiv:1209.0771
- Narayanan et al. (2011) Narayanan D., Cox T. J., Hayward C. C., Hernquist L., 2011, MNRAS, 412, 287
- Narayanan et al. (2009) Narayanan D., Cox T. J., Hayward C. C., Younger J. D., Hernquist L., 2009, MNRAS, 400, 1919
- Narayanan et al. (2008) Narayanan D., Cox T. J., Hernquist L., 2008, ApJL, 681, L77
- Narayanan et al. (2008) Narayanan D., Cox T. J., Shirley Y., Davé R., Hernquist L., Walker C. K., 2008, ApJ, 684, 996
- Narayanan & Davé (2012) Narayanan D., Davé R., 2012, MNRAS, 3122
- Narayanan et al. (2010a) Narayanan D. et al., 2010a, MNRAS, 407, 1701
- Narayanan et al. (2010b) Narayanan D., Hayward C. C., Cox T. J., Hernquist L., Jonsson P., Younger J. D., Groves B., 2010b, MNRAS, 401, 1613
- Narayanan et al. (2012b) Narayanan D., Krumholz M. R., Ostriker E. C., Hernquist L., 2012b, MNRAS, 421, 3127
- Negrello et al. (2010) Negrello M. et al., 2010, Science, 330, 800
- Negrello et al. (2007) Negrello M., Perrotta F., González-Nuevo J., Silva L., de Zotti G., Granato G. L., Baccigalupi C., Danese L., 2007, MNRAS, 377, 1557
- Neri et al. (2003) Neri R. et al., 2003, ApJ, 597, L113
- Paciga et al. (2009) Paciga G., Scott D., Chapin E. L., 2009, MNRAS, 395, 1153
- Pearson & Rowan-Robinson (1996) Pearson C., Rowan-Robinson M., 1996, MNRAS, 283, 174
- Pope et al. (2006) Pope A. et al., 2006, MNRAS, 370, 1185
- Ricciardelli et al. (2010) Ricciardelli E., Trujillo I., Buitrago F., Conselice C. J., 2010, MNRAS, 406, 230
- Riechers et al. (2011a) Riechers D. A. et al., 2011a, ApJL, 733, L11
- Riechers et al. (2011b) Riechers D. A., Hodge J., Walter F., Carilli C. L., Bertoldi F., 2011b, ApJL, 739, L31
- Robertson et al. (2006) Robertson B., Hernquist L., Cox T. J., Matteo T. D., Hopkins P. F., Martini P., Springel V., 2006, ApJ, 641, 90
- Roseboom et al. (2012) Roseboom I. G. et al., 2012, MNRAS, 419, 2758
- Savaglio et al. (2005) Savaglio S. et al., 2005, ApJ, 635, 260
- Schmidt (1959) Schmidt M., 1959, ApJ, 129, 243
- Scott et al. (2010) Scott K. S. et al., 2010, MNRAS, 405, 2260
- Scudder et al. (2012) Scudder J. M., Ellison S. L., Torrey P., Patton D. R., Mendel J. T., 2012, arXiv:1207.4791
- Shimizu et al. (2012) Shimizu I., Yoshida N., Okamoto T., 2012, arXiv:1207.3856
- Sijacki et al. (2012) Sijacki D., Vogelsberger M., Kereš D., Springel V., Hernquist L., 2012, MNRAS, 424, 2999
- Silva et al. (1998) Silva L., Granato G. L., Bressan A., Danese L., 1998, ApJ, 509, 103
- Smail et al. (2004) Smail I., Chapman S. C., Blain A. W., Ivison R. J., 2004, ApJ, 616, 71
- Smail et al. (1997) Smail I., Ivison R. J., Blain A. W., 1997, ApJL, 490, L5
- Smolčić et al. (2012) Smolčić V. et al., 2012, arXiv:1205.6470
- Snyder et al. (2011) Snyder G. F., Cox T. J., Hayward C. C., Hernquist L., Jonsson P., 2011, ApJ, 741, 77
- Somerville et al. (2008) Somerville R. S. et al., 2008, ApJ, 672, 776
- Springel (2005) Springel V., 2005, MNRAS, 364, 1105
- Springel (2010) Springel V., 2010, MNRAS, 401, 791
- Springel (2010) Springel V., 2010, ARA&A, 48, 391
- Springel et al. (2005) Springel V., Di Matteo T., Hernquist L., 2005, MNRAS, 361, 776
- Springel & Hernquist (2002) Springel V., Hernquist L., 2002, MNRAS, 333, 649
- Springel & Hernquist (2003) Springel V., Hernquist L., 2003, MNRAS, 339, 289
- Springel et al. (2001) Springel V., Yoshida N., White S. D. M., 2001, NewA, 6, 79
- Swinbank et al. (2008) Swinbank A. M. et al., 2008, MNRAS, 391, 420
- Swinbank et al. (2004) Swinbank A. M., Smail I., Chapman S. C., Blain A. W., Ivison R. J., Keel W. C., 2004, ApJ, 617, 64
- Tacconi et al. (2008) Tacconi L. J. et al., 2008, ApJ, 680, 246
- Tacconi et al. (2006) Tacconi L. J. et al., 2006, ApJ, 640, 228
- Targett et al. (2012) Targett T. A. et al., 2012, arXiv:1208.3464
- Targett et al. (2011) Targett T. A., Dunlop J. S., McLure R. J., Best P. N., Cirasuolo M., Almaini O., 2011, MNRAS, 412, 295
- Torrey et al. (2011) Torrey P., Vogelsberger M., Sijacki D., Springel V., Hernquist L., 2011, arXiv:1110.5635
- Tremonti et al. (2004) Tremonti C. A. et al., 2004, ApJ, 613, 898
- van Dokkum (2008) van Dokkum P. G., 2008, ApJ, 674, 29
- van Dokkum & Conroy (2010) van Dokkum P. G., Conroy C., 2010, Nat, 468, 940
- van Dokkum & Conroy (2011) van Dokkum P. G., Conroy C., 2011, ApJL, 735, L13
- Vieira et al. (2010) Vieira J. D. et al., 2010, ApJ, 719, 763
- Viola et al. (2008) Viola M., Monaco P., Borgani S., Murante G., Tornatore L., 2008, MNRAS, 383, 777
- Vogelsberger et al. (2011) Vogelsberger M., Sijacki D., Kereš D., Springel V., Hernquist L., 2011, arXiv:1109.1281
- Wang et al. (2011) Wang W.-H., Cowie L. L., Barger A. J., Williams J. P., 2011, ApJL, 726, L18
- Wardlow et al. (2011) Wardlow J. L. et al., 2011, MNRAS, 415, 1479
- Weingartner & Draine (2001) Weingartner J. C., Draine B. T., 2001, ApJ, 548, 296
- Weiß et al. (2009) Weiß A. et al., 2009, ApJ, 707, 1201
- Whitaker et al. (2012) Whitaker K. E., van Dokkum P. G., Brammer G., Franx M., 2012, ApJL, 754, L29
- Wilson et al. (2008) Wilson G. W. et al., 2008, MNRAS, 386, 807
- Wuyts et al. (2010) Wuyts S., Cox T. J., Hayward C. C., Franx M., Hernquist L., Hopkins P. F., Jonsson P., van Dokkum P. G., 2010, ApJ, 722, 1666
- Wuyts et al. (2011) Wuyts S. et al., 2011, ApJ, 742, 96
- Wuyts et al. (2009) Wuyts S. et al., 2009, ApJ, 700, 799
- Younger et al. (2010) Younger J. D. et al., 2010, MNRAS, 407, 1268
- Younger et al. (2008) Younger J. D. et al., 2008, ApJ, 688, 59
- Younger et al. (2009) Younger J. D., Hayward C. C., Narayanan D., Cox T. J., Hernquist L., Jonsson P., 2009, MNRAS, 396, L66
- Yun et al. (2012) Yun M. S. et al., 2012, MNRAS, 420, 957
- Zemcov et al. (2010) Zemcov M., Blain A., Halpern M., Levenson L., 2010, ApJ, 721, 424