Magnetic Flux of EUV Arcade and Dimming Regions as a Relevant Parameter for Early Diagnostics of Solar Eruptions – Sources of Non-Recurrent Geomagnetic Storms and Forbush Decreases
Abstract
This study aims at the early diagnostics of geoeffectiveness of coronal mass ejections (CMEs) from quantitative parameters of the accompanying EUV dimming and arcade events. We study events of the 23th solar cycle, in which major non-recurrent geomagnetic storms (GMS) with Dst nT are sufficiently reliably identified with their solar sources in the central part of the disk. Using the SOHO/EIT 195 Å images and MDI magnetograms, we select significant dimming and arcade areas and calculate summarized unsigned magnetic fluxes in these regions at the photospheric level. The high relevance of this eruption parameter is displayed by its pronounced correlation with the Forbush decrease (FD) magnitude, which, unlike GMSs, does not depend on the sign of the component but is determined by global characteristics of ICMEs. Correlations with the same magnetic flux in the solar source region are found for the GMS intensity (at the first step, without taking into account factors determining the component near the Earth), as well as for the temporal intervals between the solar eruptions and the GMS onset and peak times. The larger the magnetic flux, the stronger the FD and GMS intensities are and the shorter the ICME transit time is. The revealed correlations indicate that the main quantitative characteristics of major non-recurrent space weather disturbances are largely determined by measurable parameters of solar eruptions, in particular, by the magnetic flux in dimming areas and arcades, and can be tentatively estimated in advance with a lead time from 1 to 4 days. For GMS intensity, the revealed dependencies allow one to estimate a possible value, which can be expected if the component is negative.
keywords:
Solar eruptions; Coronal mass ejections; Coronal dimmings; Arcades; Magnetic fields; Forbush Decreases; Geomagnetic storms1 Introduction
S-introduction
Coronal mass ejections (CMEs) are the most grandiose manifestation of the solar activity in terms of their size, energy, and space weather effects (e.g., \openciteKunow2006; \openciteGopalswamy2010; and references therein). They are connected with large-scale magnetic rearrangements in the solar atmosphere and expel a bulk of magnetized plasma into the interplanetary space. CMEs and their interplanetary counterparts ICMEs are prime drivers of the most severe non-recurrent space weather disturbances, in particular such important and strongly effective ones as major geomagnetic storms (GMSs) [Gosling (1993), Bothmer and Zhukov (2007), Gopalswamy (2009)]. The latter occur when large and fast CMEs erupt mainly from the central region of the visible solar disk as a partial or full halo CME and the corresponding ICMEs bring to the Earth a sufficiently strong and prolonged southward (negative) magnetic field component either in the flux rope or in the sheath between the flux rope and the ICME-driven shock. Simultaneously the magnetized ICMEs deflect galactic cosmic rays entering the heliosphere and cause reduction of their intensity measured at the Earth and in the near-Earth space called non-recurrent Forbush decreases (FDs) [Cane (2000), Belov (2009), Richardson and Cane (2011)]. There are also generally less intense recurrent GMSs and FDs caused by corotating interaction regions (CIRs) which are formed as a result of interaction between the fast solar wind from coronal holes and the preceding slow wind from closed magnetic structures [Richardson et al. (2006), Zhang et al. (2007a)]. We will concentrate below just on the non-recurrent GMSs and FDs leaving the recurrent ones beyond the scope of our consideration.
1.1 Existing Diagnostic Methods
One of the most important tasks of the solar-terrestrial physics and space weather prediction is diagnostics of geoeffectiveness of CMEs, i.e., quantitative forecast of a possible non-recurrent GMSs and FDs from observed characteristics of the eruption that just occurred. Existing algorithms of such diagnostics are based in one way or another on the measurements of the CME speed and shape in the plane of the sky in the near-Sun region from the data of SOHO/LASCO [Brueckner et al. (1995)]. A number of direct empirical relations have been established between the projected or deprojected CME expansion speed and transit time, i.e., an interval between the moments of a CME eruption from the Sun and ICME arrival to 1 AU [Gopalswamy et al. (2001), Siscoe and Schwenn (2006), Xie et al. (2006), Kim, Moon, and Cho (2007), Gopalswamy and Xie (2008), Michalek, Gopalswamy, and Yashiro (2008)]. As for the GMS intensity, it strongly depends on the magnetic field strength and orientation in the corresponding ICME. The required presence of the southern component can be generally determined from the orientation of the magnetic field in the CME source region, from the shape (S or inverse S) of the pre-eruption X-ray sigmoid, from the orientation angle of elongated LASCO CME and post-eruption arcade, as well as from the local tilt of the coronal neutral line at 2.5 solar radii [Kang et al. (2006), Song et al. (2006), Yurchyshyn and Tripathi (2009)].
In empirical algorithms for the forecast of the GMS intensity, the same near-Sun CME speeds are also used as one of the main input parameters. The corresponding algorithms are also combinations of several methods. For example, in the algorithm of \inlineciteYurchyshyn2004 (see also \openciteYurchyshyn2005), the expected magnitude of the component in ICMEs near the Earth is firstly estimated by established correlation with the projected CME speed, and then a statistically revealed relationship between and the Dst geomagnetic index is used. Recently \inlineciteKim2010 presented empirical expressions for the Dst index calculated from the plane-of-the-sky CME speed, direction parameter, and (heliographic) longitude for two CME groups depending on whether the magnetic fields are oriented southward or northward in their source regions.
In addition to the empirical/statistical tools, some analytical models and numerical MHD simulations have been developed particularly for forecasting of the ICME arrival time at 1 AU (e.g., \openciteSiscoeSchwenn2006; \openciteSmith2009; \openciteTaktakishvili2009; \openciteVrsnak2010; and references therein). Again, the near-Sun CME characteristics and some additional data are used as input parameters in the models describing the ICME-driven shock propagation in the solar wind taking into account the ‘aerodynamic’ drag, interaction with CIRs, and other effects.
With the advent of the STEREO era [Kaiser et al. (2008)] it has become possible to trace propagation of the Earth-directed CMEs in the corona and ICMEs in the interplanetary space from three vantage points simultaneously (with two STEREO and SOHO spacecraft) and to use stereoscopic methods for reconstruction of the 3D trajectory, angular width, and speed of the corresponding ICMEs (e.g., \openciteLiu2010; \openciteLugaz2010; \openciteWood2011). Valuable information about ICMEs and their geoefficiency is also obtained from multi-point interplanetary scintillation (IPS) radio measurements and observations with the Solar Mass Ejection Imager [Jackson et al. (2004)], especially in combination with the SOHO and twin-spacecraft STEREO data (e.g., \openciteJackson2009; \openciteWebb2009; \openciteManoharan2010). Nevertheless, diagnostics of CMEs from observations of their low-corona signatures remains a very urgent topic, because it can provide the earliest alert on geoeffectiveness of solar eruptions.
1.2 Background for EUV/Magnetic Diagnostics
In this paper, we present a new approach to the early diagnostics of solar eruptions in which quantitative characteristics of such large-scale CME manifestations as dimming and formation of post-eruption (PE) arcades observed in the extreme ultraviolet (EUV) range are used as key parameters instead of the projected CME speed and shape. The idea of such an approach was proposed by \inlineciteChertokGrechnev2006. The total (unsigned) magnetic flux of the longitudinal field at the photospheric level within the dimming and arcade areas is considered as a main quantitative parameter of eruptions. The magnetic flux of a CME can be possibly somewhat less than the whole magnetic flux in dimming and arcade regions (see, e.g., \openciteGibsonFan2008). However, such a total unsigned flux can actually serve as a measure of the erupting flux. For simplicity, we will call the total unsigned magnetic flux in dimming and arcade areas at the photospheric level the ‘eruptive magnetic flux’ or ‘eruption parameter’.
Dimmings are CME-associated regions in which the EUV (and soft X-ray as well) brightness of coronal structures is temporarily reduced during an ejection and persists over many hours. Deep and extended core dimmings are formed near the center of an eruption, and additional remote dimmings can also be observed at a large part of the solar surface [Thompson et al. (1998), Hudson and Cliver (2001), Harra et al. (2011)]. The deepest stationary long-lived dimmings adjacent to the eruption center are interpreted mainly as a result of plasma outflow from the footpoints of erupting and expanding CME flux ropes [Sterling and Hudson (1997), Webb et al. (2000)]. It is noteworthy that, as near-the-limb eruptions reveal, the extent of the dimming area corresponds to the apparent angular size of the corresponding CME observed with white-light coronagraphs [Thompson et al. (2000)].
Large-scale arcades of bright loops enlarging in size over time arise at the place of the main body of pre-eruption magnetic flux ropes ejected as CMEs [Kahler (1977), Sterling et al. (2000), Hudson and Cliver (2001), Tripathi, Bothmer, and Cremades (2004)]. Such arcades with extended emitting ribbons in their bases are formed in active regions above magnetic neutral lines under erupting magnetic flux ropes, which then develop into CMEs. While the core dimmings correspond to footpoints of the erupted flux ropes, the PE arcades can be considered as counterparts of the central flaring part of these flux ropes. As a whole, dimmings and PE arcades visualize structures and areas involved in the process of the CME eruption. This gives reasons to expect that their quantitative parameters, in particular magnetic fluxes, can be relevant and promising for early quantitative evaluations of geoeffectiveness of the corresponding ICMEs.
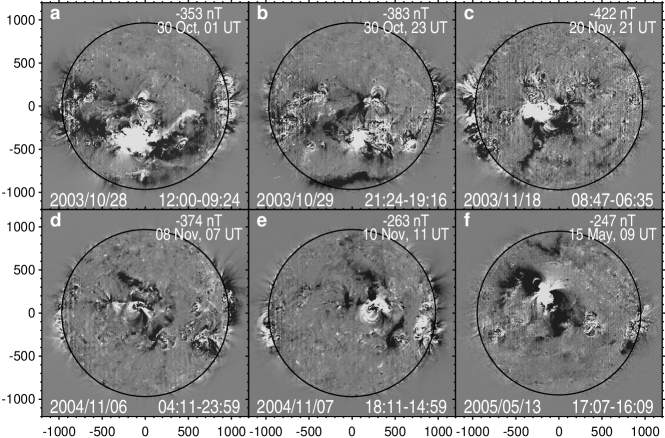
Figure \irefF-fig1 shows the dimmings and PE arcades accompanying the eruptions which were the sources of the strongest GMSs of the solar cycle 23, as they look like in the derotated difference images of the EUV telescope SOHO/EIT [Delaboudinière et al. (1995)] in the 195 Å channel. This figure illustrates that large eruptions can be global in nature and probably involve octopus-like bundles of magnetic ropes anchored in several interconnected active regions [Chertok and Grechnev (2005), Zhang et al. (2007c), Zhukov and Veselovsky (2007)].
Until now in the space weather aspect, the qualitative information about dimmings and arcades was mainly used as a tool for identification of frontside CMEs originating in eruptions on the visible solar disk and to distinguish them from backside halo CMEs [Zhukov (2005)]. Further, the majority of full and partial halo CMEs are elongated in the direction of the axial field of the PE arcades that can give an indication in advance about the sign of the component in the associated ICMEs near the Earth [Yurchyshyn and Tripathi (2009)]. As for quantitative parameters, there are some studies in which the photospheric magnetic flux in dimming regions was calculated for limited samples of events and compared with the model magnetic flux in ICMEs, particularly in their magnetic cloud variety, computed from in situ measurements at 1 AU (see \openciteDemoulin2008; \openciteMandrini2009 for a review).
1.3 Outline
The main points of our approach and their presentation in this paper are as follows:
-
•
The eruptions from the central zone of the disk occurring throughout the solar cycle 23 responsible for major non-recurrent GMSs of the disturbance storm time index Dst nT, are considered.
-
•
The photospheric magnetic fluxes not only in dimming, but also in PE arcades are considered. This is in agreement with the conclusion of \inlineciteMandrini2007 and \inlineciteQiu2007 that the magnetic flux in the dimming area only is not sufficient to account for the observed ICME flux. The data and selection method of the dimming and arcade areas as well as the computation procedure of the summarized unsigned magnetic flux within them as a measure of the ejected CME flux are described in Section \irefS-data_technique.
-
•
Bearing in mind the forecast as a result of the analysis, the eruptive fluxes are correlated directly with the magnitude of FDs, intensity of GMSs and transit times, omitting comparison with the ICME parameters near the Earth.
-
•
To test the efficiency of our approach, it is reasonable to begin with a correlation between eruptive magnetic fluxes and FD magnitudes (Section \irefS-forbush_decreases) since the intensity of GMSs strongly depends on the component in a relatively local ICME part interacting directly with the Earth’s magnetosphere, while the FD magnitude does not depend on and is determined by the magnetic field strength in a global ICME, as well as by its speed and sizes (e.g., \openciteBelov2009).
-
•
Positive results obtained for FDs show relevance of the eruptive flux as a diagnostic parameter and encourage its similar comparison with intensity of GMSs, while without taking into account factors determining the component (Section \irefS-geomagnetic_storms).
-
•
The analysis shows that not only the magnitudes of FD and GMS are closely related to the eruptive magnetic flux, but that the latter largely determines also the times of ICME propagation from the Sun to the Earth (Section \irefS-transit_times). This is true for two transit times that we consider, both of which are measured from the eruption moment at the Sun: (a) the onset transit time, i.e., an interval until the interplanetary disturbance arrival at the Earth, and (b) the peak transit time, i.e., an interval until the GMS peak.
-
•
Summary and discussion, including some results of the testing of the obtained tentative relations by their application to actual data of 2010 and directions of the relevant further investigations, are given in Section \irefS-discussion.
Some preliminary results concerning FDs and the ICME onset transit time were published in a brief paper of \inlineciteChertokBelovGrechnev2011.
2 Data and Technique
S-data_technique
2.1 Events
Our analysis is based on the catalog of major GMSs prepared by the Living with a Star (LWS) Coordinated Data Analysis Workshop (CDAW; Zhang et al. 2007a; 2007b). The catalog contains data on the most intense GMSs with a minimum Dst nT that occurred during 1996 – 2005 including data on their solar and interplanetary sources. Additionally, we took into account the revised and updated ICME list of cycle 23 compiled by \inlineciteRichardsonCane2010 and containing information on their probable solar sources, basic properties, and geomagnetic effects.
In the CDAW catalog Zhang et al. (2007a), all events are classified into three types depending on the character of GMS, its interplanetary drivers, and solar sources: (a) S-type, in which the separate storm is associated with a single ICME and a single eruption (CME) at the Sun; (b) M-type, in which the compound storm is associated with multiple, complex, probably interacting ICMEs arising from multiple solar eruptions and CMEs; (c) C-type, in which GMSs are associated with the solar wind CIRs caused by high-speed streams from coronal holes. Three confidence levels of the GMS identification with solar sources are distinguished: the highest confidence level 1 means a clear unambiguous identification with a concrete source at the Sun; the less confidence level 2 denotes a less reliable but probable identification with more than one source; the low confidence level 3 belongs to an ambiguous identification and problematic events. M-type GMSs automatically fall into levels 2 or 3 because of their intrinsic complexity. For M-type GMSs, in the cases where this was possible, we extracted the strongest decrease of the Dst index, and the most powerful solar eruption (producing a strongest flare and most energetic CME) identified according to the corresponding dimming events and PE arcades that occurred at a suitable time was considered as its most probable source with an ambiguous identification level. For such events only these eruptions are presented in our Table \irefT-table (see below). In Table \irefT-table and in the text to follow, the date is expressed for simplicity as year/month/day.
We only deal with non-recurrent GMSs of types S and M initiated by sporadic solar eruptions and CMEs. Therefore, C-type events associated with coronal holes are omitted entirely. Moreover, to minimize the projection effect on the dimming and arcade parameters, we considered GMSs identified with eruptions which occurred in the central zone of the visible solar hemisphere within from the disk center. It would be more reasonable to use the limit Wang et al. (2002), but in this case the number of analyzed events were significantly reduced. Several non-recurrent and intense GMS events, including those from central solar sources, were removed from our consideration due to data gaps either of the whole SOHO spacecraft (CDAW storm No. 6, 1997/11/23; No. 11, 1998/08/06; No. 13, 1998/08/27; No. 14, 1998/09/25; No. 20, 1999/02/18; and No. 23, 1999/11/13) or the absence of EIT images (No. 47, 2001/11/06; No. 72, 2004/04/04; and No. 85, 2005/06/12), or the absence of the SOHO/MDI Scherrer et al. (1995) magnetograms (No. 15, 1998/10/19)111Here and afterwards the GMS events are numbered according to the CDAW catalog (Zhang et al. 2007a; 2007b). Of course, we did not analyze GMSs whose solar source is unknown, for example such as CDAW storm No. 2, 1997/04/22; No. 7, 1998/02/18; No. 28, 2000/08/11; No. 31, 2000/10/05; No. 40, 2001/04/22; and No. 58, 2002/10/01.
In the course of consideration, we carried out verification and some corrections of the CDAW identification of GMSs with corresponding solar eruptions paying particular attention to the characteristics of appropriate dimmings and PE arcades and taking into account the data base created in IZMIRAN Belov (2009), the online SOHO/LASCO CME catalog (http://cdaw.gsfc.nasa.gov/CME˙list/; \openciteYashiro2004), as well as all accessible solar and solar-terrestrial data acquired by ground-based and space-borne observatories.In particular, several S-type events from the CDAW catalog with a ‘source unknown’ classification were reconsidered and suitable sources of the identification level 2 were determined for these events:
-
•
For example, for the S-type storm No. 34 (2000/11/06) the ‘source unknown’ proposition concerns a flare only. However, there was a suitable major halo CME observed on 200/11/03 after 18:26222All times hereafter are UT. that was accompanied by a large PE arcade and noticeable dimmings near the solar disk center.
-
•
Another S-type GMS No. 36 (2001/03/20) of this kind was certainly caused by eruptions from the central active region (AR) 9373 and its surroundings on 2001/03/15 and 2001/03/16. Judging by surface activities visible in the EIT images, the eruption of 2001/03/15, 21:00 was accompanied by large dimmings and PE arcade and could give the main contribution to this GMS.
-
•
Similarly, for the S-type GMS No. 76 (2004/08/30) instead of the unknown source we accept a filament eruption of 2004/08/26, 12:00 near AR 10664 (S11W38) with apparent EIT signatures and a large, slowly accelerating CME as a probable source.
Among our other refinements of the CDAW catalog, the following ones should be also mentioned:
-
•
We merged two storms No. 16 (1998/11/08) and No. 17 (1998/11/09) in the catalog into one event (No. 17) of the identification level 1, because this disturbance was caused by different parts of a single ICME resulting mainly from the solar eruption on 1998/11/05, 19:55.
-
•
The catalog unambiguously associates the single GMS No. 24 (2000/02/12) with a central eruption and a halo CME of 2000/02/10, 02:30. However, another much more powerful eruption with a spectacular halo CME, large dimmings, and PE arcade occurred on 2000/02/09, 20:00 in AR 8853 (S17W40). For this reason, the eruption of 2000/02/09 is considered as a basic source of the storm with the identification level 1.
-
•
In the catalog, a strong halo CME of 2003/08/14, 20:06 is indicated as a possible source of the single GMS 66 (2003/08/18) but with the identification level 2 because dimmings were not detected in the central part of the disk in connection with this CME. Our processing of EIT data revealed that not only significant dimmings but also a PE arcade near AR 10431 accompanied this CME. Consequently, the identification level can be raised to 1.
-
•
According to the catalog, the S-type GMS No. 74 (2004/07/25) is identified unambiguously with an eruption of 2004/07/22 at 08:30. Meanwhile, judging by parameters of the dimming and PE arcade, a more powerful central trans-equatorial eruption occurred on this day at 22:58. Therefore, it is reasonable to consider the later eruption as a probable source of this storm with the confidence level 2.
-
•
The catalog indicates that the great GMS No. 77 (2004/11/08) was probably caused by two solar eruptions of 2004/11/04 accompanied by CMEs and the C6.3 and M5.4 flares, which peaked at 09:05 and 22:29. In our opinion, the main contribution to this storm, including its sudden commencement on 2004/11/07, 18:27, was provided by a more powerful eruption of 2004/11/06 with a halo CME and M9.3 flare at 00:34. On the other hand, another powerful eruption of 2004/11/07 associated with a halo CME and X2.0 flare at 16:06 is considered by us as a main source of the subsequent great GMS No. 78 (2004/11/10). Bearing in mind the discrepancies with the CDAW catalog, these two events are classified further as multiple storms with confidence level 2 of the source identification.
-
•
For the multiple event No. 79 (2005/01/18), the catalog refers to two eruptions of 2005/01/15 as probable sources. It seems more probable that these and some earlier eruptions were responsible for the initial GMS disturbances starting on 2005/01/15, but the main Dst decrease on 2005/01/18 most likely was caused by a powerful eruption of 2005/01/17, 09:52 characterized by one of the fastest CME as well as by large dimmings and arcade.
-
•
The catalog classifies GMS No. 81 (2005/05/08) as a coronal hole (CIR) associated one. Meanwhile, a spectacular large-scale eruption, which occurred on 2005/05/06 at 17:00 around AR 0758 (S09E28) and was accompanied by a fast halo CME and a C8.5 long-duration flare, can be considered as a probable source of this storm with the confidence level 2.
It is important that reconsideration of all the events listed in the two last paragraphs resulted in reasonable transit times of the corresponding ICMEs to the Earth (see Section \irefS-transit_times). To encompass the whole cycle 23, two strong GMSs with Dst nT on 2006/04/14 and 2006/12/15 should be mentioned. The first storm was excluded from our analysis because its solar source is unknown, and the second one was added into our Table \irefT-table as event 90.
Among non-recurrent GMSs, we discriminate events initiated by eruptions occurring in ARs and events associated with filament eruptions outside ARs (the latter are marked in the CDAW catalog with a note ‘QS’, i.e., a quiet-Sun region). The reasons are that these two categories of eruptions differ significantly in characteristics of accompanying dimmings and PE arcades, properties of CMEs/ICMEs, and intensity of GMSs and FDs, which they cause (see, e.g., \openciteSvestka2001; \openciteChertok2009; \openciteGopalswamy2009). For brevity we refer them to as AR events and non-AR events, respectively.
2.2 Analyzed Parameters
As a measure of the GMS intensity, we use the minimum final hourly Dst index for all events of 1997 – 2006 (http://wdc.kugi.kyoto-u.ac.jp/dstdir/index.html). In the CDAW catalog for events of 2004 – 2006 the provisional Dst values were used. Now in events No. 73 (2004/07/23) and No. 83 (2005/05/20) the absolute value of the final Dst index is slightly less than 100 nT. Nevertheless, these two single events are kept in our set because they have the highest identification level S1.
As for a FD characteristic, its maximum magnitude is adopted which corresponds to a cosmic ray rigidity of 10 GV and is determined from data of the world network of neutron monitors using the global survey method Krymskii et al. (1981); Belov et al. (2005). In some complex events, a secondary significant FD was observed against the strong background of the descending phase of a previous strong FD. This occurred, for example, in the CDAW paired events No. 50 and No. 51 (2002/04/18 – 20) and No. 67 and No. 68 (2003/10/30). In such cases, we considered and included in Table \irefT-table the magnitude of the first FD only, because the true value of the secondary FD is difficult to determine due to several factors influencing in this complex situation the measured cosmic ray intensity.
In considering the temporal parameters of GMSs, the peak time of the corresponding soft X-ray flare (see http://www.swpc.noaa.gov/ftpmenu/warehouse.html) was taken as an eruption time at the Sun. For a couple of events initiated by filament eruptions outside ARs that were not accompanied by a noticeable soft X-ray flare, the eruption time was taken to be equal to the peak emission time of a PE arcade visible in EIT 195 Å images, as described below.
In this study, we analyze two transit times, which adequately characterize GMSs and are important for their forecasting. The onset transit time () is defined as an interval between the eruption time (the peak time of an associated soft X-ray burst) and the arrival time of the corresponding interplanetary disturbance (shock wave) to the Earth which is indicated particularly by the geomagnetic storm sudden commencement (SSC) (ftp://ftp.ngdc.noaa.gov/STP/SOLAR˙DATA/SUDDEN˙COMMENCEMENTS/STORM2.SSC). The peak transit time () is calculated as an interval between the same eruption time and the moment of the minimum hourly Dst index for the given GMS.
To evaluate parameters of dimmings and arcades, we analyzed solar images obtained in the 195 Å channel of SOHO/EIT (dominating line is Fexii, characteristic temperature is 1.3 MK). The corresponding FITS files were downloaded from the EIT catalog (http://umbra.nascom.nasa.gov/eit/eit-catalog.html).
In patrol CME watch observations, the 195 Å images were obtained usually with an imaging interval of 12 min. For the present analysis, the solar rotation in the analyzed images was compensated, and then the same fixed image before an eruption was subtracted from each subsequent ones to obtain fixed-base images Chertok and Grechnev (2005). In most cases, a 3 – 4 h interval from the eruption onset time was considered, i.e., a set of 15 – 20 images was analyzed. During this time, the main dimmings and arcades are already fully formed, but some minor irrelevant evolutionary darkenings or brightenings appear on the solar disk in this way.
Sometimes EIT observations with a 12-min imaging interval were carried out in the 304 Å channel instead of the 195 Å channel. In this situation, when it was possible, we formed difference images and evaluated parameters of dimmings and arcades by using two or three suitable 195 Å images obtained with a 6-h interval. This was done, for example, for solar eruptions corresponding to the CDAW events No. 41 (eruption of 2001/08/14, 12:40), No. 63 (double eruption of 2003/05/27, 23:07 and 2003/05/28, 00:27), and No. 84 (eruption of 2005/05/26, 14:20).
Data processing was carried out with IDL employing SolarSoftware general-purpose and instrument-specific routines as well as a library and special software developed by the authors for the present task. The whole package allows us to perform all necessary procedures: calibrations of raw FITS files; compensation of the solar rotation and subtraction of images; extraction of dimmings and PE arcade which develop due to an analyzed CME; computation of areas and total intensity within the dimming and arcade regions according to chosen criteria; overlay of resulting images of the dimmings and arcades with SOHO/MDI magnetograms and calculation of the photospheric magnetic fluxes within these structures. In the course of the analysis, thresholds of relative changes of brightness were determined, which were optimal for evaluation of parameters of the dimmings and arcades. Relative rather than absolute thresholds were chosen for several reasons. Just the relative thresholds allow us to take into account significant dimmings in structures, whose brightness was small before an eruption. It is also possible to reduce the influence of temporal variations of the EIT detector characteristics as well as changes in the calibration procedures. Finally, relative thresholds make it possible in future to apply the quantitative results of the present analysis to data from other EUV telescopes, in particular, the Atmospheric Imaging Assembly (AIA; \openciteLemen2012) on board the Solar Dynamic Observatory (SDO).
Parameters of dimming were computed from the so-called ‘portrait’, which shows in a single image all dimmings appearing all over the event. The ‘dimming portrait’ is formed as a maximum depth of the depression (i.e., the minimum brightness) in each pixel over the whole fixed-base difference set (see \openciteChertokGrechnev2005). The analysis showed that the brightness depression of more than 40% was an optimal criterion for extraction of relevant significant dimmings. At this threshold, shallow, short-lived, widespread, diffuse dimmings, particularly associated with coronal waves, are not caught, whereas main core dimmings adjoining to the eruption center and other deep dimmings are displayed. At lower threshold values, many remote evolutionary dimmings not related to the eruption under consideration appear in difference images, while at larger thresholds, some significant dimmings located near the eruption center and obviously related to the eruption can be missed.
For PE arcades, a criterion turned out to be appropriate which extracted an area around the eruption center where the brightness in the 195 Å channel exceeded 5% of the maximum one. As has been known, the area of a PE arcade increases with time. Therefore, to avoid ambiguity, extraction of a PE arcade was performed in an image temporally close to the maximum of the EUV flux from the selected area. Usually this time is close to the peak time of a corresponding GOES soft X-ray flare or somewhat later. In particular, for events related to filament eruptions outside ARs, the area of the arcade was calculated at the peak time of the soft X-ray emission. In events associated with large eruptions occurring in ARs and accompanied by very intense flares, for example, such as X-class ones, a strong scattered light and a long-duration bright, wide saturation streak crossing the eruption center appear in EIT images. In such cases, the nearest frame after disappearance of the distortion was taken for extraction of the PE arcade and measurement of its parameters.
A total (unsigned) magnetic flux within dimming areas and PE arcades is the most comprehensive and suitable parameter for the analysis, because the intensity of GMSs and FDs as well as the transit times (as will be shown below) are largely determined by the magnetic characteristics of CMEs/ICMEs and their solar sources. This parameter is evaluated within the contours of dimmings and arcades determined according to the above quantitative criteria, and thus, in fact, also takes into account their area and intensity. In the present study for each event, the line-of-sight magnetic field at the photospheric level is calculated from SOHO/MDI level 1.8 magnetograms recalibrated in December 2008 (http://soi.stanford.edu/magnetic/index5.html). The magnetograms were routinely produced with an interval of 96 min. We rebinned the magnetograms as well as EIT images to pixels (with averaging) and resized the magnetograms to the resulting pixel size of EIT. These procedures serve to minimize measurement uncertainties. The 1-min magnetograms were mainly used (in 43 events), while in seven events we were forced to use 5-min ones. Calculations of the eruptive magnetic flux from closest 1-min and 5-min magnetograms have demonstrated that the differences for the considered events did not exceed several percent. The reason is that we are dealing with powerful eruptions, which produce dimmings and arcades in sufficiently strong magnetic fields for which the field, and therefore contributions from noises in either 1-min or 5-min magnetograms are not significant. Additional measurement issues are addressed in Section \irefS-measurement_issues.
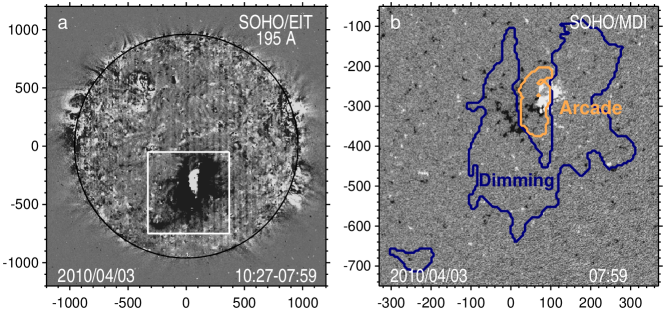
To evaluate photospheric unsigned magnetic fluxes in dimmings () and arcades () as well as their total flux (), we take an MDI pre-event magnetogram closest to the eruption time and compute the total magnetic fluxes within the corresponding regions identified from EIT images. In this study, we use the total flux of dimmings and arcade as a main parameter of an eruption. Figure \irefF-fig2 illustrates the described procedures.
2.3 Table
S-table
As a result of the procedures described above, the following Table \irefT-table of the analyzed events was formed. For each of 50 events, it starts with a GMS number corresponding to the CDAW catalog (Zhang et al. 2007a; 2007b). Then information on the geospace disturbance is provided including the GMS peak time, minimum Dst value, FD magnitude, date and time of the disturbance onset (SC). In column 6, the GMS type and identification level of the solar eruptive source are given. The S1 and S2 codes mean the separate storm caused by a single CME/ICME of a clear unambiguous or only probable identification of a single eruption at the Sun, respectively. The M2 code belongs to compound GMSs for which the strongest decrease of the Dst index was selected and the most powerful suitable solar eruption was determined as its probable source of the identification level 2. The letter ‘R’ after the S1, S2, and M2 codes indicates that the solar source of the given GMS was refined by us in comparison with the CDAW catalog as described in Section \irefS-data_technique. We will first examine the S1 group of single events with a reliable identification, and then add the S2 and M2 events whose identification level is considered as probable.
| 1 | 2 | 3 | 4 | 5 | 6 | 7 | 8 | 9 | 10 | 11 | 12 | 13 |
| Geospace disturbance | Eruption on the Sun | Transit | ||||||||||
| Identifi- | time [h] | |||||||||||
| Disturbance | cation | Flare | Magnetic | |||||||||
| CDAW | GMS peak | Dst | FD | onset, | level | Date, time | soft | Position | Type | flux | ||
| No. | (date, time) | [nT] | [%] | Shock, SC | X-ray | [ Mx] | ||||||
| (date, time) | class | |||||||||||
| 3 | 1997/05/15, 13 | 115 | 1.7 | 15, 01:59 | S1 | 12, 04:55 | C1.3 | N21W06 | AR | 95 | 69 | 80 |
| 4 | 1997/10/11, 04 | 130 | 1.1 | 10, 16:12 | S1 | 06, 15:00 | — | S27W05 | non-AR | 22 | 97 | 109 |
| 5 | 1997/11/07, 05 | 110 | 2.1 | 06, 22:48 | S1 | 04, 05:58 | X2.1 | S14W33 | AR | 161 | 65 | 71 |
| 9 | 1998/05/04, 06 | 205 | 3.5 | 04, 02:15 | M2 | 02, 13:42 | X1.1 | S15W15 | AR | 220 | 37 | 40 |
| 16 – 17 | 1998/11/08, 07 | 149 | 7.4 | 08, 04:51 | S1, R | 05, 19:55 | M8.4 | N22W18 | AR | 276 | 57 | 59 |
| 18 | 1998/11/13, 22 | 131 | 2.3 | 13, 01:43 | S1 | 09, 17:58 | C2.3 | N18E00 | non-AR | 76 | 80 | 100 |
| 21 | 1999/09/23, 00 | 173 | 1.9 | 22, 12:09 | S1 | 20, 05:50 | C2.8 | S21W05 | non-AR | 47 | 54 | 66 |
| 22 | 1999/10/22, 07 | 237 | 2.4 | 21, 02:25 | S1 | 17, 23:25 | C1.2 | S26E08 | non-AR | 64 | 75 | 104 |
| 24 | 2000/02/12, 12 | 133 | 3.7 | 11, 23:52 | S1, R | 09, 20:06 | C7.4 | S17W40 | AR | 138 | 52 | 64 |
| 26 | 2000/05/24, 09 | 147 | 3.3 | 23, 14:25 | M2 | 20, 05:35 | C7.6 | S15W08 | AR | 69 | 81 | 99 |
| 27 | 2000/07/16, 01 | 301 | 11.7 | 15, 14:37 | S1 | 14, 10:24 | X5.7 | N22W07 | AR | 470 | 28 | 39 |
| 29 | 2000/08/12, 10 | 235 | 2.7 | 11, 18:46 | S1 | 09, 16:22 | C2.3 | N11W11 | AR | 132 | 50 | 66 |
| 30 | 2000/09/18, 00 | 201 | 8.1 | 17, 17:00 | M2 | 16, 04:26 | M5.9 | N14W07 | AR | 234 | 37 | 44 |
| 32 | 2000/10/14, 15 | 107 | 3.6 | 12, 22:28 | S1 | 09, 23:43 | C6.7 | N01W14 | AR | 122 | 71 | 111 |
| 34 | 2000/11/06, 22 | 159 | 7.8 | 06, 09:47 | S2, R | 03, 19:02 | C3.2 | N02W02 | AR | 214 | 63 | 75 |
| 35 | 2000/11/29, 14 | 119 | 2.7 | 28, 05:25 | M2 | 26, 16:48 | X4.0 | N18W38 | AR | 149 | 37 | 69 |
| 36 | 2001/03/20, 14 | 149 | 2.9 | 19, 11:14 | S2, R | 15, 21:59 | C1.9 | N11W09 | AR | 108 | 85 | 112 |
| 37 | 2001/03/31, 09 | 387 | 4.1 | 31, 00:52 | M2 | 29, 10:15 | X1.7 | N20W19 | AR | 377 | 39 | 47 |
| 38 | 2001/04/12, 00 | 271 | 12.8 | 11, 13:43 | M2 | 10, 05:26 | X2.3 | S23W09 | AR | 294 | 32 | 43 |
| 41 | 2001/08/17, 22 | 105 | 6.3 | 17, 11:03 | S1 | 14, 12:42 | C2.3 | N16W36 | non-AR | 68* | 70 | 81 |
| 42 | 2001/09/26, 02 | 102 | 8.3 | 25, 20:25 | S1 | 24, 10:38 | X2.6 | S16E23 | AR | 271 | 34 | 39 |
| 43 | 2001/10/01, 09 | 148 | 1.9 | 30, 19:24 | S1 | 28, 08:30 | M3.3 | N08E19 | AR | 170 | 59 | 72 |
| 1 | 2 | 3 | 4 | 5 | 6 | 7 | 8 | 9 | 10 | 11 | 12 | 13 |
|---|---|---|---|---|---|---|---|---|---|---|---|---|
| 44 | 2001/10/03, 15 | 166 | 2.5 | 03, 02:00 | S1 | 29, 11:06 | M1.8 | N13E03 | AR | 134 | 87 | 100 |
| 45 | 2001/10/21, 22 | 187 | 5.4 | 21, 16:48 | S1 | 19, 16:30 | X1.6 | N15W29 | AR | 220 | 48 | 53 |
| 46 | 2001/10/28, 12 | 157 | 1.9 | 28, 03:13 | M2 | 25, 15:02 | X1.3 | S18W19 | AR | 293 | 60 | 69 |
| 48 | 2001/11/24, 17 | 221 | 9.2 | 24, 05:56 | M2 | 22, 23:30 | M9.9 | S14W36 | AR | 237 | 30 | 41 |
| 50 | 2002/04/18, 08 | 127 | 6.2 | 17, 11:07 | S1 | 15, 03:55 | M1.2 | S15W01 | AR | 236 | 55 | 76 |
| 51 | 2002/04/20, 09 | 149 | — | 20, 00:00 | S1 | 17, 08:24 | M2.6 | S14W34 | AR | 286 | 64 | 73 |
| 52 | 2002/05/11, 20 | 110 | 1.4 | 11, 10:14 | S1 | 08, 13:27 | C4.2 | S12W07 | AR | 137 | 69 | 79 |
| 55 | 2002/08/21, 07 | 106 | 0.9 | 20, 14:00 | S2 | 16, 12:32 | M5.2 | S14E20 | AR | 117 | 97 | 114 |
| 59 | 2002/10/04, 09 | 146 | 3.0 | 02, 23:00 | S1 | 30, 02:00 | C2.5 | S17W17 | non-AR | 20 | 93 | 127 |
| 63 | 2003/05/30, 00 | 144 | 7.7 | 29, 12:24 | M2 | 27, 23:07 | X1.3 | S07W17 | AR | 160* | 37 | 49 |
| 64 | 2003/06/18, 10 | 141 | 3.7 | 18, 05:01 | M2 | 14, 05:00 | — | N22W15 | non-AR | 46 | 96 | 101 |
| 66 | 2003/08/18, 16 | 148 | 2.6 | 17, 14:21 | S1, R | 14, 18:38 | C3.1 | S14E00 | AR | 177 | 68 | 93 |
| 67 | 2003/10/30, 01 | 353 | 28.0 | 29, 06:11 | S1 | 28,11:10 | X17.2 | S16E08 | AR | 871 | 19 | 38 |
| 68 | 2003/10/30, 23 | 383 | — | 30, 16:00 | S1 | 29, 20:49 | X10.0 | S15W02 | AR | 520 | 19 | 26 |
| 69 | 2003/11/20, 21 | 422 | 4.7 | 20, 08:03 | S1 | 18, 08:31 | M3.9 | N00E18 | AR | 133 | 48 | 60 |
| 70 | 2004/01/22, 14 | 130 | 8.6 | 22,01:37 | S1 | 20, 00:40 | C5.5 | S13W11 | AR | 273 | 49 | 61 |
| 73 | 2004/07/23, 03 | 99 | 4.3 | 22, 10:36 | S1 | 20, 12:32 | M8.6 | N10E35 | AR | 172 | 46 | 62 |
| 74 | 2004/07/25, 17 | 136 | 4.6 | 24, 06:13 | S2, R | 22, 22:58 | M1.6 | N05E04 | AR | 257 | 31 | 66 |
| 75 | 2004/07/27, 14 | 170 | 13.5 | 26, 22:49 | S1 | 25, 13:49 | M2.2 | N08W33 | AR | 363 | 33 | 48 |
| 76 | 2004/08/30, 23 | 129 | 0.7 | 29, 10:06 | S2, R | 26, 13:04 | B8.4 | S11W38 | AR | 46.4 | 69 | 106 |
| 77 | 2004/11/08, 07 | 374 | 5.2 | 07, 18:27 | M2, R | 06,00:34 | M3.9 | N09E05 | AR | 252 | 42 | 54 |
| 78 | 2004/11/10, 11 | 263 | 8.3 | 09, 19:00 | M2, R | 07, 16:06 | X2.0 | N09W17 | AR | 290 | 51 | 67 |
| 79 | 2005/01/18, 09 | 103 | 11.8 | 18, 06:00 | M2, R | 17, 09:52 | X3.8 | N15W25 | AR | 378 | 20 | 23 |
| 81 | 2005/05/08, 19 | 110 | 5.1 | 08, 08:00 | M2, R | 06, 17:05 | C8.5 | S09E28 | AR | 294 | 39 | 50 |
| 82 | 2005/05/15, 09 | 247 | 9.5 | 15, 02:38 | S1 | 13, 16:57 | M8.0 | N12E12 | AR | 266 | 34 | 40 |
| 83 | 2005/05/20, 09 | 83 | 1.1 | 20, 04:01 | S1 | 16, 13:01 | C1.2 | N13W29 | AR | 54 | 87 | 92 |
| 84 | 2005/05/30, 14 | 113 | 4.3 | 29, 09:52 | S2 | 26, 14:20 | B7.5 | S12E13 | AR | 89* | 68 | 96 |
| 90 | 2006/12/15, 08 | 162 | 8.6 | 14, 14:14 | S1 | 13, 02:40 | X3.4 | S06W24 | AR | 222 | 35 | 53 |
Columns 7 – 10 contain information on the corresponding solar eruptive source: date and time of the eruption determined mainly from the peak time of the soft X-ray flare emission, its GOES class, and the position of the eruption site. In column 10, the label ‘AR’ means that the eruption occurred in and around an AR, while the label ‘non-AR’ indicates events resulting from filament eruptions outside ARs. The resulting values of the parameters analyzed in this paper are presented in columns 11 – 13. Here and afterwards the main parameter of an eruption, the total magnetic flux in dimmings and arcades at the photospheric level (), is expressed in units of Mx (maxwell). In three events marked by the asterisks, the dimming and arcade areas and the corresponding magnetic fluxes were measured by using two to three suitable 195 Å images obtained with the 6-h interval. The two last columns present the onset () and peak () transit times calculated as described above.
3 Results
S-results
3.1 Forbush Decreases
S-forbush_decreases To assess how informative the total magnetic flux of dimmings and arcades is and if it can really be used as a comprehensive parameter of an eruption, we first of all examine how it is related to the magnitude of FDs. Unlike GMSs, the magnitude of FDs does not depend on the component being determined by the magnetic field strength in a global ICME as well as its speed and size. Figure \irefF-fig3a shows the relationship between the magnetic flux and the FD magnitude for single geospace disturbances reliably identified with an unambiguous solar eruption (the S1 group). Here and afterwards the filled diamonds and triangles correspond to the AR and non-AR eruptions, respectively. One can see that a conspicuous dependence of the FD magnitude on the magnetic parameter of eruptions does exist. On average, when the flux increases from 30 to 900 (in Mx units), the FD amplitude rises from 0.8% to 25%. The dependence can be fitted with the following linear regression relation
| (1) |
The correlation coefficient between and reaches . Note that this high correlation is only marginally due to a great contribution from event No. 67 (2003/10/30, 01) with the largest values of and caused by the famous Halloween solar eruption on 2003/10/28. The high correlation persists even without this event. For additional evaluation of scatter in data points, we accept a deviation band bounded by of the regression line’s slope but not less than of . The latter condition applies at relatively small eruptions, which correspond to magnetic fluxes Mx and small FD magnitudes . Calculations show that 18 out of 29 events (i.e. 62%) fall into this deviation band.
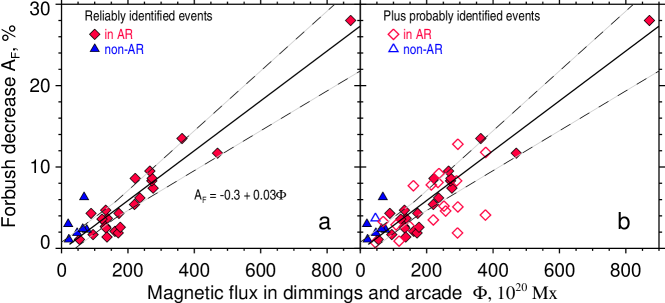
The dependence of the FD magnitude on the eruption magnetic parameter appears to be basically the same when single and compound events with a probable solar source identification (the S2 + M2 group, open symbols in Figure \irefF-fig3b) are added to single, unambiguously identified events. Here, as expected, the scatter of points increases, and the correlation coefficient somewhat reduces (). In this case, 22 points out of 48 (i.e., 46%) fall into the same deviation band.
From Figure \irefF-fig3 it is also visible that events associated with filament eruptions outside ARs (triangles) are characterized by relatively low values of magnetic fluxes Mx. It is clear that this is caused by occurrence of such eruptions in weak magnetic fields. Nevertheless, at least 3 out of 7 such events were accompanied by relatively strong FDs in the range of 3 – 6.3%. One possible reason for this unexpected trend can be due to the fact that such non-AR filament eruptions could lead to CMEs/ICMEs of sufficiently large size. As known, the magnitude of FDs is determined not only by magnetic characteristics of ICMEs, but also their global sizes. Additional peculiarities of the non-AR events will be presented and discussed below.
3.2 Geomagnetic Storms
S-geomagnetic_storms
The preceding section where FDs were considered has demonstrated that the magnetic flux in dimmings and arcades has a high informative potential for the space weather diagnostics as a parameter of eruptions. The fact that a sufficiently high correlation is revealed between this eruption parameter and the FD magnitude allows us to expect that this parameter will be closely related also to the GMS magnitude, especially if factors determining the component in ICMEs would be taken into account. In this paper, we will verify the relation between the same magnetic flux in dimmings and arcades, on the one hand, and the geomagnetic Dst index on the other hand – at the first step, in a simplest way, without taking into account the factors determining . Note all the events analyzed here have a negative component. The analyzed relationship might be also scattered by other factors, which we do not take into account – for example, the ratio of sizes of an ICME near the Earth and a pre-eruption magnetic structure on the Sun. The results are presented in Figure \irefF-fig4.
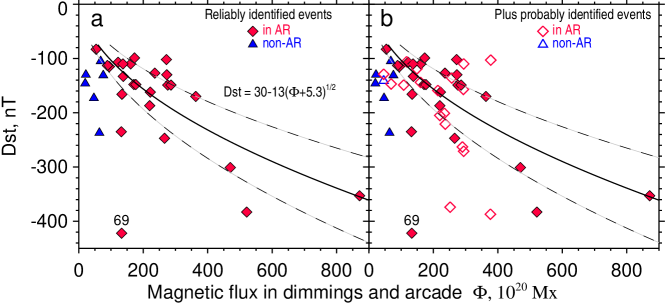
First of all let us consider single geomagnetic storms which are not only reliably identified with a definite solar source (the S1 group), but associated exactly with AR eruptions (diamonds in Figure \irefF-fig4a). One can see that even in this simplified analysis (i.e., disregarding , but note all events studied here have a southward component), the relationship between and Dst is noticeable: eruptions with larger magnetic flux result in stronger GMSs. Event No. 69 is a conspicuous outlier. This is the famous event, in which a moderate eruption on 2003/11/18 with moderately fast CMEs, relatively weak flares, and modest dimming/arcade magnetic fluxes resulted in the most intense GMS of the 23rd solar cycle with Dst nT. Unusual features of this outstanding event were discussed in a number of papers (see, e.g., \openciteGopalswamy2005; \openciteSchmieder2011; \openciteMarubashi2012; and references therein). However, causes of this super-storm after the comparatively insignificant solar eruption are still unclear. A new detailed multi-spectral analysis of solar and interplanetary manifestations in this event made by some of us with co-authors by involving observations, which were not considered previously, seems to have progressed in understanding the problem (we intend to present the results in future papers). Here it is reasonable to note that a combination of a quite moderate FD () and strongest GMS (Dst nT) registered in this event indicates that the ICME arrived at the Earth orbit in a form of a relatively small cloud. Remote and in situ interplanetary measurements confirm this conjecture. These circumstances suggest that in this case the magnetic cloud expanded weakly during its propagation from the Sun to the Earth and, as a result, preserved a strong magnetic field inside ( nT). An additional decisive favorable factor for the occurrence of the super-storm was that the component in the ICME was nearly antiparallel to the Earth’s magnetic dipole, so that almost the whole unusually strong magnetic field of the ICME interacted with the Earth’s magnetosphere.
Excluding event No. 69, Figure \irefF-fig4a shows that as the magnetic flux increases from 75 – 100 to 800 – 900 (in Mx units), the GMS enhances from Dst nT to Dst nT. This dependence can be expressed by the formula
| (2) |
In this case, the correlation coefficient between the observed Dst and the values calculated from the formula is . However, the scatter of the points on this Dst plot is large, probably because the factors determining the sign of are not taken into account. The deviation band relative to the Dst dependency bounded by the dotted lines in Figure \irefF-fig4a, contains 12 out of 29 (i.e., 41%) of the S1 events. If one takes into account the exceptional event No. 69, the correlation worsens to .
Figure \irefF-fig4a also shows that the S1 events associated with filament eruptions outside ARs (triangles) display again an unexpected behavior, as in the case of FDs (Section \irefS-forbush_decreases). In spite of small magnetic fluxes in dimmings and arcades, such filament eruptions produced relatively intense GMSs. In Figure \irefF-fig4a, at least 5 out of 6 points lie below the Dst curve and outside the accepted deviation band. In this case, such a deviation in the direction of stronger GMSs cannot be accounted for by possible large sizes of ICMEs, because, unlike FDs, the GMS intensity is determined by local rather than global characteristics of interplanetary clouds at the site of their interaction with the Earth’s magnetosphere. Perhaps this property of non-AR events is due to a selection effect. One should keep in mind that we study here the strongest GMSs of Dst nT and their eruptive sources. Therefore, only several most significant non-AR events were included in our consideration. Moreover, in all of the diverging non-AR events, the magnetic field vector in the ICMEs measured near the Earth was pointed practically south similar to event No. 69 mentioned above that favored enhanced GMSs. It should be added that in two of the most deviating events No. 21 and No. 22 (see Table \irefT-table), the total magnetic field in the ICMEs (25 and 35 G) and their components (23 and 31 G) were rather strong. Perhaps these events were not purely non-AR eruptions, and the corresponding flux ropes were anchored in related ARs.
Turning to Figure \irefF-fig4b, one can see that the general dependence between the dimming/arcade magnetic flux and GMS index Dst preserves its original appearance if single, unambiguously identified events (the S1 group, filled symbols) are supplemented with single and compound events of a probable solar source identification (the S2 + M2 group, open symbols). Naturally that in this case the correlation between the observed GMS intensity and the calculated one from Equation (\irefE-dst) is less, , and still decreases to if the exceptional event No. 69 is taken into account.
3.3 Transit Times
S-transit_times Now we consider how the total magnetic flux in dimmings and arcades is related to two temporal parameters of GMSs, the onset () and peak () transit times. Let us remind that is defined as an interval between the CME eruption time, which we take as the peak time of an associated soft X-ray burst, and the arrival time of the corresponding interplanetary disturbance (a shock wave) to the Earth indicated particularly by SSC, and is calculated as an interval between the same eruption time and the moment of the minimum Dst index of a given GMS. We realize that the propagation time of CMEs/ICMEs from the Sun to the Earth depends on many factors (lifting features in the corona, characteristics of the background solar wind, interaction with other interplanetary disturbances, etc.), and the GMS peak time is determined not only by the ICME speed, but also by the magnetic field distribution in an ICME, i.e., in which part of it (shock sheath ahead of an ICME, frontal or trailing component within its body) the enhanced negative field is embedded. Nevertheless, by comparing the eruptive flux with transit times, we want to study to what extent the transit times (and therefore the 1 AU ICME transit speed) are determined by parameters of a solar eruption.
In Figure \irefF-fig5a, the relationship between the eruptive magnetic flux and the onset transit time is presented for single reliably identified S1 events including both AR (diamonds) and non-AR (triangles) eruptions. The dependence between and is evident. The greater eruptive magnetic flux (i.e., the more powerful eruption), the shorter the transit time of the ICME-driven shock propagation from the Sun to the Earth is, and the faster a GMS starts. For weak magnetic fluxes Mx, in most cases the onset transit time is h, and for the strongest eruptions with Mx, the onset transit time comes to a level of about h, which corresponds to the average 1 AU ICME transit speed of about 2100 km s-1. Analytically this dependence is expressed as follows
| (3) |
For the whole set of the S1 events under consideration, the correlation coefficient between the observed onset times and the calculated from expression (\irefE-t0) is sufficiently high, . The deviation band between the dotted lines in Figure \irefF-fig5a contains 21 out of 31 (i.e., 68%) of the events. There are no significant exceptions on this chart.
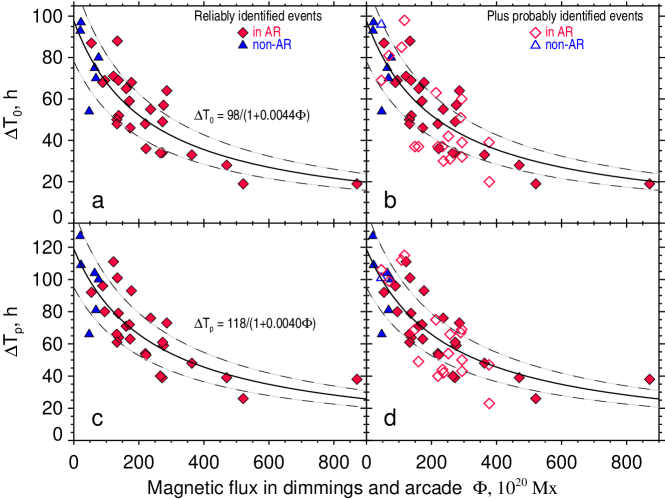
The dependence between and including the features described above for the S1 events (filled symbols) remains valid when less reliably identified and compound S2 + M2 events (open symbols) are added into consideration in Figure \irefF-fig5b. Here the correlation coefficient between the observed onset times and those calculated from Equation (\irefE-t0) only slightly reduces to , but the scatter somewhat increases, and the number of points within the same deviation band decreases to 28 out of 50 (i.e., 56%).
The determining role of a solar eruptive source influences the ICME speed so strongly that the peak transit time also exhibits a similar clear dependence on the magnetic flux in dimmings and arcade in spite of the interfering factors mentioned above. As Figures \irefF-fig5c and \irefF-fig5d show, a similar expression
| (4) |
revealed from consideration of reliably identified S1 events can be used for description of this dependence. It can be seen that at small magnetic fluxes Mx the majority of GMSs has the peak transit time h, and for most powerful eruptions with Mx the GMS peak becomes h. This means again that solar eruptions from areas of relatively small (large) dimming/arcade magnetic flux are accompanied by low-speed (high-speed) ICMEs, respectively. The correlation coefficient between the observed GMS peak times and those calculated from Equation (\irefE-tp) is approximately the same, , for both the S1 events (Figure \irefF-fig5c) and the whole set of the events (Figure \irefF-fig5d). In these diagrams, the relative number of points within the deviation band is 65% (20 out of 31) and 58% (29 out of 50) for the S1 and S1 + S2 + M2 event groups, respectively. As for non-AR events (triangles in Figure \irefF-fig5), their majority shows the same pattern as AR-associated ones, and, with their relatively smaller magnetic fluxes, they show largest onset and peak transit times.
4 Summary and Discussion
S-discussion
4.1 Summary of Results
We have studied relationships between characteristics of large non-recurrent space weather disturbances of the 23rd solar cycle in the form of GMSs with Dst nT and associated FDs, on the one hand, and quantitative parameters of their solar source manifestations such as EUV dimmings and PE arcades accompanying the corresponding CMEs, on the other hand. In particular, the total magnetic flux of the line-of-sight magnetic field at the photospheric level within the dimming and arcade areas is used as a main parameter of eruptions. The results presented above reveal that, when a southward component is present, parameters of space weather disturbances caused by CMEs/ICMEs are largely determined by the power of solar eruptions (in terms of the total magnetic flux in dimmings and arcades) in spite of many other factors affecting the propagation of interplanetary disturbances from the Sun to the Earth. This is true especially for eruptions with a large magnetic flux. Just thanks to this fact, we were able to establish the close statistical relationships of the magnetic flux in dimmings and arcades with the depth of FDs and transit times as well as its correlation with GMSs initiated by solar eruptions from the central part of the solar disk.
-
•
First of all, to test the informative potential of the magnetic flux as a parameter of an eruption, we analyzed its relationship with the FD magnitude , because the latter, unlike GMSs, does not depend on the component being determined by the magnetic field strength in a global ICME as well as its speed and size. It turned out that with an increase of the erupting magnetic flux up to Mx, the magnitude of the corresponding FD grows linearly up to 25%.
-
•
The above positive result allowed us to study the correlation of the same eruptive parameter with the GMS magnitudes, at the first step, without taking into account the factors determining near the Earth. We found that even in such a simplified approach, the dependence between and the geomagnetic Dst index does exist indeed (all events considered in this study contained a negative component). Stronger solar eruptions characterized by larger magnetic fluxes result in more intense GMSs up to Dst nT.
-
•
The same magnetic fluxes of dimmings and arcades exhibit a close inverse correlation with the onset () and peak () transit times measured, respectively, as the propagation time of an ICME-driven shock from the Sun to the Earth (a GMS onset) and the GMS peak time. With an increase of the magnetic flux, both and shorten from 3 – 5 days to approximately 1 day. Equations (\irefE-t0) and (\irefE-tp) show that, for the first approximation, the CME/ICME speed linearly increases with the strengthening of the total magnetic flux in its solar source. On the other hand, we have established that the FD and GMS magnitudes do depend on the same eruptive magnetic flux, when a negative component is present in those events. Juxtaposition of these relations sheds light on the statistical correspondence of the magnetic field in an ICME near the Earth on the near-the-Sun CME speed Yurchyshyn, Wang, and Abramenko (2004) as well as a pronounced dependence of the FD magnitude on the ICME speed Belov (2009); Richardson and Cane (2011).
-
•
The physical meaning of Equations (\irefE-t0) and (\irefE-tp) becomes clearer if we present them in a form . Here is a velocity of the background solar wind and is a CME/ICME velocity component governed by parameters of a solar eruption. With AU, we get km s-1, for the onset transit time (\irefE-t0) and km s-1, for the peak transit time (\irefE-tp), with being expressed in seconds. If the eruptive component is small, then the arrival time of a disturbance is mainly determined by the solar wind flow carrying the ICME. In major events, , the initial CME speed determined by parameters of the eruption is high enough to ensure the GMS onset time in 20 – 24 h despite the aerodynamic drag of the solar wind. Note that \inlineciteRichardsonCane2010 gave a similar expression for the 1 AU transit speed, , where the plane-of-the-sky CME speed stands instead of the magnetic flux.
-
•
The majority of events under consideration was caused by AR eruptions. A few events produced by filament eruptions outside ARs and characterized by small eruptive magnetic flux had long transit times, caused GMSs, which were not so strong, and modest FDs. However, some of such non-AR eruptions resulted in relatively intense GMSs and FDs in comparison with AR eruptions of the same value of the magnetic flux. For FDs this feature can be due to larger size of corresponding CMEs/ICMEs, but it is not suitable for GMSs. The most probable reason for this feature is that the adopted criteria of extraction of the dimming and arcade areas are not fully appropriate for these non-AR eruptions because the latter have weaker dimmings and PE arcades in comparison with eruptions occurring in ARs.
Combining the established dependencies of the GMS severity and transit times on the eruptive magnetic flux (Figures \irefF-fig4 and \irefF-fig5), we conclude that weak GMSs are characterized mainly by long transit times and, conversely, short transit times are typical of most intense GMSs. This relation follows from in situ measurements, which show high plasma speeds within ICMEs during severe GMSs. From the present study it becomes clear that this is caused by the fact that both the GMS intensity (when a southward component is present) and ICME speed are largely determined by the strength and extent of solar eruptions expressed in the magnetic flux of EUV dimming and arcade areas. These circumstances along with results of \inlineciteQiu2007, \inlineciteVrsnak2005, and conclusions of other authors suggest that eruptions with larger magnetic fluxes initiate not only bigger flares, but also faster CMEs/ICMEs. In this respect it is worth noting that the tendency of inverse correlation between the GMS intensity and ICME transit time appears to be supported by data on the largest historical GMSs (see \openciteCliverSvalgaard2004). In particular, in the famous Carrington event of 1859, the severest GMS with estimated Dst nT Siscoe, Crooker, and Clauer (2006) commenced as early as 17 h after the large solar flare.
The new results on quantitative relationships between the magnetic fluxes in dimming and arcade, FD and GMS magnitudes, and ICME transit times obtained in our analysis are consistent with conclusions of several previous studies. Formation of the helical (poloidal) component of a magnetic flux rope by flare reconnection was quantitatively confirmed by \inlineciteQiu2007 in their comparisons of reconnected magnetic flux with the ICME magnetic flux for several AR events. The detailed quantitative correspondence between the reconnected flux and the rate of energy release in the course of a flare was found (e.g., \openciteMiklenic2009). A well-defined correlation between the plane-of-the-sky CME speed and the importance of the associated flare was established indeed (e.g., \openciteVrsnak2005). \inlineciteYurchyshyn2005 presented correlations between the projected CME speed, Dst, and ICME transit time. Most of the listed studies were related to flare-related events in active regions; on the other hand, \inlineciteChertok2009 showed that processes in non-AR filament eruptions were basically similar to flare-related eruptions in AR. The differences of non-AR eruptions from AR eruptions were found to be mainly due to different character and strength of the photospheric magnetic fields underneath. The magnetic fields in non-AR events are weaker, with opposite polarities chaotically alternating on small spatial scales, while the sizes of non-AR eruptive filaments are much larger than those in AR eruptions. These factors probably determine different parameters (and, possibly, particularities of scenarios) of the two kinds of eruptions. For all these reasons, a causal relationship between an eruptive flare, CME development, and ICME expansion must exist, and a quantitative correspondence between their parameters is expected. All of these parameters appear to be determined by the eruptive magnetic flux, which is directly related to the primary driver of the flare-CME phenomenon, the non-potential magnetic field in the corona. The larger the reconnected/eruptive magnetic flux, the more powerful eruption, the stronger flare, the faster CME, and eventually, the deeper FD and severer GMS (if a negative is present) with a shorter delay after eruption are expected.
The dependencies outlined above are expressed in the analytical form with empirical expressions (Equations (\irefE-forbush) – (\irefE-tp)). They form a tentative tool allowing one to make an early diagnosis of geoefficiency of solar eruptions and to carry out a short-term forecasting of main parameters of non-recurrent space weather disturbances, including estimations of a probable GMS intensity (if a negative is present). The latter were obtained by assuming that the corresponding ICMEs contain the necessary southern component, as well as all the events analyzed here. Already at the time close to the maximum of corresponding soft X-ray flares by using the solar EUV images and magnetograms, one can evaluate the magnetic flux in dimmings and arcade and tentatively estimate with this tool the expected maximum value of the GMS intensity as well as the onset and peak times and the FD magnitude in advance from one day for strongest eruptions to four days for relatively weak ones. It should be remembered only that the dependencies presented above were obtained for sufficiently large eruptions, which produced strong geomagnetic storms of Dst nT.
4.2 Measurement Issues
S-measurement_issues The major uncertainties of our results are most likely due to insufficiently known, quantified, or simply missed factors related to ICMEs (size, configuration, orientation, background solar wind, etc.; see, e.g., \openciteRichardsonCane2011) and circumstances of their encounter with the Earth Marubashi et al. (2012). In this section we comment on uncertainties of measurements from solar data and possible ways of future improvements. Errors appear in measurements from magnetograms and identification of arcade and dimming regions.
-
•
We mainly considered eruptions near the central meridian. Nevertheless, regions of our analysis in some events extended rather far from the solar disk center that could decrease the measured total magnetic fluxes. We do not apply a radialization correction of magnetograms, because a CME involves magnetic fields of unknown orientations, and the radialization of the observed line-of-sight magnetic component in this case might not provide correct estimates. However, the correction factors, which could be routinely applied, do not significantly differ from unity for the majority of events. For example, possible corrections for the pronouncedly non-central 2010/04/03 event (Figure \irefF-fig2) are 15% for the area and 9.6% for the magnetic field strength. A promising way to evaluate the total flux more accurately is a magnetic field extrapolation, which allows one to reconstruct the whole magnetic field vector. On the other hand, a non-central position of an eruption implies a non-central encounter of the corresponding ICME with the Earth that makes adequacy of such corrections for our task questionable. Moreover, dimmings located far from an eruption center are usually diffuse and shallow and therefore automatically excluded by our selection criterion. For all these reasons, we do not apply the projection corrections.
-
•
Some SOHO/MDI magnetograms suffer from the ‘saturation’ in sunspot umbrae due to limitations of the on-board data processing Liu, Norton, and Scherrer (2007). The maximum field strength can be underestimated by . This artifact can affect measurements in strongest events, when flare arcades cross sunspot umbrae, and distort surrounding magnetic fields extrapolated from such magnetograms. We cannot reliably compensate for such artifacts.
-
•
The contribution from noise in both 1-min and 5-min magnetograms to our results is reduced (), because we use rebinned magnetograms, in which four original MDI pixels are averaged. Also, we consider severe GMSs (and large associated FDs) caused by powerful solar eruptions including sufficiently deep quasi-stationary dimmings. Such dimmings develop in regions of increased brightness, i.e., preferentially above photospheric regions with enhanced magnetic fields like plages (see also \openciteChertokGrechnev2005), so that the relative contribution from noises is less important than in weaker-field quiet Sun’s regions.
-
•
Our identification of arcades and dimmings by using relative thresholds ensures homogeneity of measurements. Identification in events associated with very bright flares was complicated by scattered light and overexposure effects like bright streaks crossing the eruption site. Considerable contributions from these distortions to our results are not expected, because each of such events was carefully processed interactively.
4.3 Tentative Diagnostic Tool
As an experiment, a tentative short-term forecasting of space weather disturbances by using the presented results of solar eruption diagnostics was carried out in the IZMIRAN Center of Space Weather Forecasting during 2010 when the whole set of SOHO data was available. Eruptions of the current 24th cycle from the central zone of the solar disk were considered. Judging from parameters of dimmings and arcades, the majority of them was relatively small and according to estimations should have resulted in rather faint space weather disturbances, and this was really the case. One of the most significant eruptions of 2010 occurred on 3 April in association with a B7.4 soft X-ray flare, which peaked at 09:54 UT. The dimmings and arcade observed in this eruption are shown in Figure \irefF-fig2. Their total magnetic flux in this case was Mx. The estimated FD magnitude and probable maximum GMS intensity Dst nT corresponded to such an eruptive magnetic flux. The actually observed was close to the expected FD value, but the observed Dst nT turned out to be somewhat weaker than the estimated GMS intensity indicated above. Such a combination of the FD and GMS values is possible when the southward component of the ICME magnetic field comprises only a part of the total magnetic field in an ICME. Data of the OMNI catalog (http://omniweb.gsfc.nasa.gov/) reveal that this was really the case: during the Dst peak, the southwards component was about a half of the total field. As for the transit times, the observed onset time h was somewhat less than the estimated h, but the observed peak time h was close to the expected value h. Approximately a similar correspondence between the estimated and observed values was obtained in diagnostics of other sufficiently large eruptions, which occurred in 2010 under the near-minimum solar cycle conditions.
The described tentative tool based on calculations of the dimming and arcade eruptive magnetic flux provides the earliest diagnostics of the solar eruption geoeffectiveness and the shortest lead time to forecast the maximum intensity, onset and peak times of the forthcoming GMSs and FDs. We anticipate that this tool would be used in future as a starting component of combination of methods for short-term GMS and FD forecasting including also those based on measurements of near-the-Sun CMEs, MHD models, stereoscopic observations of ICME propagation, and others (see Section \irefS-introduction). A future real-time forecasting thus could start just from near-solar-surface manifestations of an earthward eruption and then specified as additional data would come in the course of its expansion.
We consider the proposed tool as a preliminary one, because a number of important issues should be addressed further for its elaboration. First of all, the dependence of the Dst value on the eruptive magnetic flux inferred in our study should be complemented by taking account of the sign and strength of the component in an ICME. This requires relating with parameters of a solar source region. Further, for practical application of the proposed quantitative diagnostic tool at the present observational situation, it is necessary to develop procedures to transit from EIT images and MDI magnetograms obtained with SOHO during the 23th cycle to corresponding AIA images and HMI magnetograms gathered at the present time with SDO (see \openciteLiu2012).
Acknowledgements
We are grateful to an anonymous reviewer for useful remarks. The authors thank the SOHO EIT, MDI, LASCO teams and the CDAW participants for data and materials used in the present study. SOHO is a project of international cooperation between ESA and NASA. This research was supported by the Russian Foundation of Basic Research under grants 09-02-00115, 11-02-00757, and 12-02-00037, the Program of basic research of the RAS Presidium No. 22, and the Russian Ministry of Education and Science under State Contract 16.518.11.7065.
References
- Belov (2009) Belov, A.V.: 2009, In: Gopalswamy, N., Webb, D.F. (eds.), Universal Heliospheric Processes, IAU Symp. 257, 439.
- Belov et al. (2005) Belov, A., Baisultanova, L., Eroshenko, E., Mavromichalaki, H., Yanke, V., Pchelkin, V., Plainaki, C., Mariatos, G.: 2005, J. Geophys. Res. 110, A09S20.
- Bothmer and Zhukov (2007) Bothmer V., Zhukov A.: 2007, In: Bothmer, V. and Daglis, I.A. (eds.) Space Weather - Physics and Effects, Praxis Publishing, Chichester, UK, 31.
- Brueckner et al. (1995) Brueckner, G.E., Howard, R.A., Koomen, M.J., Korendyke, C.M., Michels, D.J., Moses, J.D., et al.: 1995, Sol. Phys. 162, 357.
- Cane (2000) Cane, H.V.: 2000, J. Geophys. Res. 98, 3509.
- Chertok and Grechnev (2005) Chertok, I.M., Grechnev, V.V.: 2005, Sol. Phys. 229, 95.
- Chertok and Grechnev (2006) Chertok, I.M., Grechnev, V.V.: 2006, Bull. Russian Acad. Sci. Phys. 70, 1717.
- Chertok, Belov, and Grechnev (2011) Chertok, I.M., Belov, A.V., Grechnev, V.V.: 2011, Bull. Russian Acad. Sci. Phys. 75, 796.
- Chertok, Grechnev, and Uralov (2009) Chertok, I.M., Grechnev, V.V., Uralov, A.M.: 2009, Astron. Rep. 53, 355.
- Cliver and Svalgaard (2004) Cliver, E.W., Svalgaard, L.: 2004, Sol. Phys. 224, 407.
- Delaboudinière et al. (1995) Delaboudinière, J.-P., Artzner, G.E., Brunaud, J., Gabriel, A.H., Hochedez, J.F., Millier, F., et al.: 1995, Sol. Phys. 162, 291.
- Dèmoulin (2008) Dèmoulin, P.: 2008, Ann. Geophys. 26, 3113.
- Gibson and Fan (2008) Gibson, S.E., Fan, Y.: 2008, J. Geophys. Res. 113, A09103.
- Gopalswamy (2009) Gopalswamy, N.: 2009, In: Tsuda, T., Fujii, R., Shibata, K., Geller, M.A. (eds.) Climate and Weather of the Sun-Earth System (CAWSES): Selected Papers from the 2007 Kyoto Symp., Terra Scientific Publishing, Tokyo, 77.
- Gopalswamy (2010) Gopalswamy, N.: 2010, In: Dorotovic, I. (ed.) Proc. 20th Slovak National Solar Phys. Meeting, Slovak Central Observatory, Hurbanovo, Slovakia, 108.
- Gopalswamy and Xie (2008) Gopalswamy, N., Xie, H.: 2008, J. Geophys. Res. 113, A10105.
- Gopalswamy et al. (2001) Gopalswamy, N., Lara, A., Yashiro, S., Kaiser, M.L., Howard, R.A.: 2001, J. Geophys. Res. 106, 29207.
- Gopalswamy et al. (2005) Gopalswamy, N., Yashiro, S., Michalek, G., Xie, H., Lepping, R.P., Howard, R.A.: 2005, Geophys. Res. Lett. 32, L12S09.
- Gosling (1993) Gosling, J.T.: 1993, J. Geophys. Res. 113, 18937.
- Harra et al. (2011) Harra, L.K., Mandrini, C.H., Dasso, S., Gulisano, A.M., Steed, K., Imada, S.: 2011, Sol. Phys. 268, 213.
- Hudson and Cliver (2001) Hudson, H.S., Cliver, E.W.: 2001, J. Geophys. Res. 106, 25199.
- Jackson et al. (2004) Jackson, B.V., Buffington, A., Hick, P.P., Altrock, R.C., Figueroa, S., Holladay, P.E. et al.: 2004, Sol. Phys. 2225, 177.
- Jackson et al. (2009) Jackson, B.V., Hick, P.P., Buffington, A., Bisi, M.M., Clover, J.M.: 2009, Ann. Geophys. 27, 4097.
- Kahler (1977) Kahler, S.: 1977, ApJ 214, 891.
- Kaiser et al. (2008) Kaiser, M.L., Kucera, T.A., Davila, J.M., St. Cyr, O.C., Guhathakurta, M., Christian, E.: 2008, Space Sci. Rev. 136, 5.
- Kang et al. (2006) Kang, S.-M., Moon, Y.-J., Cho, K.-S., Kim, Y.-H., Park, Y.D., Baek, J.-H., Chang, H.-Y.: 2006, J. Geophys. Res. 111, A05102.
- Kim, Moon, and Cho (2007) Kim, K.-H., Moon, Y.-J., Cho, K.-S.: 2007, J. Geophys. Res. 112, A05104.
- Kim et al. (2010) Kim, R.-S., Cho, K.-S, Moon, Y.-J., Dryer, M., Lee, J., Yi, Y., Kim, K.-H., Wong, H., Park, Y.-D., Kim, Y.-H.: 2010, J. Geophys. Res. 115, A12108.
- Krymskii et al. (1981) Krymskii, G.F., Kuz’min, A.I., Krivoshapkin, P.A., Samsonov, I.S., Skripin, G.V., Transkij, I.A., Chirkov, N.P.: 1981, Kosmicheskie luchi i solnechnyi veter (Cosmic Rays and Solar Wind), Nauka, Novosibirsk, 224 p.
- Kunow et al. (2006) Kunow, H., Crooker, N.U., Linker, J.A., Schwenn, R., Von Steiger, R. (eds.): 2006, Coronal Mass Ejections, Springer, Dordrecht.
- Lemen et al. (2012) Lemen, J.R., Title, A.M., Akin, D.J., Boerner, P.F., Chou, C., Drake, J.F., et al.: 2012, Sol. Phys. 275, 17.
- Liu, Norton, and Scherrer (2007) Liu, Y., Norton, A.A., Scherrer, P.H.: 2007, Sol. Phys. 241, 185.
- Liu et al. (2010) Liu, Y., Davies, J.A., Luhmann, J.G., Vourlidas, A., Bale, S.D., Lin, R.P.: 2010, ApJ 710, L82.
- Liu et al. (2012) Liu, Y., Hoeksema, J.T., Scherrer, P.H., Schou, J., Couvidat, S., Bush, R.I., Duvall, T.L., Jr., Hayashi, K., Sun, X., Zhao, X.: 2012, Sol. Phys. 279, 295.
- Lugaz et al. (2010) Lugaz, N., Hernandez-Charpak, J.N., Roussev, I.I., Davis, C.J., Vourlidas, A., Davies, J.A.: 2010, ApJ 715, 493.
- Mandrini et al. (2007) Mandrini, C.H., Nakwacki, M.S., Attrill, G., van Driel-Gesztelyi, L., Dèmoulin, P., Dasso, S., Elliott, H.: 2007, Sol. Phys. 244, 25.
- Mandrini et al. (2009) Mandrini, C.H., Nakwacki, M.S., Attrill, G., van Driel-Gesztelyi, L., Dasso, S., Dèmoulin, P.: 2009, In: Gopalswamy, N., Webb, D.F. (eds.), Universal Heliospheric Processes, IAU Symp. 257, 265.
- Manoharan (2010) Manoharan, P.K.: 2010, Sol. Phys. 265, 137.
- Marubashi et al. (2012) Marubashi, K., Cho, K.-S., Kim, Y.-H., Park, Y.-D., Park, S.-H.: 2012, J. Geophys. Res. 117, A01101.
- Michalek, Gopalswamy, and Yashiro (2008) Michalek, G., Gopalswamy, N., Yashiro, S.: 2008, Sol. Phys. 248, 113.
- Miklenic, Veronig, and Vršnak (2009) Miklenic, C.H., Veronig, A.M., Vršnak, B.: 2009, A&A 499, 893.
- Qiu et al. (2007) Qiu, J., Hu, Q., Howard, T.A., Yurchyshyn, V.B.: 2007, ApJ 659, 758.
- Richardson and Cane (2010) Richardson, I.G., Cane, H.V.: 2010, Sol. Phys. 264, 189.
- Richardson and Cane (2011) Richardson, I.G., Cane, H.V.: 2011, Sol. Phys. 270, 609.
- Richardson et al. (2006) Richardson, I.G., Webb, D.F., Zhang, J., Berdichevsky, D.B., Biesecker, D.A., Kasper, J.C., et al.: 2006, J. Geophys. Res. 111, A07S09.
- Schmieder et al. (2011) Schmieder, B. , Dèmoulin, P., Pariat, E., Török, T., Molodij, G., Mandrini, C.H., et al.: 2011, Adv. Space Res. 47, 2081.
- Scherrer et al. (1995) Scherrer, P.H., Bogart, R.S., Bush, R.I., Hoeksema, J.T., Kosovichev, A.G., Schou, J., et al.: 1995, Sol. Phys. 162, 129.
- Siscoe, Crooker, and Clauer (2006) Siscoe, G., Crooker, N.U., Clauer, C.R.: 2006, Adv. Space Res. 38, 173.
- Siscoe and Schwenn (2006) Siscoe, G., Schwenn, R.: 2006, Space Sci. Rev. 123, 453.
- Smith et al. (2009) Smith, Z.K., Steenburgh, R., Fry, C.D., Dryer, M.: 2009, Space Weather 7, S12005.
- Song et al. (2006) Song, H., Yurchyshyn, V., Yang, G., Tan, C., Chen, W., Wang, H.: 2006, Sol. Phys. 238, 141.
- Sterling and Hudson (1997) Sterling, A.C., Hudson, H.S.: 1997, ApJ 491, L55.
- Sterling et al. (2000) Sterling, A.C., Hudson, H.S., Thompson, B.J., Zarro, D.: 2000, ApJ 532, 628.
- Švestka (2001) Švestka, Z.: 2001, Space Sci. Rev. 95, 135.
- Taktakishvili et al. (2009) Taktakishvili, A., Kuznetsova, M., MacNeice, P., Hesse, M., Rastätter, L., Pulkkinen, A., Chulaki, A., Odstrcil, D.: 2009, Space Weather 7, S03004.
- Thompson et al. (1998) Thompson, B.J., Plunkett, S.P., Gurman, J.B., Newmark, J.S., St. Cyr, O.C., Michels, D.J.: 1998, Geophys. Res. Lett. 25, 2465.
- Thompson et al. (2000) Thompson, B.J., Cliver, E.W., Nitta, N., Delannée, C., Delaboudinière, J.-P.: 2000, Geophys. Res. Lett. 27, 1431.
- Tripathi, Bothmer, and Cremades (2004) Tripathi, D., Bothmer, V., Cremades, H.: 2004, A&A 422, 337.
- Vršnak, Sugar, and Ruždjak (2005) Vršnak, B., Sudar, D., Ruždjak, D.: 2005, A&A 435, 1149.
- Vršnak et al. (2010) Vršnak, B., Žic, T., Falkenberg, T.V., Möstl, C., Vennerstrom, S., Vrbanec, D.: 2010, A&A 512, A43.
- Wang et al. (2002) Wang, Y.M., Ye, P.Z., Wang, S., Zhau, G.P., Wang, J.: 2002, J. Geophys. Res. 107, 1340.
- Webb et al. (2000) Webb, D.F., Lepping, R.P., Burlaga, L.F., DeForest, C.E., Larson, D.E., Martin, S.F., Plunkett, S.P., Rust, D.M.: 2000, J. Geophys. Res. 105, 27251.
- Webb et al. (2009) Webb, D.F., Howard, T.A., Fry, C.D., Kuchar, T.A., Mizuno, D.R., Johnston, J.C., Jackson, B.V.: 2009, Space Weather 7, S05002.
- Wood et al. (2011) Wood, B.E., Wu, C.-C., Howard, R.A., Socker, D.G., Rouillard, A.P.: 2011, ApJ 729, 70.
- Xie et al. (2006) Xie, H., Gopalswamy, N., Ofman, L., St. Cyr, O.C., Michalek, G., Lara, A., Yashiro, S.: 2006, Space Weather, 4, S10002.
- Yashiro et al. (2004) Yashiro, S., Gopalswamy, N., Michalek, G., St. Cyr, O.C., Plunkett, S.P., Rich, N.B., Howard, R.A.: 2004, J. Geophys. Res. 109, A07105.
- Yurchyshyn, Hu, and Abramenko (2005) Yurchyshyn, V., Hu, Q., Abramenko, V.: 2005, Space Weather 3, S08C02.
- Yurchyshyn, Wang, and Abramenko (2004) Yurchyshyn, V., Wang, H., Abramenko, V.: 2004, Space Weather 2, S02001.
- Yurchyshyn and Tripathi (2009) Yurchyshyn, V., Tripathi, D.: 2009, Adv. Geoscience, 21, 51.
- Zhang et al. (2007a) Zhang, J., Richardson, I.G., Webb, D.F., Gopalswamy, N., Huttunen, E., Kasper, J., et al.: 2007a, J. Geophys. Res. 112, A10102.
- Zhang et al. (2007b) Zhang, J., Richardson, I.G., Webb, D.F., Gopalswamy, N., Huttunen, E., Kasper, J., et al.: 2007b, J. Geophys. Res. 112, A12103.
- Zhang et al. (2007c) Zhang, Y., Wang, J., Attrill, G., Harra, L.K., Yang, Z., He, X.: 2007c, Sol. Phys. 241, 329.
- Zhukov (2005) Zhukov, A.N.: 2005, In: Dere, K., Wang, J., Yan, Y. (eds.), Coronal and Stellar Mass Ejections, IAU Symp. 226, 437.
- Zhukov and Veselovsky (2007) Zhukov, A.N., Veselovsky I.S.: 2007, ApJ 664, L131.