Genome-wide analysis points to roles for extracellular matrix remodeling, the visual cycle, and neuronal development in myopia
Abstract
Myopia, or nearsightedness, is the most common eye disorder, resulting primarily from excess elongation of the eye. The etiology of myopia, although known to be complex, is poorly understood. Here we report the largest ever genome-wide association study (43,360 participants) on myopia in Europeans. We performed a survival analysis on age of myopia onset and identified 19 significant associations (), two of which are replications of earlier associations with refractive error. These 19 associations in total explain 2.7% of the variance in myopia age of onset, and point towards a number of different mechanisms behind the development of myopia. One association is in the gene PRSS56, which has previously been linked to abnormally small eyes; one is in a gene that forms part of the extracellular matrix (LAMA2); two are in or near genes involved in the regeneration of 11-cis-retinal (RGR and RDH5); two are near genes known to be involved in the growth and guidance of retinal ganglion cells (ZIC2, SFRP1); and five are in or near genes involved in neuronal signaling or development. These novel findings point towards multiple genetic factors involved in the development of myopia and suggest that complex interactions between extracellular matrix remodeling, neuronal development, and visual signals from the retina may underlie the development of myopia in humans.
Author Summary
The genetic basis of myopia, or nearsightedness, is believed to be complex and affected by multiple genes. Two genetic association studies have each identified a single genetic region associated with myopia in European populations. Here we report the results of the largest ever genetic association study on myopia in over 40,000 people of European ancestry. We identified 19 genetic regions significantly associated with myopia age of onset. Two are replications of the previously identified associations, and 17 are novel. Thirteen of the novel associations are in or near genes implicated in eye development, neuronal development and signaling, the visual cycle of the retina, and general morphology: DLG2, KCNMA1, KCNQ5, LAMA2, LRRC4C, PRSS56, RBFOX1, RDH5, RGR, SFRP1, TJP2, ZBTB38, and ZIC2. These findings point to numerous biological pathways involved in the development of myopia, and in particular, suggest that early eye and neuronal development may lead to the eventual development of myopia in humans.
Introduction
Myopia, or nearsightedness, is the most common eye disorder worldwide. In the United States, an estimated 30-40% of the adult population has clinically relevant myopia (more severe than -1 diopter), and the prevalence has increased markedly in the last 30 years [1, 2]. Myopia is a refractive error that results primarily from increased axial length of the eye [3]. The increased physical length of the eye relative to optical length causes images to be focused in front of the retina, resulting in blurred vision.
The etiology of myopia is multifactorial [3]. Briefly, postnatal eye growth is directed by visual stimuli that evoke a signaling cascade within the eye. This cascade is initiated in the retina and passes through the choroid to guide remodeling of the sclera (the white part of the eye) (cf. [4, 5]). Animal models implicate these visually-guided alterations of the scleral extracellular matrix in the eventual development of myopia. [6, 4].
In humans the eye typically grows about 5 mm from birth to age six, during which time vision typically improves [7]. At age six only about 2% of children are myopic [7]. Although the eye grows only 0.5 mm through puberty [8], the incidence of myopia increases sevenfold [7], peaking between the ages 9–14 [9]. Myopia developed during childhood or early adolescence generally worsens throughout adolescence and then stabilizes by age 20. Compared to myopia that develops in childhood or adolescence, adult onset myopia tends to be less severe [10, 11, 12].
Although epidemiological studies have implicated numerous environmental factors in the development of myopia, most notably education, outdoor exposure, reading, and near work [3], it is well established that genetics plays a substantial role. Twin and sibling studies have provided heritability estimates that range from 50% to over 90% [13, 14, 15, 16, 17]. Children of myopic parents tend to have longer eyes and are at increased risk of developing myopia in childhood [18]. Segregation analyses suggest that multiple genes are involved in the development of myopia [19, 20]. To date, there have been seven genome-wide association studies (GWAS) on myopia or related phenotypes (pathological myopia, refractive index, and ocular axial length): two in Europeans [21, 22] and five in Asian populations [23, 24, 25, 26, 27]. Each of these publications has identified a different single association with myopia. In addition there have been several linkage studies (see [28, 3] for reviews) and an exome sequencing study of severe myopia [29].
In contrast to the previous relatively small (up to approximately 5,000 initial cases) GWAS that used degree of refractive error as a quantitative dependent measure, we analyzed data for 43,360 individuals from the 23andMe database who reported whether they had been diagnosed with nearsightedness, and if so, at what age. We performed a genome-wide survival analysis on age of onset of myopia, discovering 19 genome-wide significant associations with myopia age of onset, 17 of which are novel.
Results and Discussion
Participants reported via a web-based questionnaire whether they had been diagnosed with nearsightedness, and if so, at what age. All participants were customers of 23andMe and of primarily European ancestry; no pair was more closely related than at the level of first cousins. We performed a genome-wide survival analysis using a Cox proportional hazards model on 43,360 individuals (“discovery set”). This model assumes that there is an (unknown) baseline probability of developing myopia at every year of age. The model then tests whether each single nucleotide polymorphism (SNP) is associated with a significantly higher or lower probability of developing myopia compared to baseline. The Cox model can be thought of as a generalization of an analysis of myopia age of onset. In contrast to an analysis of age of onset, the Cox model allows for the inclusion of non-myopic controls, resulting in considerably increased statistical power. Analyses controlled for sex and five principal components of genetic ancestry. An additional, non-overlapping set of 4,277 participants who answered a separate question about their use of corrective eyewear for nearsightedness before the age of ten were used as a replication set. See Table 1 for characteristics of the two cohorts.
| Number | % female | Age (SE) | Age of onset (SE) | |
|---|---|---|---|---|
| Discovery, myopic | 26038 | 46.1 | 48.6 (15.7) | 16.4 (11.0) |
| Discovery, not myopic | 17322 | 39.6 | 49.1 (17.1) | — |
| Replication, myopic at 10 | 800 | 45.1 | 47.7 (14.9) | |
| Replication, not myopic at 10 | 3477 | 45.2 | 50.0 (16.6) | — |
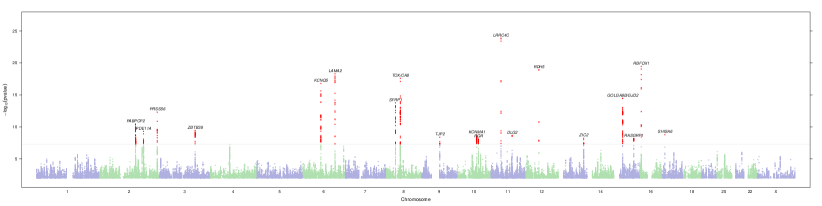
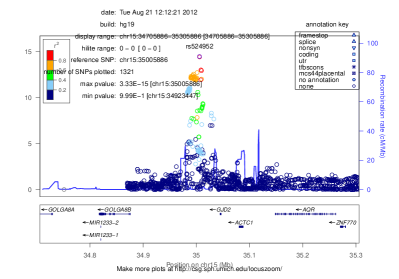
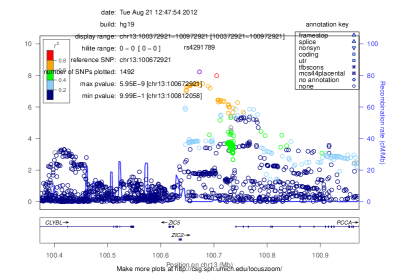
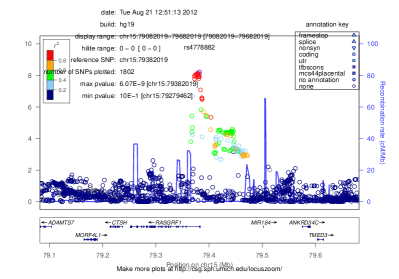
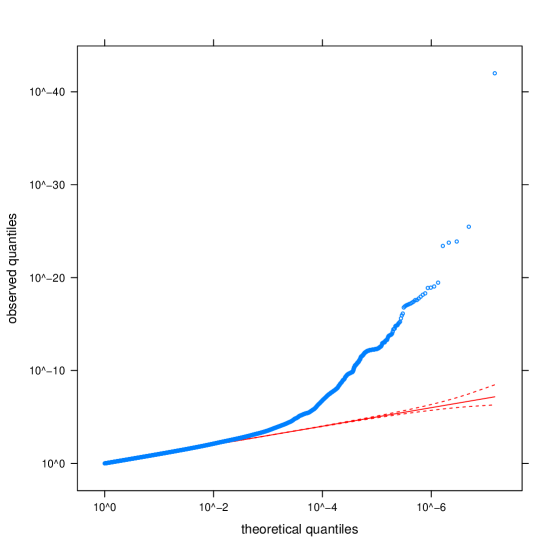
Table 2 shows the top SNPs for all 27 genetic regions associated with myopia with a -value smaller than . All -values from the GWAS have been corrected for the inflation factor of 1.14. A total of 19 of the SNPs cross our threshold for genome-wide significance (, see Figure S1). These 19 include two SNPs previously associated with refractive error in GWAS of European populations: rs524952 near GJD2 and ACTC1 and rs4778882 near RASGRF1 [22, 30, 21]. -values genome-wide are shown in Figure 1; Figure S2 shows the quantile-quantile plot for the analysis.
| rsid | chr | Position | Genes | MAF | allele | HR (CI) | -value | ||
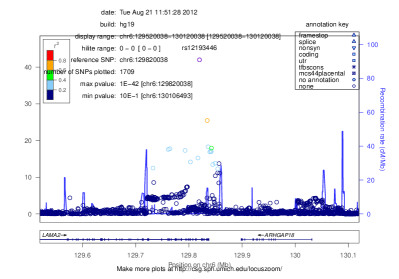
| rs12193446 | 6 | 129820038 | LAMA2 | 0.094 | 0.991 | A/G | 0.798 (0.773 – 0.823) | ||
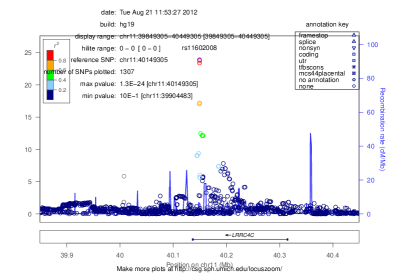
| rs11602008 | 11 | 40149305 | LRRC4C | 0.160 | 0.887 | A/T | 1.149 (1.121 – 1.177) | 0.012 | |
| rs17648524 | 16 | 7459683 | RBFOX1 | 0.364 | 0.974 | G/C | 1.095 (1.075 – 1.114) | 0.27 | |
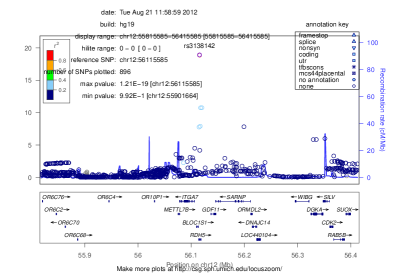
| rs3138142 | 12 | 56115585 | RDH5 | 0.218 | 0.817 | C/T | 0.892 (0.872 – 0.913) | 0.0074 | |
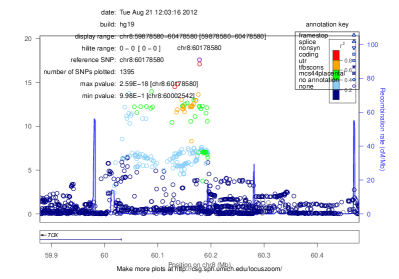
| chr8:60178580 | 8 | 60178580 | TOX/CA8 | 0.358 | 0.970 | C/G | 0.917 (0.900 – 0.934) | 0.26 | |
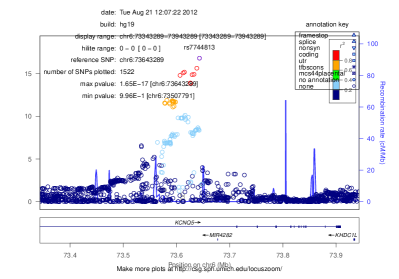
| rs7744813 | 6 | 73643289 | KCNQ5 | 0.405 | 0.955 | A/C | 0.920 (0.904 – 0.937) | 0.0016 | |
| rs524952 | 15 | 35005886 | GOLGA8B/GJD2 | 0.468 | 0.980 | T/A | 1.078 (1.059 – 1.097) | 0.0019 | |
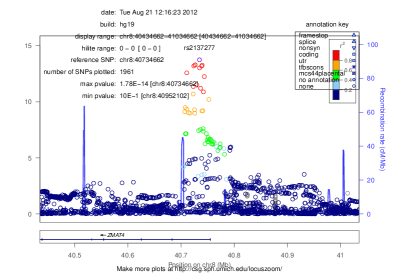
| rs2137277 | 8 | 40734662 | SFRP1 | 0.189 | 0.922 | A/G | 0.908 (0.887 – 0.929) | 0.52 | |
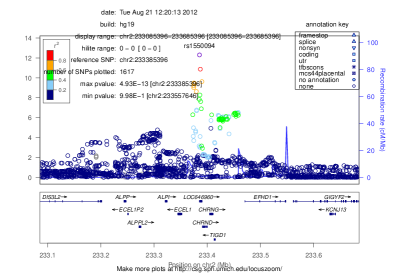
| rs1550094 | 2 | 233385396 | PRSS56 | 0.306 | 0.963 | A/G | 1.077 (1.057 – 1.098) | 0.019 | |
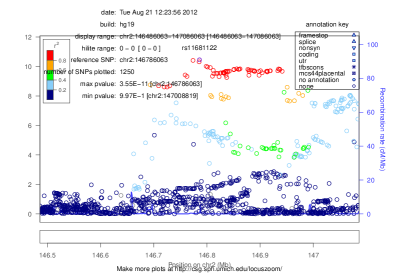
| rs11681122 | 2 | 146786063 | PABPCP2 | 0.425 | 0.940 | A/G | 0.937 (0.920 – 0.954) | 0.085 | |
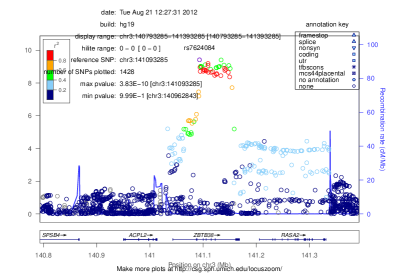
| rs7624084 | 3 | 141093285 | ZBTB38 | 0.435 | 0.961 | T/C | 0.942 (0.925 – 0.959) | 0.19 | |
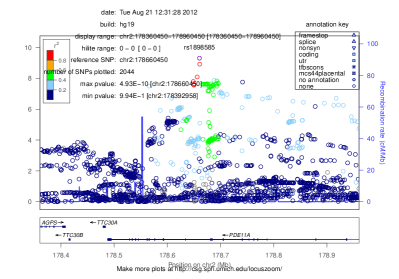
| rs1898585 | 2 | 178660450 | PDE11A | 0.163 | 0.942 | C/T | 1.085 (1.059 – 1.111) | 0.011 | |
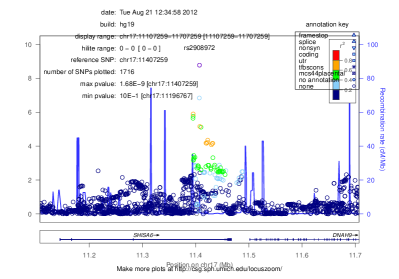
| rs2908972 | 17 | 11407259 | SHISA6 | 0.397 | 0.970 | T/A | 1.060 (1.042 – 1.079) | 0.053 | |
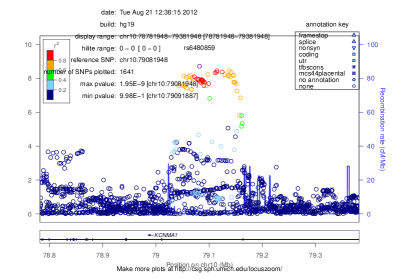
| rs6480859 | 10 | 79081948 | KCNMA1 | 0.363 | 0.987 | C/T | 1.060 (1.042 – 1.079) | 0.82 | |
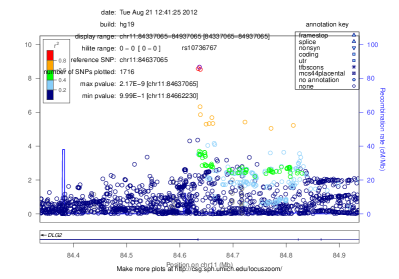
| rs10736767 | 11 | 84637065 | DLG2 | 0.451 | 0.996 | A/C | 1.058 (1.040 – 1.077) | 0.53 | |
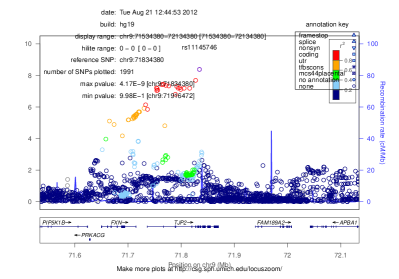
| rs11145746 | 9 | 71834380 | TJP2 | 0.198 | 0.886 | G/A | 1.076 (1.052 – 1.100) | 0.77 | |
| rs4291789 | 13 | 100672921 | ZIC2 | 0.326 | 0.724 | C/G | 1.070 (1.048 – 1.093) | ||
| rs4778882 | 15 | 79382019 | RASGRF1 | 0.399 | 0.951 | A/G | 1.059 (1.040 – 1.078) | 0.017 | |
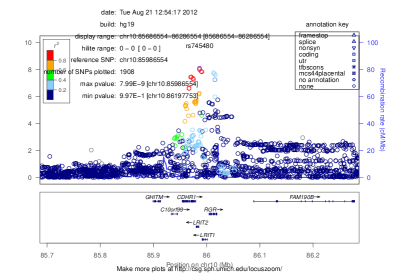
| rs745480 | 10 | 85986554 | RGR | 0.474 | 0.975 | C/G | 1.056 (1.038 – 1.075) | 0.32 | |
| rs5022942 | 4 | 81959966 | BMP3 | 0.229 | 0.991 | G/A | 1.063 (1.041 – 1.085) | 0.21 | |
| rs9365619 | 6 | 164251746 | QKI | 0.457 | 0.999 | C/A | 1.051 (1.033 – 1.069) | 0.097 | |
| rs1031004 | 4 | 80516849 | ANTXR2 | 0.261 | 0.983 | T/A | 1.058 (1.037 – 1.079) | 0.62 | |
| rs17428076 | 2 | 172851936 | HAT1/MAP1D | 0.236 | 0.985 | C/G | 0.943 (0.924 – 0.963) | 0.18 | |
| chr14:54413001 | 14 | 54413001 | BMP4 | 0.489 | 0.930 | G/C | 0.952 (0.935 – 0.969) | 0.38 | |
| rs7272323 | 20 | 4756691 | PRND/RASSF2 | 0.409 | 0.955 | C/G | 1.050 (1.031 – 1.068) | 0.015 | |
| chr11:65348347 | 11 | 65348347 | EHBP1L1 | 0.017 | 0.558 | G/A | 0.781 (0.711 – 0.858) | 0.97 | |
| rs55819392 | 21 | 40038207 | ERG/ETS2 | 0.259 | 0.987 | G/A | 0.949 (0.930 – 0.968) | 0.014 |
Of the 19 SNPs significant in the discovery set, nine were also significant in the replication set (Table 2). As the replication set was small (barely a tenth the size of the discovery set) and measured age of onset less exactly, it is not surprising that not all SNPs replicated. We defined a genetic myopia propensity score as the number of copies of the risk alleles across all 19 SNPs identified via the discovery set. The propensity score showed a strong association with early onset myopia (less than 10 years old) in our replication cohort (, odds ratio 1.08 per risk allele). The top decile of genetic propensity had 2.54 greater odds of developing myopia before the age of 10 than the bottom decile. In a Cox model fit to the discovery set, the propensity score explains 2.7% of the total variance. Note that this estimate may be inflated, as it is calculated on the discovery population. In this model, someone in the 90th percentile of risk (a score of 21.4) is nearly twice as likely to develop myopia by the age of 60 as someone in the 10th percentile of risk (score of 14.3), Figure 2.

Of the 17 novel associations, many lie in or near genes with direct links to processes related to myopia development. Below, we briefly sketch out possible connections between these associations and extracellular matrix (ECM) remodeling, the visual cycle, eye and body growth, retinal neuron development, and general neuronal development or signaling.
Extracellular Matrix Remodeling
The strongest association is a SNP in an intron of LAMA2 (laminin, alpha 2 subunit, rs12193446, , hazard ratio (HR) 0.80). Laminins are extracellular structural proteins that are integral parts of the ECM. Changes in the composition of the ECM of the sclera have been shown to alter the axial length of the eye [5]. Laminins play a role in the development and maintenance of different eye structures [31, 32]. The laminin alpha 2 chain is found in the extraocular muscles during development [31], and may act as an adhesive substrate and possibly a guidance cue for retinal ganglion cell growth cones [33]. We also found a suggestive association related to laminin (rs1031004, , HR=1.06) 312 kb upstream of ANTXR2 (anthrax toxin receptor 2). ANTXR2 binds laminin and possibly collagen type IV [34] and thus may also be involved in extracellular matrix remodeling.
The Visual Cycle
Two of the novel associations are in or near genes involved in the regeneration of 11-cis-retinal, the light sensitive component of photoreceptors; this regeneration is commonly referred to as the visual cycle of the retina. These associations are with rs3138142, , HR=0.89 in RDH5 (retinol dehydrogenase 5 (11-cis/9-cis)) and rs745480 (, HR=1.06), a SNP 18 kb upstream of RGR, which encodes the retinal G protein-coupled receptor. The SNP rs3138142 is a synonymous change in RDH5. It has been linked to RDH5 expression [35, 36], and it is part of an Nr2f2 (nuclear receptor subfamily 2, group F, member 2) transcription factor binding motif in mouse [37, 38]. Both RDH5 and RGR play crucial roles in the regeneration of 11-cis retinal in the retinal pigment epithelium (RPE) [39]. Mutations in RDH5 have been linked with fundus albipunctatus, a rare form of congenital stationary night blindness (for a recent review, see [40]) and progressive cone dystrophy [41], and mutations in RGR have been linked with autosomal recessive and autosomal dominant retinitis pigmentosa [42, 43].
We also identified an association within another gene that functions in the RPE: rs7744813 (, HR=0.92), a SNP in KCNQ5 (potassium voltage-gated channel, KQT-like subfamily, member 5). KCNQ5 encodes a potassium channel found in the RPE and neural retina. These channels are believed to contribute to ion flow across the RPE [44, 45] and to affect the function of cone and rod photoreceptors [45].
Eye and Body Growth
Three of our associations show possible links to eye or overall morphology. The first is a missense mutation in PRSS56 (A224T, rs1550094, , HR=1.08). Other mutations in PRSS56 have been shown to cause strikingly small eyes with severe decreases in axial length [46, 47, 48]. Two other associated SNPs are in linkage disequilibrium with SNPs previously associated with height: rs10113215 (, HR=0.92), near TOX and CA8 (thymus high mobility group box protein; carbonic anhydrase VIII), and rs7624084 (, HR=0.94), near ZBTB38 (zinc finger and BTB domain-containing protein 38). The SNPs rs10113215 and rs7624084 are in linkage disequilibrium (LD) with rs6569648 and rs6763931, respectively ( and ); both of which have been associated with height [49, 50].
Retinal Ganglion Cell Projections
Two of the novel associations are near genes that affect the outgrowth of retinal ganglion neurons during development. The first is rs4291789 (, HR=1.07), which lies 34 kb downstream of ZIC2 (Zic family member 2). ZIC2 regulates two independent parts of ipsilateral retinal ganglion cell development: axon repulsion at the optic chiasm midline [51, 52], and organization of the axonal projections at their final targets in the brain [53].
The second, rs2137277 (, HR=0.91), is a variant in ZMAT4 (zinc finger, matrin-type 4). ZMAT4 has no known link to vision, but this variant also lies 385 kb downstream of SFRP1 (secreted frizzled-related protein 1). SFRP1 is involved in the differentiation of the optic cup from the neural retina [54], retinal neurogenesis [55], the development and function of photoreceptor cells [56, 57], and the growth of retinal ganglion cells [58].
Neuronal Signaling and Development
Finally, we found five associations with SNPs in genes involved in neuronal development and signaling, but without a known role in vision development or the vision cycle: in KCNMA1 (potassium large conductance calcium-activated channel, subfamily M, alpha member 1; rs6480859, , HR=1.06); in RBFOX1 (RNA binding protein, fox-1 homolog; rs17648524, , HR=1.10); in LRRC4C, leucine rich repeating region containing 4C, also known as NGL-1 (rs11602008, , HR=1.15); in DLG2 (discs, large homolog 2; rs10736767, , HR=1.06); and in TJP2 (tight junction protein 2; rs11145746, , HR=1.08).
KCNMA1 encodes the pore-forming alpha subunit of a MaxiK channel, a family of large conductance, voltage and calcium-sensitive potassium channels involved in the control of smooth muscle and neuronal excitation. RBFOX1 belongs to a family of RNA binding proteins that regulates the alternative splicing of several neuronal transcripts implicated in neuronal development and maturation [59]. LRRC4C encodes a binding partner for netrin G1 and promotes the outgrowth of thalamocortical axons [60]. DLG2 plays a critical role in the formation and regulation of protein scaffolding at postsynaptic sites [61]. TJP2 has been linked with hearing loss: its duplication and subsequent overexpression are found in adult-onset progressive nonsyndromic hearing loss [62].
Conclusion
This study represents the largest GWAS on myopia in Europeans to date. This cohort of 43,360 individuals led to the discovery of 17 novel associations as well as replication of the two previously reported associations in Europeans. In contrast to the earlier studies that used refractive error as a quantitative outcome, we used a Cox proportional hazards model with age of onset of myopia as our major endpoint. This model yielded greater statistical power than a simple case-control study of myopia. Of the 19 significant SNPs found using this model, all but one had smaller -values when a hazards model was employed, and only 13 would be genome-wide significant using a case-control analysis on the same dataset (Table S1).
The proportional hazards model assumes that each SNP has a constant effect on the hazard of developing myopia at any age. When we tested the validity of this assumption for the 19 significant SNPs, five showed evidence of different effects at different ages (Table S2). While this violation should not lead to overly small -values for these SNPs in the GWAS, it does make risk prediction based on these results less straightforward. These age dependent hazards suggest that different biological processes may affect the development of myopia at different ages. For example, rs12193446 in LAMA2 shows a large effect on myopia hazard at an early age, peaking around 11 years, and then a null or even negative effect on hazard after the age of 30; other SNPs show different patterns of effect as a function of age (Figure S3).
Our findings further suggest that there may be somewhat different genetic factors underlying myopia age of onset and refractive error. Because adult onset myopia tends to be less severe than myopia developed in childhood or adolescence [10, 11, 12], age of onset is likely correlated with refractive error, but it is not known how strongly. Many of our associations showed a stronger signal than the two associations near GJD2 and near RASGRF1 previously linked with refractive error in Europeans. Notably, the latter association, near RASGRF1, also failed to replicate in a recent meta-analysis [30]. The fact that many of our associations with strong effects on age of onset have not shown up in previous refractive error GWAS implies that some genetic factors may affect the age of onset independent of eventual severity, and that the strength of different genetic associations with myopia may depend on the specific phenotype under study.
We also note that our phenotype was based on participants’ reports rather than clinical assessments. Although in theory errors in recall could have affected our results, we expect that the vast majority of people are able to recall when they first wore glasses with at most a few years of error.
The five associations previously reported in pathological myopia or refractive error GWAS in Asian populations [23, 24, 25, 26, 27] show no overlap with the significant or suggestive regions found here. Nor did we find an association with the ZNF644 locus that was identified as the site of high-penetrance, autosomal dominant mutations in Han Chinese families with apparent monogenic inheritance of high-grade myopia [29]. This lack of overlap is further evidence that the genetic factors involved in myopia differ across populations.
Our identification of 17 novel genetic associations suggests several novel genetic pathways in the development of human myopia. These findings augment existing research on the development of myopia, which to date has been studied primarily in animal models of artificially induced myopia. Some of the associations are consistent with the current view, based largely on animal models, that a visually-triggered signaling cascade from the retina ultimately guides the scleral remodeling that leads to eye growth, and that the RPE plays a key role in this process [4]. A number of the novel associations point to the potential importance of early neuronal development in the eventual development of myopia, particularly the growth and topographical organization of retinal ganglion cells. These associations suggest that early neuronal development may also contribute to future refractive errors. We expect that these findings will drive new research into the complex etiology of myopia.
Methods
Human Subjects
All participants were drawn from the customer base of 23andMe, Inc., a consumer genetics company. This cohort has been described in detail previously [63, 64]. Participants provided informed consent and participated in the research online, under a protocol approved by the external AAHRPP-accredited IRB, Ethical & Independent Review Services (E&I Review).
Phenotype data
Participants in the discovery cohort were asked online as part of a medical history questionnaire: “Have you ever been diagnosed by a doctor with any of the following vision conditions?: Nearsightedness (near objects are clear, far objects are blurry) (Yes/No/I don’t know)”. If they answered “yes”, they were asked, “At what age were you first diagnosed with nearsightedness (near objects are clear, far objects are blurry)? Your best guess is fine.” Those reporting an age of onset outside of the range 0–100 were removed from analysis. All participants also reported current age.
The replication cohort consisted of 23andMe customers who were not part of the discovery cohort (i.e., they didn’t provide a nearsightedness diagnosis). They answered a single question “Did you wear glasses or other corrective eyewear for nearsightedness before the age of 10? (Yes/No/I’m not sure)”.
Genotyping and imputation
Participants were genotyped and additional SNP genotypes were imputed against the August 2010 release of the 1000 genomes data as described previously [65]. Briefly, they were genotyped on at least one of three genotyping platforms, two based on the Illumina HumanHap550+ BeadChip, the third based on the Illumina Human OmniExpress+ BeadChip. The platforms included assays for 586,916, 584,942, and 1,008,948 SNPs respectively. Genotypes for a total of 11,914,767 SNPs were imputed in batches of roughly 10,000 individuals, grouped by genotyping platform. Of these, 7,087,609 met our criteria of 0.005 minor allele frequency, average across batches of at least 0.5, and minimum across batches of at least 0.3. (The minimum requirement was added to filter out SNPs that imputed poorly in the batches consisting of the less dense platform.)
Statistical analysis
In order to minimize population substructure while maximizing statistical power, the study was limited to individuals with European ancestry. Ancestry was inferred from the genome-wide genotype data, and principal component analysis was performed as in [66, 63]. No two participants shared more than 700 cM of DNA identical by descent (IBD, approximately the lower end of sharing between a pair of first cousins). IBD was calculated using the methods described in [67].
For the survival analysis, let the hazard function be the rate of developing myopia at time . Then the Cox proportional hazards model is
for an arbitrary baseline hazard function and covariates (genotype), (sex) and (projections onto principal components). was coded as a dosage from 0–2 as the estimated number of minor alleles present.
For each SNP, we fit a Cox proportional hazards model using R [68] and computed a p-value using a likelihood ratio test for the genotype term. All SNPs with -values under after genomic control correction were considered genome-wide significant. The hazard ratio (HR) reported throughout can be interpreted as the multiplicative change in the rate of onset of myopia per copy of the minor allele (e.g., ). To test the proportional hazards assumption, we tested for independence of the scaled Schoenfeld residuals for each significant SNP and time using cox.zph (Table S2). Replication -values in Table 2 are one-sided -values for a logistic regression model controlling for age, sex, and five principal components.
For Figure 2, we computed a myopia propensity score for each individual as the (estimated) number of risk alleles among the 19 genome-wide significant SNPs. We then fit a Cox model including that score, sex, and five principal components. To estimate proportion variance explained for this model, we used a pseudo- using likelihoods (similar to the Nagelkerke pseudo for logistic regression). That is, we calculated the variance explained as
where is the null likelihood and the likelihood for the full model. This is one of several methods used to compute variance explained for Cox proportional hazards models [69].
Acknowledgments
We thank the customers of 23andMe for participating in this research and all the employees of 23andMe for their contributions to this work.
References
- [1] S. Vitale, R. D. Sperduto, and F. L. Ferris, “Increased prevalence of myopia in the United States between 1971-1972 and 1999-2004,” Arch. Ophthalmol., vol. 127, pp. 1632–1639, Dec 2009.
- [2] J. H. Kempen, P. Mitchell, K. E. Lee, J. M. Tielsch, A. T. Broman, H. R. Taylor, M. K. Ikram, N. G. Congdon, and B. J. O’Colmain, “The prevalence of refractive errors among adults in the United States, Western Europe, and Australia,” Arch. Ophthalmol., vol. 122, pp. 495–505, Apr 2004.
- [3] R. Wojciechowski, “Nature and nurture: the complex genetics of myopia and refractive error,” Clin. Genet., vol. 79, pp. 301–320, Apr 2011.
- [4] J. Rymer and C. F. Wildsoet, “The role of the retinal pigment epithelium in eye growth regulation and myopia: a review,” Vis. Neurosci., vol. 22, no. 3, pp. 251–261, 2005.
- [5] J. A. Rada, S. Shelton, and T. T. Norton, “The sclera and myopia,” Exp. Eye Res., vol. 82, pp. 185–200, Feb 2006.
- [6] C. Wildsoet and J. Wallman, “Choroidal and scleral mechanisms of compensation for spectacle lenses in chicks,” Vision Res., vol. 35, pp. 1175–1194, May 1995.
- [7] D. O. Mutti, K. Zadnik, and A. J. Adams, “Myopia. The nature versus nurture debate goes on,” Invest. Ophthalmol. Vis. Sci., vol. 37, pp. 952–957, May 1996.
- [8] H. C. Fledelius, “Ophthalmic changes from age of 10 to 18 years. A longitudinal study of sequels to low birth weight. IV. Ultrasound oculometry of vitreous and axial length,” Acta Ophthalmol (Copenh), vol. 60, pp. 403–411, Jun 1982.
- [9] D. S. Fan, D. S. Lam, R. F. Lam, J. T. Lau, K. S. Chong, E. Y. Cheung, R. Y. Lai, and S. J. Chew, “Prevalence, incidence, and progression of myopia of school children in Hong Kong,” Invest. Ophthalmol. Vis. Sci., vol. 45, pp. 1071–1075, Apr 2004.
- [10] H. C. Fledelius, “Myopia of adult onset. Can analyses be based on patient memory?,” Acta Ophthalmol Scand, vol. 73, pp. 394–396, Oct 1995.
- [11] R. Iribarren, M. F. Cortinez, and J. P. Chiappe, “Age of first distance prescription and final myopic refractive error,” Ophthalmic Epidemiol, vol. 16, no. 2, pp. 84–89, 2009.
- [12] R. Iribarren, M. R. Cerrella, A. Armesto, G. Iribarren, and A. Fornaciari, “Age of lens use onset in a myopic sample of office-workers,” Curr. Eye Res., vol. 28, pp. 175–180, Mar 2004.
- [13] C. J. Hammond, H. Snieder, C. E. Gilbert, and T. D. Spector, “Genes and environment in refractive error: the twin eye study,” Invest. Ophthalmol. Vis. Sci., vol. 42, pp. 1232–1236, May 2001.
- [14] N. Lyhne, A. K. Sj?lie, K. O. Kyvik, and A. Green, “The importance of genes and environment for ocular refraction and its determiners: a population based study among 20-45 year old twins,” Br J Ophthalmol, vol. 85, pp. 1470–1476, Dec 2001.
- [15] J. M. Teikari, J. O’Donnell, J. Kaprio, and M. Koskenvuo, “Impact of heredity in myopia,” Hum. Hered., vol. 41, no. 3, pp. 151–156, 1991.
- [16] R. Wojciechowski, N. Congdon, H. Bowie, B. Munoz, D. Gilbert, and S. K. West, “Heritability of refractive error and familial aggregation of myopia in an elderly American population,” Invest. Ophthalmol. Vis. Sci., vol. 46, pp. 1588–1592, May 2005.
- [17] J. A. Peet, M. F. Cotch, R. Wojciechowski, J. E. Bailey-Wilson, and D. Stambolian, “Heritability and familial aggregation of refractive error in the Old Order Amish,” Invest. Ophthalmol. Vis. Sci., vol. 48, pp. 4002–4006, Sep 2007.
- [18] D. A. Goss and T. W. Jackson, “Clinical findings before the onset of myopia in youth: 4. Parental history of myopia,” Optom Vis Sci, vol. 73, pp. 279–282, Apr 1996.
- [19] A. P. Klein, P. Duggal, K. E. Lee, R. Klein, J. E. Bailey-Wilson, and B. E. Klein, “Support for polygenic influences on ocular refractive error,” Invest. Ophthalmol. Vis. Sci., vol. 46, pp. 442–446, Feb 2005.
- [20] G. C. Ashton, “Segregation analysis of ocular refraction and myopia,” Hum. Hered., vol. 35, no. 4, pp. 232–239, 1985.
- [21] A. M. Solouki, V. J. Verhoeven, C. M. van Duijn, A. J. Verkerk, M. K. Ikram, P. G. Hysi, D. D. Despriet, L. M. van Koolwijk, L. Ho, W. D. Ramdas, M. Czudowska, R. W. Kuijpers, N. Amin, M. Struchalin, Y. S. Aulchenko, G. van Rij, F. C. Riemslag, T. L. Young, D. A. Mackey, T. D. Spector, T. G. Gorgels, J. J. Willemse-Assink, A. Isaacs, R. Kramer, S. M. Swagemakers, A. A. Bergen, A. A. van Oosterhout, B. A. Oostra, F. Rivadeneira, A. G. Uitterlinden, A. Hofman, P. T. de Jong, C. J. Hammond, J. R. Vingerling, and C. C. Klaver, “A genome-wide association study identifies a susceptibility locus for refractive errors and myopia at 15q14,” Nat. Genet., vol. 42, pp. 897–901, Oct 2010.
- [22] P. G. Hysi, T. L. Young, D. A. Mackey, T. Andrew, A. Fernandez-Medarde, A. M. Solouki, A. W. Hewitt, S. Macgregor, J. R. Vingerling, Y. J. Li, M. K. Ikram, L. Y. Fai, P. C. Sham, L. Manyes, A. Porteros, M. C. Lopes, F. Carbonaro, S. J. Fahy, N. G. Martin, C. M. van Duijn, T. D. Spector, J. S. Rahi, E. Santos, C. C. Klaver, and C. J. Hammond, “A genome-wide association study for myopia and refractive error identifies a susceptibility locus at 15q25,” Nat. Genet., vol. 42, pp. 902–905, Oct 2010.
- [23] Y. J. Li, L. Goh, C. C. Khor, Q. Fan, M. Yu, S. Han, X. Sim, R. T. Ong, T. Y. Wong, E. N. Vithana, E. Yap, H. Nakanishi, F. Matsuda, K. Ohno-Matsui, N. Yoshimura, M. Seielstad, E. S. Tai, T. L. Young, and S. M. Saw, “Genome-wide association studies reveal genetic variants in CTNND2 for high myopia in Singapore Chinese,” Ophthalmology, vol. 118, pp. 368–375, Feb 2011.
- [24] H. Nakanishi, R. Yamada, N. Gotoh, H. Hayashi, K. Yamashiro, N. Shimada, K. Ohno-Matsui, M. Mochizuki, M. Saito, T. Iida, K. Matsuo, K. Tajima, N. Yoshimura, and F. Matsuda, “A genome-wide association analysis identified a novel susceptible locus for pathological myopia at 11q24.1,” PLoS Genet., vol. 5, p. e1000660, Sep 2009.
- [25] Z. Li, J. Qu, X. Xu, X. Zhou, H. Zou, N. Wang, T. Li, X. Hu, Q. Zhao, P. Chen, W. Li, K. Huang, J. Yang, Z. He, J. Ji, T. Wang, J. Li, Y. Li, J. Liu, Z. Zeng, G. Feng, L. He, and Y. Shi, “A genome-wide association study reveals association between common variants in an intergenic region of 4q25 and high-grade myopia in the Chinese Han population,” Hum. Mol. Genet., vol. 20, pp. 2861–2868, Jul 2011.
- [26] Y. Shi, J. Qu, D. Zhang, P. Zhao, Q. Zhang, P. O. Tam, L. Sun, X. Zuo, X. Zhou, X. Xiao, J. Hu, Y. Li, L. Cai, X. Liu, F. Lu, S. Liao, B. Chen, F. He, B. Gong, H. Lin, S. Ma, J. Cheng, J. Zhang, Y. Chen, F. Zhao, X. Yang, Y. Chen, C. Yang, D. S. Lam, X. Li, F. Shi, Z. Wu, Y. Lin, J. Yang, S. Li, Y. Ren, A. Xue, Y. Fan, D. Li, C. P. Pang, X. Zhang, and Z. Yang, “Genetic variants at 13q12.12 are associated with high myopia in the Han Chinese population,” Am. J. Hum. Genet., vol. 88, pp. 805–813, Jun 2011.
- [27] Q. Fan, V. A. Barathi, C. Y. Cheng, X. Zhou, A. Meguro, I. Nakata, C. C. Khor, L. K. Goh, Y. J. Li, W. Lim, C. E. Ho, F. Hawthorne, Y. Zheng, D. Chua, H. Inoko, K. Yamashiro, K. Ohno-Matsui, K. Matsuo, F. Matsuda, E. Vithana, M. Seielstad, N. Mizuki, R. W. Beuerman, E. S. Tai, N. Yoshimura, T. Aung, T. L. Young, T. Y. Wong, Y. Y. Teo, and S. M. Saw, “Genetic variants on chromosome 1q41 influence ocular axial length and high myopia,” PLoS Genet., vol. 8, p. e1002753, Jun 2012.
- [28] T. L. Young, R. Metlapally, and A. E. Shay, “Complex trait genetics of refractive error,” Arch. Ophthalmol., vol. 125, pp. 38–48, Jan 2007.
- [29] Y. Shi, Y. Li, D. Zhang, H. Zhang, Y. Li, F. Lu, X. Liu, F. He, B. Gong, L. Cai, R. Li, S. Liao, S. Ma, H. Lin, J. Cheng, H. Zheng, Y. Shan, B. Chen, J. Hu, X. Jin, P. Zhao, Y. Chen, Y. Zhang, Y. Lin, X. Li, Y. Fan, H. Yang, J. Wang, and Z. Yang, “Exome sequencing identifies ZNF644 mutations in high myopia,” PLoS Genet., vol. 7, p. e1002084, Jun 2011.
- [30] V. J. Verhoeven, P. G. Hysi, S. M. Saw, V. Vitart, A. Mirshahi, J. A. Guggenheim, M. F. Cotch, K. Yamashiro, P. N. Baird, D. A. Mackey, R. Wojciechowski, M. K. Ikram, A. W. Hewitt, P. Duggal, S. Janmahasatian, C. C. Khor, Q. Fan, X. Zhou, T. L. Young, E. S. Tai, L. K. Goh, Y. J. Li, T. Aung, E. Vithana, Y. Y. Teo, W. Tay, X. Sim, I. Rudan, C. Hayward, A. F. Wright, O. Polasek, H. Campbell, J. F. Wilson, B. W. Fleck, I. Nakata, N. Yoshimura, R. Yamada, F. Matsuda, K. Ohno-Matsui, A. Nag, G. McMahon, B. S. Pourcain, Y. Lu, J. S. Rahi, P. M. Cumberland, S. Bhattacharya, C. L. Simpson, L. D. Atwood, X. Li, L. J. Raffel, F. Murgia, L. Portas, D. D. Despriet, L. M. van Koolwijk, C. Wolfram, K. J. Lackner, A. Tonjes, R. Magi, T. Lehtimaki, M. Kahonen, T. Esko, A. Metspalu, T. Rantanen, O. Parssinen, B. E. Klein, T. Meitinger, T. D. Spector, B. A. Oostra, A. V. Smith, P. T. de Jong, A. Hofman, N. Amin, L. C. Karssen, F. Rivadeneira, J. R. Vingerling, G. Eiriksdottir, V. Gudnason, A. Doring, T. Bettecken, A. G. Uitterlinden, C. Williams, T. Zeller, R. Castagne, K. Oexle, C. M. van Duijn, S. K. Iyengar, P. Mitchell, J. J. Wang, R. Hohn, N. Pfeiffer, J. E. Bailey-Wilson, D. Stambolian, T. Y. Wong, C. J. Hammond, and C. C. Klaver, “Large scale international replication and meta-analysis study confirms association of the 15q14 locus with myopia. The CREAM consortium,” Hum Genet, Jun 2012.
- [31] B. Bystrom, I. Virtanen, P. Rousselle, D. Gullberg, and F. Pedrosa-Domellof, “Distribution of laminins in the developing human eye,” Invest. Ophthalmol. Vis. Sci., vol. 47, pp. 777–785, Mar 2006.
- [32] P. E. Peterson, C. S. Pow, D. B. Wilson, and A. G. Hendrickx, “Localisation of glycoproteins and glycosaminoglycans during early eye development in the macaque,” J. Anat., vol. 186 ( Pt 1), pp. 31–42, Feb 1995.
- [33] N. Morissette and S. Carbonetto, “Laminin alpha 2 chain (M chain) is found within the pathway of avian and murine retinal projections,” J. Neurosci., vol. 15, pp. 8067–8082, Dec 1995.
- [34] S. E. Bell, A. Mavila, R. Salazar, K. J. Bayless, S. Kanagala, S. A. Maxwell, and G. E. Davis, “Differential gene expression during capillary morphogenesis in 3D collagen matrices: regulated expression of genes involved in basement membrane matrix assembly, cell cycle progression, cellular differentiation and G-protein signaling,” J. Cell. Sci., vol. 114, pp. 2755–2773, Aug 2001.
- [35] J. B. Veyrieras, S. Kudaravalli, S. Y. Kim, E. T. Dermitzakis, Y. Gilad, M. Stephens, and J. K. Pritchard, “High-resolution mapping of expression-QTLs yields insight into human gene regulation,” PLoS Genet., vol. 4, p. e1000214, Oct 2008.
- [36] B. E. Stranger, A. C. Nica, M. S. Forrest, A. Dimas, C. P. Bird, C. Beazley, C. E. Ingle, M. Dunning, P. Flicek, D. Koller, S. Montgomery, S. Tavare, P. Deloukas, and E. T. Dermitzakis, “Population genomics of human gene expression,” Nat. Genet., vol. 39, pp. 1217–1224, Oct 2007.
- [37] G. Badis, M. F. Berger, A. A. Philippakis, S. Talukder, A. R. Gehrke, S. A. Jaeger, E. T. Chan, G. Metzler, A. Vedenko, X. Chen, H. Kuznetsov, C. F. Wang, D. Coburn, D. E. Newburger, Q. Morris, T. R. Hughes, and M. L. Bulyk, “Diversity and complexity in DNA recognition by transcription factors,” Science, vol. 324, pp. 1720–1723, Jun 2009.
- [38] A. Boyle, E. Hong, M. Hariharan, Y. Cheng, M. Shaub, M. Kasowski, J. Konrad, K. Karczewski1, J. Park, B. Hitz, S. Weng, J. Cherry, and M. Snyder, “Annotation of functional variation in personal genomes using RegulomeDB,” Genome Res., vol. 22, pp. 1790–1797, 2012.
- [39] O. Strauss, “The retinal pigment epithelium in visual function,” Physiol. Rev., vol. 85, pp. 845–881, Jul 2005.
- [40] N. K. Wang, L. H. Chuang, C. C. Lai, C. L. Chou, H. Y. Chu, L. Yeung, Y. P. Chen, K. J. Chen, W. C. Wu, T. L. Chen, A. N. Chao, and Y. S. Hwang, “Multimodal fundus imaging in fundus albipunctatus with RDH5 mutation: a newly identified compound heterozygous mutation and review of the literature,” Doc Ophthalmol, vol. 125, pp. 51–62, Aug 2012.
- [41] M. Nakamura, Y. Hotta, A. Tanikawa, H. Terasaki, and Y. Miyake, “A high association with cone dystrophy in Fundus albipunctatus caused by mutations of the RDH5 gene,” Invest. Ophthalmol. Vis. Sci., vol. 41, pp. 3925–3932, Nov 2000.
- [42] Q. Wang, Q. Chen, K. Zhao, L. Wang, L. Wang, and E. I. Traboulsi, “Update on the molecular genetics of retinitis pigmentosa,” Ophthalmic Genet., vol. 22, pp. 133–154, Sep 2001.
- [43] S. Bernal, M. Calaf, M. Garcia-Hoyos, B. Garcia-Sandoval, J. Rosell, A. Adan, C. Ayuso, and M. Baiget, “Study of the involvement of the RGR, CRPB1, and CRB1 genes in the pathogenesis of autosomal recessive retinitis pigmentosa,” J. Med. Genet., vol. 40, p. e89, Jul 2003.
- [44] B. R. Pattnaik and B. A. Hughes, “Effects of KCNQ channel modulators on the M-type potassium current in primate retinal pigment epithelium,” Am. J. Physiol., Cell Physiol., vol. 302, pp. C821–833, Mar 2012.
- [45] X. Zhang, D. Yang, and B. A. Hughes, “KCNQ5/K(v)7.5 potassium channel expression and subcellular localization in primate retinal pigment epithelium and neural retina,” Am. J. Physiol., Cell Physiol., vol. 301, pp. C1017–1026, Nov 2011.
- [46] K. S. Nair, M. Hmani-Aifa, Z. Ali, A. L. Kearney, S. Ben Salem, D. G. Macalinao, I. M. Cosma, W. Bouassida, B. Hakim, Z. Benzina, I. Soto, P. Soderkvist, G. R. Howell, R. S. Smith, H. Ayadi, and S. W. John, “Alteration of the serine protease PRSS56 causes angle-closure glaucoma in mice and posterior microphthalmia in humans and mice,” Nat. Genet., vol. 43, pp. 579–584, Jun 2011.
- [47] A. Orr, M. P. Dube, J. C. Zenteno, H. Jiang, G. Asselin, S. C. Evans, A. Caqueret, H. Lakosha, L. Letourneau, J. Marcadier, M. Matsuoka, C. Macgillivray, M. Nightingale, S. Papillon-Cavanagh, S. Perry, S. Provost, M. Ludman, D. L. Guernsey, and M. E. Samuels, “Mutations in a novel serine protease PRSS56 in families with nanophthalmos,” Mol. Vis., vol. 17, pp. 1850–1861, 2011.
- [48] A. Gal, I. Rau, L. El Matri, H. J. Kreienkamp, S. Fehr, K. Baklouti, I. Chouchane, Y. Li, M. Rehbein, J. Fuchs, H. C. Fledelius, K. Vilhelmsen, D. F. Schorderet, F. L. Munier, E. Ostergaard, D. A. Thompson, and T. Rosenberg, “Autosomal-recessive posterior microphthalmos is caused by mutations in PRSS56, a gene encoding a trypsin-like serine protease,” Am. J. Hum. Genet., vol. 88, pp. 382–390, Mar 2011.
- [49] H. Lango Allen, K. Estrada, G. Lettre, S. I. Berndt, M. N. Weedon, F. Rivadeneira, C. J. Willer, A. U. Jackson, S. Vedantam, S. Raychaudhuri, T. Ferreira, A. R. Wood, R. J. Weyant, A. V. Segre, E. K. Speliotes, E. Wheeler, N. Soranzo, J. H. Park, J. Yang, D. Gudbjartsson, N. L. Heard-Costa, J. C. Randall, L. Qi, A. Vernon Smith, R. Magi, T. Pastinen, L. Liang, I. M. Heid, J. Luan, G. Thorleifsson, T. W. Winkler, M. E. Goddard, K. Sin Lo, C. Palmer, T. Workalemahu, Y. S. Aulchenko, A. Johansson, M. C. Zillikens, M. F. Feitosa, T. Esko, T. Johnson, S. Ketkar, P. Kraft, M. Mangino, I. Prokopenko, D. Absher, E. Albrecht, F. Ernst, N. L. Glazer, and et al., “Hundreds of variants clustered in genomic loci and biological pathways affect human height,” Nature, vol. 467, pp. 832–838, Oct 2010.
- [50] D. F. Gudbjartsson, G. B. Walters, G. Thorleifsson, H. Stefansson, B. V. Halldorsson, P. Zusmanovich, P. Sulem, S. Thorlacius, A. Gylfason, S. Steinberg, A. Helgadottir, A. Ingason, V. Steinthorsdottir, E. J. Olafsdottir, G. H. Olafsdottir, T. Jonsson, K. Borch-Johnsen, T. Hansen, G. Andersen, T. Jorgensen, O. Pedersen, K. K. Aben, J. A. Witjes, D. W. Swinkels, M. den Heijer, B. Franke, A. L. Verbeek, D. M. Becker, L. R. Yanek, L. C. Becker, L. Tryggvadottir, T. Rafnar, J. Gulcher, L. A. Kiemeney, A. Kong, U. Thorsteinsdottir, and K. Stefansson, “Many sequence variants affecting diversity of adult human height,” Nat. Genet., vol. 40, pp. 609–615, May 2008.
- [51] C. Garcia-Frigola, M. I. Carreres, C. Vegar, C. Mason, and E. Herrera, “Zic2 promotes axonal divergence at the optic chiasm midline by EphB1-dependent and -independent mechanisms,” Development, vol. 135, pp. 1833–1841, May 2008.
- [52] E. Herrera, L. Brown, J. Aruga, R. A. Rachel, G. Dolen, K. Mikoshiba, S. Brown, and C. A. Mason, “Zic2 patterns binocular vision by specifying the uncrossed retinal projection,” Cell, vol. 114, pp. 545–557, Sep 2003.
- [53] C. Garcia-Frigola and E. Herrera, “Zic2 regulates the expression of Sert to modulate eye-specific refinement at the visual targets,” EMBO J., vol. 29, pp. 3170–3183, Sep 2010.
- [54] P. Esteve, A. Sandonis, C. Ibanez, A. Shimono, I. Guerrero, and P. Bovolenta, “Secreted frizzled-related proteins are required for Wnt/β-catenin signalling activation in the vertebrate optic cup,” Development, vol. 138, pp. 4179–4184, Oct 2011.
- [55] P. Esteve, A. Sandonis, M. Cardozo, J. Malapeira, C. Ibanez, I. Crespo, S. Marcos, S. Gonzalez-Garcia, M. L. Toribio, J. Arribas, A. Shimono, I. Guerrero, and P. Bovolenta, “SFRPs act as negative modulators of ADAM10 to regulate retinal neurogenesis,” Nat. Neurosci., vol. 14, pp. 562–569, May 2011.
- [56] M. Garcia-Hoyos, D. Cantalapiedra, C. Arroyo, P. Esteve, J. Rodriguez, R. Riveiro, M. J. Trujillo, C. Ramos, P. Bovolenta, and C. Ayuso, “Evaluation of SFRP1 as a candidate for human retinal dystrophies,” Mol. Vis., vol. 10, pp. 426–431, Jun 2004.
- [57] P. Esteve, F. Trousse, J. Rodriguez, and P. Bovolenta, “SFRP1 modulates retina cell differentiation through a beta-catenin-independent mechanism,” J. Cell. Sci., vol. 116, pp. 2471–2481, Jun 2003.
- [58] J. Rodriguez, P. Esteve, C. Weinl, J. M. Ruiz, Y. Fermin, F. Trousse, A. Dwivedy, C. Holt, and P. Bovolenta, “SFRP1 regulates the growth of retinal ganglion cell axons through the Fz2 receptor,” Nat. Neurosci., vol. 8, pp. 1301–1309, Oct 2005.
- [59] B. L. Fogel, E. Wexler, A. Wahnich, T. Friedrich, C. Vijayendran, F. Gao, N. Parikshak, G. Konopka, and D. H. Geschwind, “RBFOX1 regulates both splicing and transcriptional networks in human neuronal development,” Hum Mol Genet, Jul 2012.
- [60] J. C. Lin, W. H. Ho, A. Gurney, and A. Rosenthal, “The netrin-G1 ligand NGL-1 promotes the outgrowth of thalamocortical axons,” Nat. Neurosci., vol. 6, pp. 1270–1276, Dec 2003.
- [61] C. Oliva, P. Escobedo, C. Astorga, C. Molina, and J. Sierralta, “Role of the MAGUK protein family in synapse formation and function,” Dev Neurobiol, vol. 72, pp. 57–72, Jan 2012.
- [62] T. Walsh, S. B. Pierce, D. R. Lenz, Z. Brownstein, O. Dagan-Rosenfeld, H. Shahin, W. Roeb, S. McCarthy, A. S. Nord, C. R. Gordon, Z. Ben-Neriah, J. Sebat, M. Kanaan, M. K. Lee, M. Frydman, M. C. King, and K. B. Avraham, “Genomic duplication and overexpression of TJP2/ZO-2 leads to altered expression of apoptosis genes in progressive nonsyndromic hearing loss DFNA51,” Am. J. Hum. Genet., vol. 87, pp. 101–109, Jul 2010.
- [63] N. Eriksson, J. M. Macpherson, J. Y. Tung, L. S. Hon, B. Naughton, S. Saxonov, L. Avey, A. Wojcicki, I. Pe’er, and J. Mountain, “Web-based, participant-driven studies yield novel genetic associations for common traits,” PLoS Genet., vol. 6, p. e1000993, 2010.
- [64] J. Y. Tung, C. B. Do, D. A. Hinds, A. K. Kiefer, J. M. Macpherson, A. B. Chowdry, U. Francke, B. T. Naughton, J. L. Mountain, A. Wojcicki, and N. Eriksson, “Efficient Replication of over 180 Genetic Associations with Self-Reported Medical Data,” PLoS ONE, vol. 6, p. e23473, 2011.
- [65] N. Eriksson, G. M. Benton, C. B. Do, A. K. Kiefer, J. L. Mountain, D. A. Hinds, U. Francke, and J. Y. Tung, “Genetic variants associated with breast size also influence breast cancer risk,” BMC Med Genet, vol. 13, p. 53, Jun 2012.
- [66] N. Eriksson, J. Y. Tung, A. K. Kiefer, D. A. Hinds, U. Francke, J. L. Mountain, and C. B. Do, “Novel associations for hypothyroidism include known autoimmune risk loci,” PLoS ONE, vol. 7, no. 4, p. e34442, 2012.
- [67] B. Henn, L. Hon, J. M. Macpherson, N. Eriksson, S. Saxonov, I. Pe’er, and J. L. Mountain, “Cryptic distant relatives are common in both isolated and cosmopolitan genetic samples,” PLoS ONE, vol. 7, no. 4, p. e34267, 2012.
- [68] T. Therneau, A Package for Survival Analysis in S, 2012. R package version 2.36-14.
- [69] M. Schemper and J. Stare, “Explained variation in survival analysis,” Stat Med, vol. 15, pp. 1999–2012, Oct 1996.
Supporting Information


| SNP | (survival) | (case-control) |
|---|---|---|
| rs12193446 | ||
| rs11602008 | ||
| rs17648524 | ||
| rs3138142 | ||
| chr8:60178580 | ||
| rs7744813 | ||
| rs524952 | ||
| rs2137277 | ||
| rs1550094 | ||
| rs11681122 | ||
| rs7624084 | ||
| rs1898585 | ||
| rs2908972 | ||
| rs6480859 | ||
| rs10736767 | ||
| rs11145746 | ||
| rs4291789 | ||
| rs4778882 | ||
| rs745480 | ||
| rs5022942 | ||
| rs9365619 | ||
| rs1031004 | ||
| rs17428076 | ||
| chr14:54413001 | ||
| rs7272323 | ||
| chr11:65348347 | ||
| rs55819392 |
-values for SNPs in the survival analysis used in the paper as well as in a case-control logistic regression on the same set of individuals. The survival analysis gives a smaller -value for all but 1 SNP (rs3138142) and has 19 genome-wide significant () as compared to 13 for the case-control. -values in both cases are adjusted for the genomic control inflation factor of 1.14.
| SNP | -value |
|---|---|
| rs12193446 | |
| rs11602008 | 0.64 |
| rs17648524 | 0.0011 |
| rs3138142 | 0.97 |
| chr8:60178580 | |
| rs7744813 | 0.063 |
| rs524952 | |
| rs2137277 | 0.016 |
| rs1550094 | 0.0026 |
| rs11681122 | 0.59 |
| rs7624084 | 0.32 |
| rs1898585 | 0.0059 |
| rs2908972 | 0.013 |
| rs6480859 | 0.10 |
| rs10736767 | 0.093 |
| rs11145746 | 0.0038 |
| rs4291789 | 0.37 |
| rs4778882 | 0.34 |
| rs745480 | 0.035 |
-values for significant SNPs for deviation from the proportional hazards assumption in the Cox model. For each SNP, we fit a Cox proportional hazards model including the SNP, sex, and five principal components as predictors, and then tested for independence of the scaled Schoenfeld residuals with time. Bold SNPs deviate significantly from this assumption after correction for 19 tests. Plots for four example SNPs are shown in Figure S3.