A method for localizing energy dissipation in blazars using Fermi variability
Abstract
The distance of the Fermi-detected blazar -ray emission site from the supermassive black hole is a matter of active debate. Here we present a method for testing if the GeV emission of powerful blazars is produced within the sub-pc scale broad line region (BLR) or farther out in the pc-scale molecular torus (MT) environment. If the GeV emission takes place within the BLR, the inverse Compton (IC) scattering of the BLR ultraviolet (UV) seed photons that produces the -rays takes place at the onset of the Klein-Nishina regime. This causes the electron cooling time to become practically energy independent and the variation of the -ray emission to be almost achromatic. If on the other hand the -ray emission is produced farther out in the pc-scale MT, the IC scattering of the infrared (IR) MT seed photons that produces the -rays takes place in the Thomson regime, resulting to energy-dependent electron cooling times, manifested as faster cooling times for higher Fermi energies. We demonstrate these characteristics and discuss the applicability and limitations of our method.
Subject headings:
galaxies: active — quasars: general — radiation mechanisms: non-thermal — gamma rays: galaxies1. Introduction
Blazars dominate the extragalactic -ray sky (Abdo et al., 2011a), exhibiting flares in which the Fermi -ray flux is seen to increase up to several times the pre-flare level (e.g. Abdo et al., 2010b). Because the emitting regions are unresolved, the location of the GeV emission remains unknown and this constitutes an open issue in understanding energy dissipation in blazars.
In the leptonic model, the GeV emission of blazars is produced by IC scattering of photons off of the same relativistic electrons in the jet that give rise to synchrotron radiation (for a review see Böttcher, 2007). The seed photons for IC scattering are synchrotron photons originating within the relativistic jet (synchrotron - self Compton, SSC scattering) (e.g. Maraschi et al., 1992) or photons originating external to the jet (external Compton, EC scattering), such as UV accretion disk photons (Dermer et al., 1992), UV photons originating from the BLR (Sikora et al., 1994), and IR photons originating from molecular torus (MT) (e.g. Błażejowski et al., 2000).
Because the -ray emission of blazars can vary significantly on short times, down to the instrument limits, ranging from a few minutes (in the TeV range) (Aharonian et al., 2009) to a few hours (in the GeV range) (Foschini et al., 2011), light-time travel arguments constrain the size of the emitting region and it has been argued (e.g. Tavecchio et al., 2010) that this requires the emission to take place at the sub-pc scale. Explaining the Fermi GeV spectral breaks seen in powerful blazars (Abdo et al., 2010c) as a result of pair absorption on the He Lyman recombination continuum and lines, produced in the inner part of the BLR, places the GeV emission well within the BLR (Poutanen & Stern, 2010). Very short distances cm), however, where accretion disk photons dominate are not favored, because of the high pair production -ray opacity (e.g. Ghisellini & Tavecchio, 2009).
Gamma-ray flares have been associated with radio and optical flares, placing the GeV emission outside the BLR: Lähteenmäki & Valtaoja (2003), using the temporal separation of the radio and -ray fluxes, argued that the -ray emission site is at a distance of pc from the central engine. Connections have been also drawn between -ray outbursts, optical flare polarization changes, and ejections of superluminal radio knots on the pc scale: Marscher et al. (2010) associated short -ray variations with the passage of disturbances from the radio core, parsecs away from the black hole. In the case of OJ 287, Agudo et al. (2011) found -ray flaring to be simultaneous with mm outbursts associated with a VLBA jet component 14 pc downstream from the radio core.
Here we propose a method to distinguish if the GeV emission of powerful blazars takes place within the sub-pc BLR or further out within the pc-scale MT. In §2 we discuss our understanding of the BLR, MT, and SSC photon fields and where each one dominates. We show that cooling on the UV BLR photons results in achromatic cooling times in the Fermi band, while cooling on the MT IR photons results to faster cooling times at higher -ray energies. In §3 we present our method, discussing the dilution of an energy-dependent cooling time from light travel time effects and discuss the applicability of our method. Finally, in §4 we present our conclusions.
2. Cooling of GeV emitting electrons
2.1. Characterizing the BLR and the MT
Reverberation mapping of the BLR points to a typical size of cm (e.g. Kaspi et al., 2007; Bentz et al., 2009), where is the accretion disk luminosity in units of erg s-1. Because of this scaling, and assuming that , where is the BLR covering factor, the energy density inside the BLR () is not expected to vary widely from object to object (Ghisellini & Tavecchio, 2009). As was shown by Tavecchio (2008), when transformed to the jet frame, the BLR spectrum, dominated by Ly photons, is broadened and boosted in luminosity due to relativistic effects and can be well-approximated by a blackbody spectrum that peaks at (, where is the bulk Lorentz factor and is the photon energy in mc2 units.
In the MT the dust temperature ranges from K (Landt et al., 2010) ( to K (Cleary et al., 2007; Malmrose et al., 2011), with hotter emitting material expected to be closer to the central engine (e.g. Nenkova et al., 2008). Because of the larger size of the MT, it has been probed by reverberation mapping only for Seyfert galaxies (e.g. Suganuma et al., 2006) which have lower luminosities and therefore smaller MT sizes. These studies, along with near-IR interferometric studies (e.g. Kishimoto et al., 2011) also support an scaling, suggesting that is similar for sources of different luminosities. Adopting the scaling of Ghisellini & Tavecchio (2009), cm and assuming a covering factor , the MT photon energy density is erg cm-3. We also adopt a temperature , corresponding to a blackbody peak at Hz ().
2.2. Which seed photons dominate where?
For an isotropic photon field, the co-moving (jet frame) energy density is , while for photons entering the emitting region from behind, (Dermer & Schlickeiser, 1994). If the emission site is located at , the BLR photon field can be considered isotropic in the galaxy frame and, using the BLR energy density discussed in §2.1, . Similarly, the MT photon field is isotropic inside the BLR and its co-moving seed photon energy density is erg cm-3. Clearly, at scales, dominates over by a factor of . If the emission site is located at , then the BLR photons enter the emitting region practically from behind, so that erg cm-3. The MT photons retain the same co-moving energy density as before and, in this case, the MT dominates the co-moving photon energy density.
These external photon field co-moving energy densities need to be compared to the synchrotron one. If is the size of the emitting region, then the co-moving synchrotron photon energy density is , where is the usual Doppler factor and the synchrotron luminosity. An upper limit to is set by the variability timescale : , where is the source redshift. We then obtain a lower limit or , where is the variability time in days. Setting the condition requires
| (1) |
This translates to for the emission site at scales and for the emission site at scales. In general, powerful quasars exhibit superluminal motions requiring (Jorstad et al., 2005; Kharb et al., 2010) and therefore, the dominant source of seed photons for these sources should be the BLR or the MT, provided the -ray emission site is at a distance not significantly larger than the size of the MT. A recent finding by Meyer et al. (2012) that the ratio of -ray to synchrotron luminosity increases with increasing radio core, as expected for EC emission (Dermer, 1995; Georganopoulos et al., 2001), supports further the possibility that powerful blazars are EC emitters.
2.3. Cooling in the BLR vs Cooling in the MT
The critical difference between the BLR and the MT is the energy of the seed photons: the BLR produces UV photons while the MT produces IR photons. This difference by a factor of in typical photon energy is critical in that it affects the energy regime in which the GeV-emitting electron IC-cooling takes place, and thus the energy dependence of the electron cooling time.
For this consideration to be relevant, IC cooling must dominate over synchrotron cooling. This condition is satisfied, since in powerful blazars the IC luminosity clearly dominates over the synchrotron luminosity, reaching in high states an IC luminosity higher that the synchrotron one by a factor of up to (e.g. Abdo et al., 2010a; Meyer et al., 2012).
For electrons cooling in the Thomson regime (, where both the electron Lorentz factor and the seed photon energy are measured in the same frame) the cooling rate . For electrons with cooling takes place in the Klein-Nishina (KN) regime with (Blumenthal & Gould, 1970). For the broad intermediate regime, , a parametric approximation has been suggested (Moderski et al., 2005). In what follows we calculate numerically the electron energy loss rate , which for monoenergetic seed photons of number density and dimensionless energy is
The effects of the transition between Thomson and KN regimes on the electron energy distribution (EED) and the resultant spectrum of the synchrotron and IC emission have been studied before (e.g. Blumenthal, 1971; Zdziarski, 1989; Dermer & Atoyan, 2002; Sokolov et al., 2004; Moderski et al., 2005; Kusunose & Takahara, 2005; Georganopoulos et al., 2006; Manolakou et al., 2007; Sikora et al., 2009).
In short, the transition from Thomson to KN cooling in the EED can be seen for the steady state : for a power law injection , the cooled EED hardens from in the Thomson regime to in the KN regime. The transition takes place gradually at . A second transition back to is expected at higher , as synchrotron losses (assumed to be less significant than Thomson EC losses) become larger than KN losses. The imprint of these considerations on the observed synchrotron and IC spectra has been considered for the case of the X-ray emission of large scale jets (Dermer & Atoyan, 2002) and in the case of blazars (Kusunose & Takahara, 2005; Georganopoulos et al., 2006; Sikora et al., 2009).
Spectral signatures, however, are not unique and can be diluted or altered by extraneous causes (e.g. the accelerated electron distribution has intrinsic features that deviate from a power law, the synchrotron emission is contaminated by the big blue bump, the IC emission is modified by pair production absorption from synchrotron or external photons). For these reasons their use in understanding where the GeV emission takes place is problematic.
3. Locating the GeV emission site
There is however another observable aspect of the Thomson - KN transition that is free of the issues faced by relying on spectral signatures: the energy dependence of the electron cooling time can be used to evaluate the regime at which the electrons that produce the GeV radiation cool, and through this evaluate where the emission takes place.
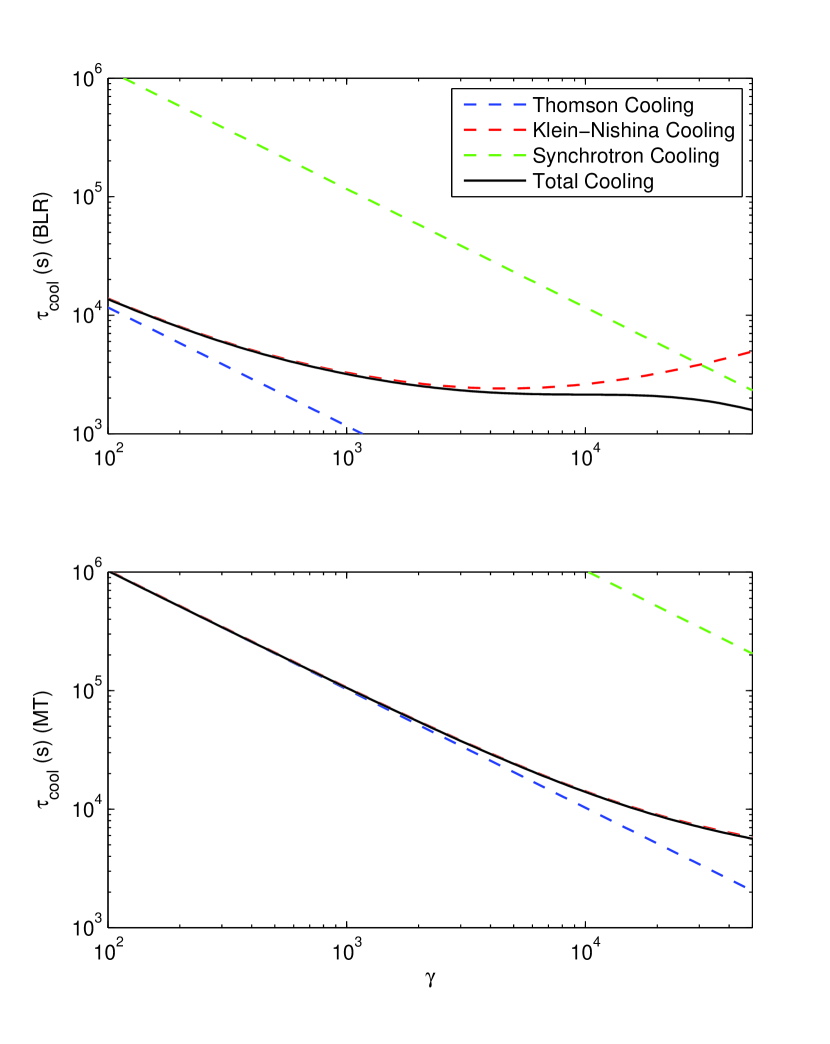
In the Thomson regime, the electron cooling time scales as , while in the KN regime the electron cooling time scales as as . These two regimes connect smoothly forming a wide valley around in which the cooling time is practically energy-independent. The energy of the seed photons originating in the BLR is greater than that of photons from the MT by a factor of . As a result, (see Fig. 1) the location of the energy-independent valley of the BLR case is manifested at electron energies lower by a factor of than that of the MT case. In turn, the energy dependence of causes a related energy dependence in the observed falling time of the flare. The falling time of Fermi light curves can be used, therefore, to determine whether a flare occurs within the BLR or within the MT.
3.1. Flare decay in the BLR vs flare decay in the MT
We utilize an one-zone code to demonstrate the effect of a flare occurring within the BLR versus a flare occurring within the MT. The code assumes the injection of a power law electron distribution and follows its evolution taking into account the KN cross section, SSC losses, and assuming a black body external photon field. The implicit numerical scheme is similar to that used by Chiaberge & Ghisellini (1999) and Graff et al. (2008). After the code reaches a steady-state, an increase in the injection rate is introduced that lasts for a short time before it returns to its initial value. The code was initialized to simulate the flare occurring within the BLR and the MT respective, described by the values discussed in §2. We assumed a Compton dominance , source size , bulk Lorentz factor . Deep in the Thomson regime (MT case) the Compton dominance corresponds to , where is the external energy density and is the magnetic energy density. However, as cooling transitions from the Thomson to the KN regime (BLR case), the ratio over-estimates the observed Compton dominance by a factor of
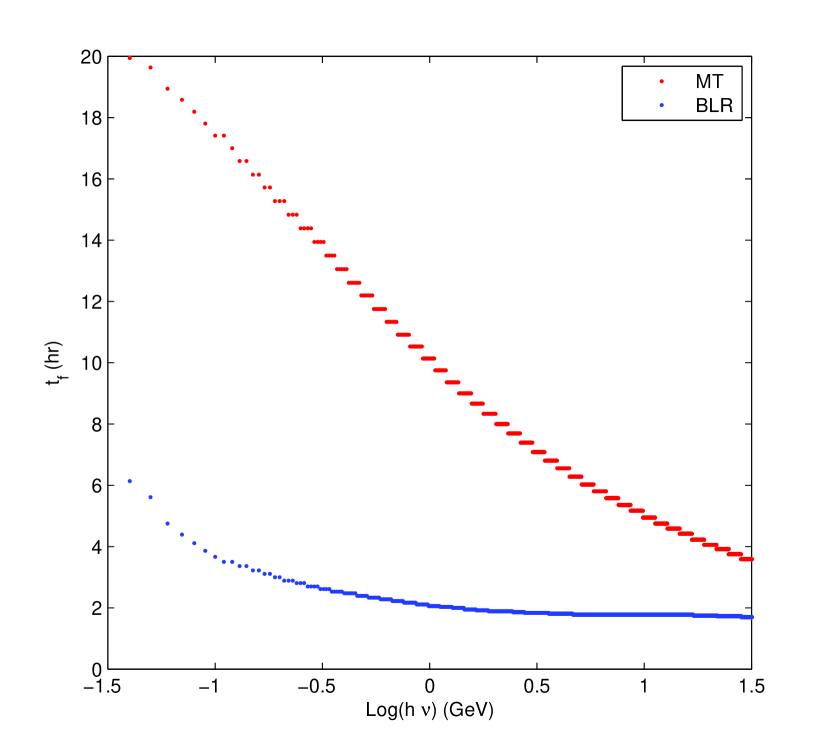
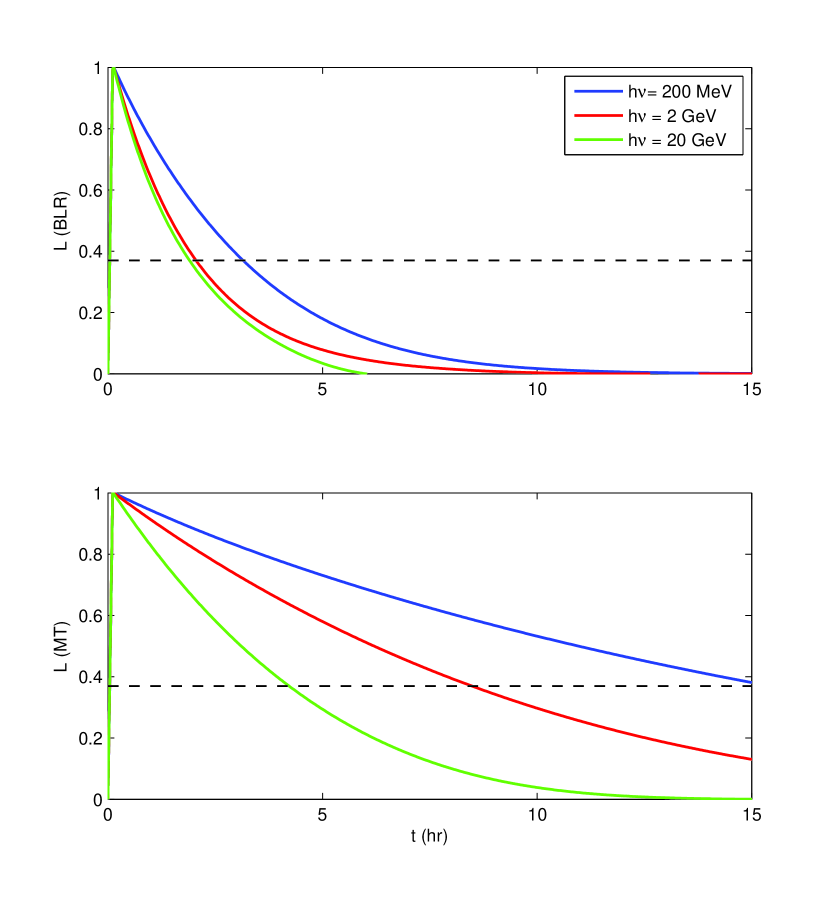
In the BLR case (Fig. 2, blue curve) IC cooling occurs at the onset on the KN regime, resulting in a near-flattening of within the Fermi band, where a change in energy by a factor of 100 (from 200 MeV to 20 GeV) results in a change in cooling time of less than an hour, with all the Fermi energies having practically indistinguishable decay times (between hours). In the MT case (Fig. 2, red curve) cooling occurs mostly in the Thomson regime and is heavily energy-dependent; the same change in energy by a factor of 100 results in a change in cooling time by hours. This is also apparent in the light curves shown in Fig 3. A flare occurring within the BLR (Fig 3, top panel) has comparable values of within the Fermi energy range. A flare occurring within the MT exhibits distinct falling times that decrease with observing energy (3, lower panel).
For sufficiently bright flares with short decay times (comparable to the cooling times of few to several hours anticipated), Fermi light curves can be generated at multiple energies, and the energy dependence (or lack thereof) of can be used to reveal the location of the GeV emitting site.
3.2. Light Travel Time Effects
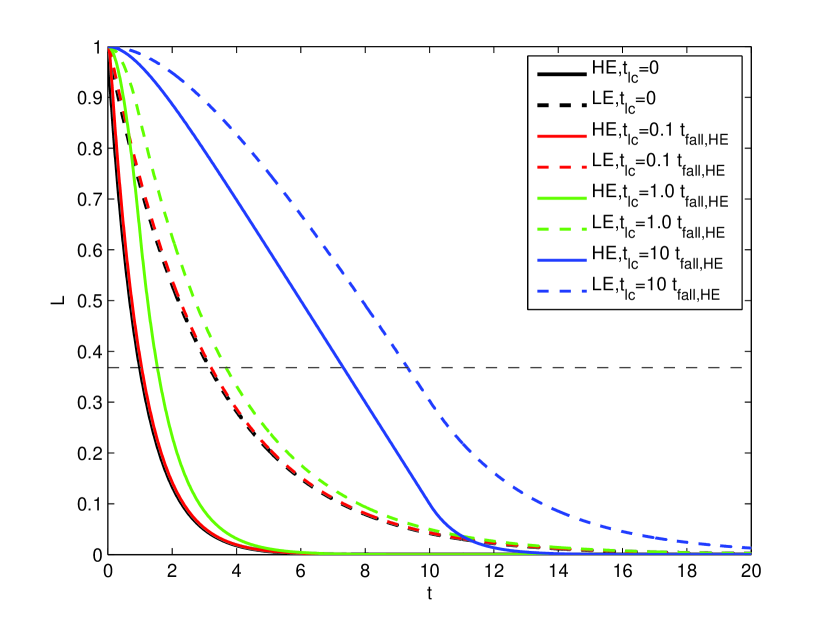
Because the GeV emitting region is not a point source, the observed decay time of the light curve is a convolution of and the blob light-crossing time . Any other variations (e.g. a gradual decrease of the electron density) will have a similar effect. For BLR achromatic cooling, we expect the light curves to remain achromatic after considering light crossing time effects. To see the effects of in the case of MT cooling, where, , we consider a source with exponentially decaying emission coefficient, , and calculate the expected light curves for two energies differing by 10 and for a range of . As can be seen in Fig 4, although increases with increasing , the difference of between and is practically preserved for all . Moreover, because for given and the ratio of is also given, observations of the decay times for and can be used to find both and for each energy.
3.3. The feasibility of the diagnostic
Very bright flares, such as the November 2010 flare of 3C 454.3 (Abdo et al., 2011b) have enough photon statistics to produce light curves in two Fermi energy bands. The practical application of our diagnostic requires that the decay times in different energy bands have statistically meaningful differences if the flare occurs within the MT. To evaluate if this is the case for a flare as bright as that of 3C 454.3, we adopted the maximum observed errors in the GeV range and GeV range (Abdo et al., 2011b) and produced simulated data assuming energy-dependent cooling in the form of exponentially decaying light curves. We fitted an exponential decay function to the simulated data for each energy band, with the characteristic decay time as a free parameter. The decay times we recovered were statistically distinguishable, suggesting that our diagnostic is applicable, at least for the brightest flares observed.
3.4. Constraints from upper limits of the decay time difference
For flares from which no statistically significant difference in the decay time can be established, constraints can still be imposed on the location of the Fermi detected emission by considering , the maximum decay time difference allowed by the data, between a high energy and a low energy . The requirement that can be casted as upper limit for the location of the Fermi emission
| (4) |
where is the MT luminosity. In terms of quantities used in §2.1 and for corresponding to 100 MeV and 1 GeV, . The Lorentz factor can be estimated from VLBI studies (e.g. Jorstad et al., 2005) and the MT luminosity can be taken to be a fraction of the accretion disk luminosity or in some cases can be directly measured (e.g. Landt et al., 2010; Malmrose et al., 2011).
4. Conclusions
We presented a diagnostic test for determining if the GeV emission in powerfull blazars originates from within or outside the BLR. Our method utilizes the fact that if electrons cool via IC scattering on BLR photons, cooling occurs at the onset of the KN regime and the resulting cooling times (and thus light curves) should be achromatic. If cooling occurs via IC scattering of less energetic MT photons, the electron cooling times, and thus light-curves, should exhibit significant energy-dependence and decrease as photon energy increases. The energy dependence of the cooling time difference perseveres in the presence of energy independent timescales such as the light crossing time. The method is applicable for the brightest Fermi -ray flares, and can provide upper limits on the flare location even when the decay times in different energies are statistically indistinguishable.
References
- Abdo et al. (2010a) Abdo, A. A., Ackermann, M., Ajello, M., et al. 2010a, ApJ, 710, 1271
- Abdo et al. (2010b) Abdo, A. A., et al. 2010b, ApJ, 716, 30
- Abdo et al. (2010c) Abdo, A. A., et al. 2010c, ApJ, 722, 520
- Abdo et al. (2011a) Abdo, A. A., et al. 2011a, arXiv: 1108.1435
- Abdo et al. (2011b) Abdo, A. A., Ackermann, M., Ajello, M., et al. 2011b, ApJ, 733, L26
- Agudo et al. (2011) Agudo, I., Jorstad, S. G., Marscher, A. P., et al. 2011, ApJ, 726, L13
- Aharonian et al. (2009) Aharonian, F., Akhperjanian, A. G., Anton, G., et al. 2009, A&A, 502, 749
- Bentz et al. (2009) Bentz, M. C., Peterson, B. M., Netzer, H., Pogge, R. W., & Vestergaard, M. 2009, ApJ, 697, 160
- Błażejowski et al. (2000) Błażejowski, M., Sikora, M., Moderski, R., & Madejski, G. M. 2000, ApJ, 545, 107
- Blumenthal & Gould (1970) Blumenthal, G. R., & Gould, R. J. 1970, Reviews of Modern Physics, 42, 237
- Blumenthal (1971) Blumenthal, G. R. 1971, Phys. Rev. D, 3, 2308
- Böttcher (2007) Böttcher, M. 2007, Ap&SS, 309, 95
- Chiaberge & Ghisellini (1999) Chiaberge, M., & Ghisellini, G. 1999, MNRAS, 306, 551
- Cleary et al. (2007) Cleary, K., Lawrence, C. R., Marshall, J. A., Hao, L., & Meier, D. 2007, ApJ, 660, 117
- Dermer (1995) Dermer, C. D. 1995, ApJ, 446, L63
- Dermer et al. (1992) Dermer, C. D., Schlickeiser, R., & Mastichiadis, A. 1992, A&A, 256, L27
- Dermer & Schlickeiser (1994) Dermer, C. D., & Schlickeiser, R. 1994, ApJS, 90, 945
- Dermer & Atoyan (2002) Dermer, C. D., & Atoyan, A. M. 2002, ApJ, 568, L81
- Foschini et al. (2011) Foschini, L., Ghisellini, G., Tavecchio, F., Bonnoli, G., & Stamerra, A. 2011, A&A, 530, A77
- Georganopoulos et al. (2001) Georganopoulos, M., Kirk, J. G., & Mastichiadis, A. 2001, ApJ, 561, 111
- Georganopoulos et al. (2006) Georganopoulos, M., Perlman, E. S., Kazanas, D., & Wingert, B. 2006, Blazar Variability Workshop II: Entering the GLAST Era, 350, 178
- Ghisellini & Tavecchio (2009) Ghisellini, G., & Tavecchio, F. 2009, MNRAS, 397, 985
- Graff et al. (2008) Graff, P. B., Georganopoulos, M., Perlman, E. S., & Kazanas, D. 2008, ApJ, 689, 68
- Jones (1968) Jones, F. C. 1968, Physical Review , 167, 1159
- Jorstad et al. (2001) Jorstad, S. G., Marscher, A. P., Mattox, J. R., et al. 2001, ApJS, 134, 181
- Jorstad et al. (2005) Jorstad, S. G., Marscher, A. P., Lister, M. L., et al. 2005, AJ, 130, 1418
- Kaspi et al. (2007) Kaspi, S., Brandt, W.N., Maoz, D., Netzer, H., Schneider, D.P., & Shemmer, O. 2007, ApJ, 659, 997
- Kharb et al. (2010) Kharb, P., Lister, M. L., & Cooper, N. J. 2010, ApJ, 710, 764
- Kishimoto et al. (2011) Kishimoto, M., Hönig, S. F., Antonucci, R., et al. 2011, A&A, 527, A121
- Kusunose & Takahara (2005) Kusunose, M., & Takahara, F. 2005, ApJ, 621, 285
- Landt et al. (2010) Landt, H., Buchanan, C. L., & Barmby, P. 2010, MNRAS, 408, 1982
- Lähteenmäki & Valtaoja (2003) Lähteenmäki, A., & Valtaoja, E. 2003, ApJ, 590, 95
- Malmrose et al. (2011) Malmrose, M. P., Marscher, A. P., Jorstad, S. G., Nikutta, R., & Elitzur, M. 2011, ApJ, 732, 116 .20
- Manolakou et al. (2007) Manolakou, K., Horns, D., & Kirk, J. G. 2007, A&A, 474, 689
- Maraschi et al. (1992) Maraschi, L., Ghisellini, G., & Celotti, A. 1992, ApJ, 397, L5
- Marscher et al. (2010) Marscher, A. P., Jorstad, S. G., Larionov, V. M., et al. 2010, ApJ, 710, L126
- Meyer et al. (2012) Meyer, E. T., Fossati, G., Georganopoulos, M., & Lister, M. L. 2012, ApJL submitted, also in arXiv:1203.4991
- Moderski et al. (2005) Moderski, R., Sikora, M., Coppi, P. S., & Aharonian, F. 2005, MNRAS, 363, 954
- Nenkova et al. (2008) Nenkova, M., Sirocky, M. M., Nikutta, R., Ivezić, Ž., & Elitzur, M. 2008, ApJ, 685, 160
- Moderski et al. (2005) Moderski, R., Sikora, M., Coppi, P. S., & Aharonian, F. 2005, MNRAS, 363, 954
- Poutanen & Stern (2010) Poutanen, J., & Stern, B. 2010, ApJ, 717, L118
- Sikora et al. (1994) Sikora, M., Begelman, M., & Rees, M. 1994, ApJ, 421, 153
- Sikora et al. (2009) Sikora, M., Stawarz, Ł., Moderski, R., Nalewajko, K., & Madejski, G. M. 2009, ApJ, 704, 38
- Sokolov et al. (2004) Sokolov, A., Marscher, A. P., & McHardy, I. M. 2004, ApJ, 613, 725
- Sokolov & Marscher (2005) Sokolov, A., & Marscher, A. P. 2005, ApJ, 629, 52
- Suganuma et al. (2006) Suganuma, M., Yoshii, Y., Kobayashi, Y., et al. 2006, ApJ, 639, 46
- Tavecchio (2008) Tavecchio, F., & Ghisellini, G. 2008, MNRAS, 386, 945
- Tavecchio et al. (2010) Tavecchio, F., Ghisellini, G., Bonnoli, G., & Ghirlanda, G. 2010, MNRAS, 405, L94
- Wehrle et al. (1998) Wehrle, A. E., Pian, E., Urry, C. M., et al. 1998, ApJ, 497, 178
- Zdziarski (1989) Zdziarski, A. A. 1989, ApJ, 342, 1108