Vortex Lattice Melting and in underdoped YBa2Cu3Oy
Abstract
Vortices in a type-II superconductor form a lattice structure that melts when the thermal displacement of the vortices is an appreciable fraction of the distance between vortices. In an anisotropic superconductor, such as YBa2Cu3Oy, the magnetic field value where this melting occurs can be much lower than the mean-field critical field . We examine this melting transition in YBa2Cu3Oy with oxygen content from 6.45 to 6.92, and we perform the first quantitative analysis of this transition in the cuprates by fitting the data to a theory of vortex-lattice melting. The quality of the fits indicates that the transition to a resistive state is indeed the vortex lattice melting transition, with the shape of the melting curves being consistent with the known change in penetration depth anisotropy from underdoped to optimally doped YBa2Cu3Oy. We establish these fits as a valid technique for finding from higher temperature data when the experimentally accessible fields are not sufficient to melt the lattice at zero temperature (near optimal doping). From the fits we extract as a function of hole doping. The unusual doping dependence of points to some form of electronic order competing with superconductivity around 0.12 hole doping.
I Introduction
Cuprate high- superconductors are of great interest not only because of their high transition temperatures, but also because strong-correlation physics gives rise to peculiar normal-state properties. Ironically, however, the strength of the superconductivity in these materials is what interferes with measurement of the normal state properties at low temperature. Applying high magnetic fields can overcome this and has led to the discovery of a small Fermi surface in underdoped YBa2Cu3Oy via quantum oscillation measurements in pulsed fields. Doiron-Leyraud et al. (2007) This discovery prompted a large experimental survey of the transport and thermodynamic properties of YBa2Cu3Oy in high fields. The questions remain as to whether the high fields are revealing the normal-state properties of YBa2Cu3Oy, or are instead exposing a qualitatively different field-induced ground state, or whether one might still be in a regime dominated by superconducting pairing and the presence of vortices.
The idea of high magnetic fields revealing the normal state in cuprate superconductors is a contentious one, in part because the phase diagram of the cuprates differs qualitatively from that of conventional type-II superconductors. Owing to the short coherence length, low superfluid phase stiffness, and strong anisotropy, fluctuations play a dominant role in the phase diagram. There is evidence for 3D-XY critical fluctuations below and above . Kamal et al. (1994); Pasler et al. (1998); Xu et al. (2009) Previous transport measurements on several cuprate compounds have shown that reaching the resistive state requires very high magnetic fields, and that the onset of resistivity as a function of field and temperature does not follow the conventional curve derived from Ginzburg-Landau theory, as it does in more conventional type-II superconductors. Liang et al. (1996); Ando et al. (1999) Instead, as is expected for a superconductor governed by strong thermal fluctuations, a vortex melting transition occurs, Fisher et al. (1991); Liang et al. (1996); Safar et al. (1992) with an extensive crossover regime to the normal state. Some Nernst effect experiments have been taken as evidence for the presence of superconducting pairing far above , even in strong magnetic fields. Wang et al. (2006) With this in mind, it is important to consider at which field scale is superconductivity completely suppressed and the normal state recovered, especially with regard to quantum oscillation experiments which are purported to probe the “normal state” Fermi surface. In this paper we present, for the first time in the cuprates, a detailed comparison of the melting transition in YBa2Cu3Oy with the theory of vortex-lattice melting.
II Theory
The thermodynamic critical field is the field at which superconductivity is destroyed in a type-I superconductor, and is directly related to the condensation energy of the superconducting ground state. In a type-II superconductor the magnetic field can penetrate the sample at a field lower than . At this field, , the magnetic field penetrates the superconductor in the form of vortices, with each vortex being supercurrent running around a normal state core and containing a quantum of magnetic flux. The cores of these vortices, whose size is of order the superconducting coherence length , are in the normal state; outside of the vortex cores, the strength of the magnetic field decays over the length scale of the penetration depth which, for strongly type-II superconductors such as the cuprates, is much larger than the coherence length. These vortices can form a two-dimensional lattice perpendicular to the applied field (a “vortex lattice”), Abrikosov (1957) and the lattice spacing shrinks in size as the magnetic field is increased. As long as the vortices remain pinned, the zero-resistance property is maintained in the material. When the vortex cores overlap at a second field scale , superconductivity is destroyed. In an isotropic, low- type-II superconductor, such as Nb3Sn, resistivity sets in at and the diamagnetic signal of superconductivity completely disappears. In terms of the mean-field Ginzburg-Landau coherence length , this field scale is
| (1) |
where is the flux-quantum in SI units ( will henceforth be ) 111All formulae in this paper have been converted to SI units. Factors of that may seem redundant, such as in Equation 3 and Equation 4, have been left un-cancelled in order to keep the conversion to SI units transparent..
The situation is more complicated in high- materials, where the vortex lattice can melt into a vortex liquid well below . The Lindemann criterion for melting requires the thermal displacement of a lattice to be some fraction (defined ) of the average lattice constant. Using the Lindemann criterion for a vortex lattice, Houghton et al. (1989) have shown that, because of the large anisotropy in the cuprates, the vortex lattice in a strongly type-II superconductor with a high can melt at field values well below for intermediate temperatures (away from 0 K and ). Blatter et al. (1994) In these materials, represents a crossover from a vortex-liquid to the normal state. In the traditional picture the melting field and are equal at zero temperature, since there are no thermal fluctuations at zero temperature to melt the vortex lattice. The presence of strong quantum fluctuations could result in a vortex liquid persisting down to zero temperature. However, in order to compare our experimental data with the theory of vortex lattice melting, we use the assumption made by Houghton et al. (1989), Blatter et al. (1994), and others that .
Using the notation of Blatter et al. (1994), the melting transition field is given implicitly by
| (2) |
The reduced field variable is , and is the reduced temperature.
The Ginzburg number , on the right hand side of Equation 2, is given by
| (3) | ||||
| (4) |
where is the anisotropy ratio , and the definition has been used ( and are the penetration depths parallel and perpendicular to the --plane at zero temperature). As emphasized by Blatter et al. (1994), this Ginzburg number should be thought of as a useful collection of parameters, and not as a number describing the width of fluctuations around as it is in more three-dimensional superconductors. The Lindemann number appearing on the right hand side of Equation 2 represents the fraction of the vortex lattice parameter, , that the thermal displacement must reach in order for the vortex lattice to melt. Houghton et al. (1989); Fisher et al. (1991); Blatter et al. (1994) Attempts have been made to calculate , with values between 0.2 and 0.4 obtained for the cuprates, depending on the specific model (see Blatter et al. (1994) for a review), but is probably better left as a fit parameter. Kim and Kim (1996)
III Experiment
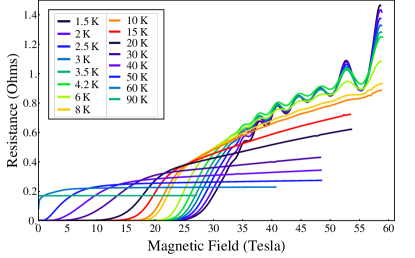
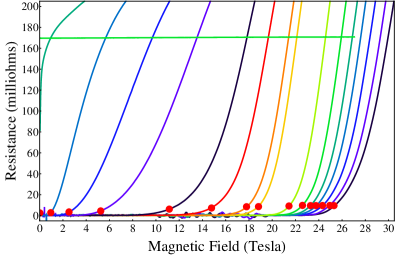
All of the samples used in this study were fully-detwinned, single-crystal YBa2Cu3Oy, grown in barium zirconate crucibles and annealed in oxygen to the desired concentration.Liang et al. (1998) Gold contacts were evaporated onto the a-b faces for a four-point c-axis resistivity geometry, and the gold was partially diffused into the sample near C to obtain sub-ohm contacts.Ramshaw (2012) The chain oxygen was then ordered into superstructures (ortho-II for YBa2Cu3O6.45 through YBa2Cu3O6.59, ortho-VIII for YBa2Cu3O6.67, ortho-III for YBa2Cu3O6.75, and ortho-I for YBa2Cu3O6.86 and YBa2Cu3O6.92) by annealing the samples just below the superstructure transition temperature.Von Zimmermann et al. (2003) Figure 1 shows a typical set of -axis resistivity curves up to 60 tesla, from 1.5 to 200 K for YBa2Cu3O6.59. We define the resistive vortex-melting transition as the magnetic field where the resistance is of its value at 60 tesla. The definition of from resistivity curves is somewhat uncertain because of the width of the resistive transition (see upper panel of Figure 2). An alternative definition would be the intersection of a line tangent to the steepest part of the resistive transition with the temperature axis. This would lead to small offsets (one tesla at most) in , but would not otherwise affect the conclusions of this paper. However, it is important that a consistent definition across different doping levels be used.
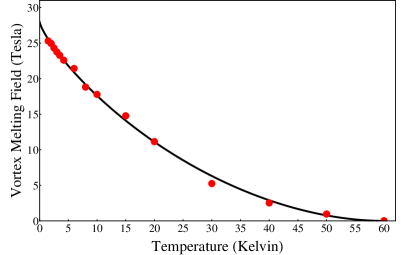
The upper panel of Figure 2 shows the vortex lattice melting transition from 1.2 K up to for YBa2Cu3O6.59, one of the underdoped samples in which the melting transition is accessible even at low temperatures. The concave upwards shape is characteristic of a vortex melting transition, as seen before in YBa2Cu3Oy and in other cuprates, Ando et al. (1999); Kim and Kim (1996) and differs qualitatively from the concave downwards curvature of in conventional superconductors. This form has been observed in a number of cuprates, Ando et al. (1999); Lake, B and Rønnow, HM and Christensen, NB and Aeppli, G and Lefmann, K and McMorrow, DF and Vorderwisch, P and Smeibidl, P and Mangkorntong, N and Sasagawa, T and Nohara, M and Takagi, H and Mason, TE (2002); LeBoeuf et al. (2011) but a systematic comparison to Equation 2 across the underdoped regime of the cuprates has not been performed. Here we present data for YBa2Cu3Oy from oxygen content 6.45 to 6.92, with s ranging from 44.5 to 93.5 K, and identify trends that arise as a function of doping. Characteristic curves for several other dopings are shown in Figure 3, all with an upwards curvature, although that shape becomes less pronounced for the higher samples.
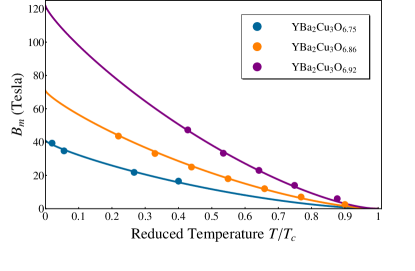
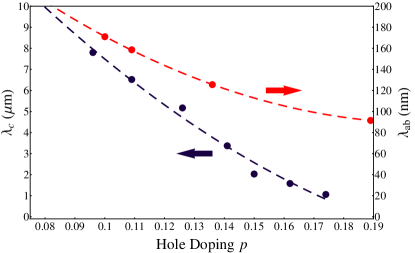
Equation 2 can be expanded about and solved for as shown in Blatter et al. (1994), but if the full temperature range from 1.5 K to is to be used then it is more accurate to fit to the full implicit expression for . The use of Equation 2 requires both the in and out-of-plane zero-temperature penetration depths, as well as the : these values are also listed along with the hole doping (estimated using Liang et al. (2006)) in Table 1. The in-plane penetration depth values, , come from electron-spin resonance (ESR) measurements Pereg-Barnea et al. (2004) and from muon-spin rotation experiments, Sonier et al. (1997) both performed on comparable YBa2Cu3Oy crystals grown at UBC. In the case of the ESR values, the geometric mean of and was taken. Out-of-plane penetration depth values, , come from infrared reflectance measurements, Homes et al. (1995) also performed on UBC crystals. Interpolated values for the penetration depth were used when the exact doping values were not available. The penetration depth values and the interpolation are shown in the upper panel of Figure 4.
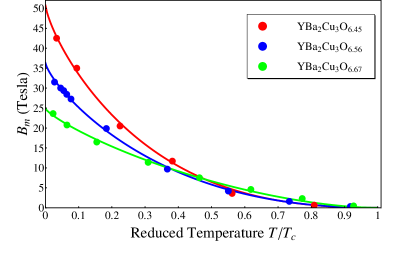
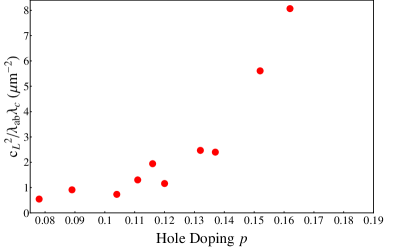
With , , and experimentally determined, the data at each doping can be fit using only two parameters: and . The fits in the lower panel of Figure 2 and in Figure 3 clearly show that three-dimensional vortex melting describes the in-field resistive transition in YBa2Cu3Oy from to . The penetration depth anisotropy, , changes from at 6.45 to at 6.92: this results in decreased curvature of the melting line as oxygen content (and hole doping) increases. This is the same behaviour seen in several different cuprates of varying anisotropy, reported in Ando et al. (1999). The and values extracted this way are given in Table 1 for all of the dopings measured.The fact that the Lindemann number remains relatively constant as a function of doping means that the shape of the melting curve is determined primarily by the penetration depths, which are becoming less anisotropic as hole doping increases. The Lindemann number and the penetration depths appear only as the ratio in Equation 2, and we plot this ratio in the lower panel of Figure 4. The increase of with hole doping is what is controlling the changing curvature as a function of doping. With this parameter setting the shape, corresponds to the intercept of the melting curve.
It should be emphasized that in Equation 2
| (5) |
and so the values of derived from fits to Equation 2 are determined mostly by the zero-temperature intercept of the data for vs. , and are essentially independent of the penetration depth values chosen. The penetration depths and the Lindemann number always enter Equation 2 as the ratio , and so errors in the penetration depth values (which arise because we use interpolated values from the upper panel of Figure 4) are absorbed into the fit value of .
In using Equation 2, we have ignored the possibility that the onset of finite resistivity is due to the lattice depinning, and not actually melting. This assumption is probably justified, as the depinning transition is distinct from the melting transition in YBa2Cu3Oy only for temperatures very close to and in samples with extremely low disorder. Liang et al. (1996) The fits shown in Figure 2 and Figure 3 show data up to near when available, but only data at temperatures less than were used in the fits (which also avoids any possible effects of XY-critical phenomena near ).Fisher et al. (1991) Additionally, all of the samples in this study (except for possibly the YBa2Cu3O6.92 sample) have more disorder than the YBa2Cu3O6.95 sample used in Liang et al. (1996). This is because the ortho-II, III, V, and VIII states are not perfectly ordered,Von Zimmermann et al. (2003) and have more disorder than ortho-I ordered YBa2Cu3O6.95, which is close to stoichiometry. This disorder pushes the depinning transition closer to .
| Oxygen | Hole | ||||||
| Content | Doping | (K) | (nm) | (m) | (Å) | (tesla) | |
| 6.45 | 0.078 | 44.5 | 208 | 10.2 | 0.37 | ||
| 6.47 | 0.089 | 51 | 189 | 8.8 | 0.41 | ||
| 6.56 | 0.104 | 59 | 165 | 7.0 | 0.31 | ||
| 6.59 | 0.111 | 61.5 | 155 | 6.3 | 0.37 | ||
| 6.67 I | 0.116 | 64.7 | 147 | 5.6 | 0.41 | ||
| 6.67 II | 0.120 | 66 | 144 | 5.3 | 0.31 | ||
| 6.75 | 0.132 | 75.3 | 130 | 4.1 | 0.37 | ||
| 6.80 | 0.137 | 80.5 | 125 | 3.7 | 0.34 | ||
| 6.86 | 0.152 | 91.1 | 111 | 2.4 | 0.39 | ||
| 6.92 | 0.162 | 93.5 | 104 | 1.7 | 0.38 |
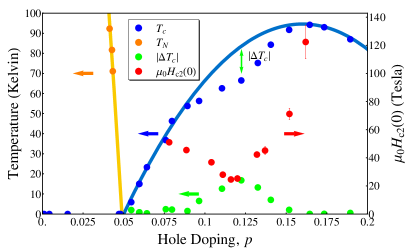
The extracted values for are plotted with the phase diagram of YBa2Cu3Oy in Figure 5, and show an anomaly around 0.12 hole doping. The solid blue line in Figure 5 is the function
| (6) |
where is the maximum of the material (equal to 94.3 K for YBa2Cu3Oy).Liang et al. (2006) This function has been found to describe as a function of in the cuprates, except for the suppression of around 1/8th hole doping. Liang et al. (2006) The green circles in Figure 5 are the absolute difference between the actual and Equation 6, and the suppression of is clearly correlated with a suppression of . Suppression of the melting transition in this region was reported for a few different doping levels in LeBoeuf et al. (2011).
IV Discussion
The suppression of in the underdoped region of the phase diagram was mapped in detail by Liang et al. (2006). In the same work, Liang et al. (2006) correlated the -axis lattice parameter with the hole doping of the copper-oxygen planes, showing a smooth evolution of hole doping with increased oxygen content. This demonstrates that the suppression of is not due to some peculiarity of the copper-oxygen chain doping mechanism in YBa2Cu3Oy, but is in fact inherent to the electronic properties of the material. It was supposed that the suppression of may be due to a competition of superconductivity with stripe formation, as has been demonstrated explicitly in the lanthanum cuprates. Tranquada et al. (1995)
The phase diagram in Figure 5 shows a clear correlation between the suppression of near 0.12 hole doping and a suppression in the melting field and hence a suppression of . This further strengthens the case that the anomaly in is related to a weakening of superconductivity. The corresponding maximum in coherence length—recall that —has also been seen in Sonier et al. (2007) and in the fluctuation-magnetoconductance222In both of these experiments, the peak in coherence length was reported near oxygen 6.70, which would appear to be above where the peak occurs in Figure 5. However, the oxygen content values reported may be shifted due to the different standards used for determining zero chain oxygen content, so that is a better indicator of the hole doping. Liang et al. (2006) The peak in Figure 5 of Ando and Segawa (2002) appears at K, with the next data point at K. The peak in Figure 5 of this current work occurs near K: these peaks are therefore consistent with each other. Similarly for Sonier et al. (2007), using as a means of computing hole doping reveals that their peak in corresponds to the same doping as our minimum in .. Ando and Segawa (2002)
Recent NMR Wu et al. (2011) and x-ray diffraction Ghiringhelli et al. (2012); Chang et al. (2012a); Achkar et al. (2012) experiments have indicated the possibility of charge order in underdoped YBa2Cu3Oy. In all three x-ray diffraction experiments, the charge order was seen to drop in intensity below . Additionally, Chang et al. (2012a) found that the intensity of the charge-order peaks could be increased with an applied magnetic field below . These experiments give further evidence for a close competition between superconductivity and the charge ordered state. This is in agreement with the minimum in we observe near 0.12 hole doping.
V Conclusion
The onset of finite resistivity in a magnetic field coincides with the vortex melting transition in YBa2Cu3Oy. This melting transition can be substantially below mean-field at temperatures between 0 K and . Houghton et al. (1989) Using a Lindemann criterion for melting produces good agreement between theory and experiment, with a Lindemann number between 0.3 and 0.4. These values are consistent with theoretical predictions, which vary between 0.2 and 0.4 for highly anisotropic materials. Blatter et al. (1994) Because this model agrees well with the data across such a wide range of dopings (and anisotropies) where is experimentally accessible, it is reasonable to assume that the extrapolations to zero temperature at higher doping levels gives a reasonable determination of .
Within the framework we used for flux-line-lattice melting, Houghton et al. (1989); Fisher et al. (1991); Blatter et al. (1994) is required to approach as . The agreement between our data and this theory suggests that , in contrast to previous suggestions. Wang et al. (2002, 2003, 2006); Riggs et al. (2011) This means that the quantum oscillations seen in underdoped YBa2Cu3Oy would occur in a state free of vortices (superconducting fluctuations may still be present,Chang et al. (2012b) of course, as detected in the Nernst signal,Chang et al. (2010) for example.) This absence of vortices is consistent with the lack of a field-dependent scattering term needed to fully describe the quantum oscillations. Ramshaw et al. (2011)
Below optimal doping, is rapidly suppressed with decreasing hole doping, reaching a minimum of 24.5 tesla at holes. At lower hole doping recovers—even as continues to decrease—indicating the presence of a phase that competes with superconductivity, a phase which is strongest between 0.11 and 0.13 holes.
VI Acknowledgements
The authors acknowledge support from the Canadian Institute for Advanced Research, the Natural Sciences and Engineering Research Council of Canada, the Canada Foundation for Innovation, and Euromagnet II. L.T. Acknowledges a Canada Research Chair and Fonds Québécois de la Recherche sur la Nature.
References
- Doiron-Leyraud et al. (2007) N. Doiron-Leyraud, C. Proust, D. LeBoeuf, J. Levallois, J.-B. Bonnemaison, R. Liang, D. A. Bonn, W. N. Hardy, and L. Taillefer, Nature 447, 565 (2007).
- Kamal et al. (1994) S. Kamal, D. A. Bonn, N. Goldenfeld, P. J. Hirschfeld, R. Liang, and W. N. Hardy, Phys. Rev. Lett. 73, 1845 (1994).
- Pasler et al. (1998) V. Pasler, P. Schweiss, C. Meingast, B. Obst, H. Wühl, A. I. Rykov, and S. Tajima, Phys. Rev. Lett. 81, 1094 (1998).
- Xu et al. (2009) H. Xu, S. Li, S. M. Anlage, C. J. Lobb, M. C. Sullivan, K. Segawa, and Y. Ando, Phys. Rev. B 80, 104518 (2009).
- Liang et al. (1996) R. Liang, D. A. Bonn, and W. N. Hardy, Phys. Rev. Lett. 76, 835 (1996).
- Ando et al. (1999) Y. Ando, G. S. Boebinger, A. Passner, L. F. Schneemeyer, T. Kimura, M. Okuya, S. Watauchi, J. Shimoyama, K. Kishio, K. Tamasaku, N. Ichikawa, and S. Uchida, Phys. Rev. B 60, 12475 (1999).
- Fisher et al. (1991) D. S. Fisher, M. P. A. Fisher, and D. A. Huse, Phys. Rev. B 43, 130 (1991).
- Safar et al. (1992) H. Safar, P. L. Gammel, D. A. Huse, D. J. Bishop, J. P. Rice, and D. M. Ginsberg, Phys. Rev. Lett. 69, 824 (1992).
- Wang et al. (2006) Y. Wang, L. Li, and N. P. Ong, Phys. Rev. B 73, 024510 (2006).
- Abrikosov (1957) A. A. Abrikosov, Soviet Physics JETP-USSR 5, 1174 (1957).
- Note (1) All formulae in this paper have been converted to SI units. Factors of that may seem redundant, such as in Equation 3 and Equation 4, have been left un-cancelled in order to keep the conversion to SI units transparent.
- Houghton et al. (1989) A. Houghton, R. A. Pelcovits, and A. Sudbø, Phys. Rev. B 40, 6763 (1989).
- Blatter et al. (1994) G. Blatter, M. V. Feigel’man, V. B. Geshkenbein, A. I. Larkin, and V. M. Vinokur, Rev. Mod. Phys. 66, 1125 (1994).
- Kim and Kim (1996) G. C. Kim and Y. C. Kim, Applied Superconductivity 4, 151 (1996).
- Liang et al. (1998) R. Liang, D. Bonn, and W. Hardy, Physica C: Superconductivity 304, 105 (1998).
- Ramshaw (2012) B. Ramshaw, Shubnikov-de Haas Measurements and the Spin Magnetic Moment of YBa2Cu3O6.59, Ph.D. thesis, University of British Columbia (2012).
- Von Zimmermann et al. (2003) M. Von Zimmermann, J. Schneider, T. Frello, N. Andersen, J. Madsen, M. Kall, H. Poulsen, R. Liang, P. Dosanjh, and W. Hardy, Physical Review B 68, 104515 (2003).
- Lake, B and Rønnow, HM and Christensen, NB and Aeppli, G and Lefmann, K and McMorrow, DF and Vorderwisch, P and Smeibidl, P and Mangkorntong, N and Sasagawa, T and Nohara, M and Takagi, H and Mason, TE (2002) Lake, B and Rønnow, HM and Christensen, NB and Aeppli, G and Lefmann, K and McMorrow, DF and Vorderwisch, P and Smeibidl, P and Mangkorntong, N and Sasagawa, T and Nohara, M and Takagi, H and Mason, TE, Nature 415, 299 (2002).
- LeBoeuf et al. (2011) D. LeBoeuf, N. Doiron-Leyraud, B. Vignolle, M. Sutherland, B. J. Ramshaw, J. Levallois, R. Daou, F. Laliberté, O. Cyr-Choinière, J. Chang, Y. J. Jo, L. Balicas, R. Liang, D. A. Bonn, W. N. Hardy, C. Proust, and L. Taillefer, Phys. Rev. B 83, 054506 (2011).
- Liang et al. (2006) R. Liang, D. A. Bonn, and W. N. Hardy, Phys. Rev. B 73, 180505 (2006).
- Pereg-Barnea et al. (2004) T. Pereg-Barnea, P. J. Turner, R. Harris, G. K. Mullins, J. S. Bobowski, M. Raudsepp, R. Liang, D. A. Bonn, and W. N. Hardy, Phys. Rev. B 69, 184513 (2004).
- Sonier et al. (1997) J. E. Sonier, J. H. Brewer, R. F. Kiefl, D. A. Bonn, S. R. Dunsiger, W. N. Hardy, R. Liang, W. A. MacFarlane, R. I. Miller, T. M. Riseman, D. R. Noakes, C. E. Stronach, and M. F. White, Phys. Rev. Lett. 79, 2875 (1997).
- Homes et al. (1995) C. Homes, T. Timusk, D. Bonn, R. Liang, and W. Hardy, Physica C: Superconductivity 254, 265 (1995).
- Tranquada et al. (1995) J. Tranquada, B. Sternlieb, J. Axe, Y. Nakamura, and S. Uchida, Nature 375, 561 (1995).
- Sonier et al. (2007) J. E. Sonier, S. A. Sabok-Sayr, F. D. Callaghan, C. V. Kaiser, V. Pacradouni, J. H. Brewer, S. L. Stubbs, W. N. Hardy, D. A. Bonn, R. Liang, and W. A. Atkinson, Phys. Rev. B 76, 134518 (2007).
- Note (2) In both of these experiments, the peak in coherence length was reported near oxygen 6.70, which would appear to be above where the peak occurs in Figure 5. However, the oxygen content values reported may be shifted due to the different standards used for determining zero chain oxygen content, so that is a better indicator of the hole doping. Liang et al. (2006) The peak in Figure 5 of Ando and Segawa (2002) appears at K, with the next data point at K. The peak in Figure 5 of this current work occurs near K: these peaks are therefore consistent with each other. Similarly for Sonier et al. (2007), using as a means of computing hole doping reveals that their peak in corresponds to the same doping as our minimum in .
- Ando and Segawa (2002) Y. Ando and K. Segawa, Phys. Rev. Lett. 88, 167005 (2002).
- Wu et al. (2011) T. Wu, H. Mayaffre, S. Kraemer, M. Horvatic, C. Berthier, W. N. Hardy, R. Liang, D. A. Bonn, and M.-H. Julien, Nature 477, 191 (2011).
- Ghiringhelli et al. (2012) G. Ghiringhelli, M. Le Tacon, M. Minola, S. Blanco-Canosa, C. Mazzoli, N. B. Brookes, G. M. De Luca, A. Frano, D. G. Hawthorn, F. He, T. Loew, M. M. Sala, D. C. Peets, M. Salluzzo, E. Schierle, R. Sutarto, G. A. Sawatzky, E. Weschke, B. Keimer, and L. Braicovich, Science 337, 821 (2012).
- Chang et al. (2012a) J. Chang, A. T. Blackburn, N. B. Holmes, J. Christensen, J. Larsen, J. Mesot, R. Liang, D. A. Bonn, W. N. Hardy, A. Watenphul, M. v. Zimmerman, E. M. Forgan, and S. M. Hayden, Nature Physics (2012a), 10.1038/nphys2456.
- Achkar et al. (2012) A. J. Achkar, R. Sutarto, X. Mao, F. He, A. Frano, S. Blanco-Canosa, M. Le Tacon, G. Ghiringhelli, L. Braicovich, M. Minola, M. Moretti Sala, C. Mazzoli, R. Liang, D. A. Bonn, W. N. Hardy, B. Keimer, G. A. Sawatzky, and D. G. Hawthorn, Phys. Rev. Lett. 109, 167001 (2012).
- Wang et al. (2002) Y. Wang, N. P. Ong, Z. A. Xu, T. Kakeshita, S. Uchida, D. A. Bonn, R. Liang, and W. N. Hardy, Phys. Rev. Lett. 88, 257003 (2002).
- Wang et al. (2003) Y. Wang, S. Ono, Y. Onose, G. Gu, Y. Ando, Y. Tokura, S. Uchida, and N. P. Ong, Science 299, 86 (2003).
- Riggs et al. (2011) S. C. Riggs, O. Vafek, J. B. Kemper, J. B. Betts, A. Migliori, F. F. Balakirev, W. N. Hardy, R. Liang, D. A. Bonn, and G. S. Boebinger, Nature Physics 7, 332 (2011).
- Chang et al. (2012b) J. Chang, N. Doiron-Leyraud, O. Cyr-Choinière, G. Grissonnanche, F. Laliberté, E. Hassinger, J.-P. Reid, R. Daou, S. Pyon, T. Takayama, H. Takagi, and L. Taillefer, Nature Physics 8, 751–756 (2012b).
- Chang et al. (2010) J. Chang, R. Daou, C. Proust, D. LeBoeuf, N. Doiron-Leyraud, F. Laliberté, B. Pingault, B. J. Ramshaw, R. Liang, D. A. Bonn, W. N. Hardy, H. Takagi, A. B. Antunes, I. Sheikin, K. Behnia, and L. Taillefer, Phys. Rev. Lett. 104, 057005 (2010).
- Ramshaw et al. (2011) B. J. Ramshaw, B. Vignolle, J. Day, R. Liang, W. N. Hardy, C. Proust, and D. A. Bonn, Nature Physics 7, 234 (2011).