Limits on the high redshift growth of massive black holes
We place firm upper limits on the global accretion history of massive black holes at from the recently measured unresolved fraction of the cosmic X–ray background. The maximum allowed unresolved intensity observed at 1.5 keV implies a maximum accreted–mass density onto massive black holes of M⊙Mpc-3 for . Considering the contribution of lower– AGNs, the value reduces to M⊙Mpc-3. The tension between the need for the efficient and rapid accretion required by the observation of massive black holes already in place at and the strict upper limit on the accreted mass derived from the X–ray background may indicate that black holes are rare in high redshift galaxies, or that accretion is efficient only for black holes hosted by rare galaxies.
Key Words.:
cosmology: observations – X–ray: diffuse background – galaxies: active1 Introduction
While there is ample evidence that some supermassive black holes with masses exceeding M⊙ formed as early as (with a redshift record of reported by Mortlock et al. 2011; see also, e.g., Fan et al. 2001, Barth et al. 2003, Willott et al. 2009, Jiang et al. 2009), there is currently little or no constraint on the evolution of the supermassive black–hole population, as a whole, at the same redshifts. We have only been able to probe the most exceptional quasars, which are powered by the most–massive black holes.
A powerful tool capable of globally constraining the nature of the high redshift massive black–hole (MBH) population, at least of its active fraction, that is manifested as active galactic nuclei (AGNs), is the measure of the unresolved cosmic X–ray background (CXRB) (Dijkstra et al. 2004, Salvaterra et al. 2005, Salvaterra et al. 2007, McQuinn 2012).
Chandra deep observations have succeeded in resolving almost the entire (80-90%) CXRB over its whole X-ray bandwidth (0.5–8 keV). The resolved fraction is almost at low energies, but decreases slightly, down to 85%, at higher energies (see fig. 8 in Moretti et al. 2012, see also Moretti et al. 2003, Worsley et al. 2005). Cosmic X-ray background sources have been found to be mostly AGNs with some contribution at soft energies ( 2 keV) from galaxy clusters and starburst galaxies (Xue et al. 2011, Lehmer et al. 2012). Most of the CXRB signal comes from sources located at , with only % being produced at (Xue et al. 2011). While in the hard band (2–10 keV) the residual unresolved fraction is commonly believed to be entirely due to the integrated emission of undetected point sources, in the softer band (0.5–2 keV) most of the diffuse emission is due to thermal radiation from the Galaxy and the local hot bubble (Kuntz & Snowden 2000). A direct assessment of the unresolved fraction of the CXRB was performed by Hickox & Marckevitch (2007) using Chandra deep field data. They found a small but statistically significant diffuse emission in the 1–2 keV band, but an emission consistent with zero at higher energies. However, the high Chandra instrument background, 25 times higher than the unresolved CXRB, makes this measure highly uncertain.
Moretti et al. (2012) exploited the very low (compared to Chandra) instrument background of the Swift XRT to measure the unresolved spectrum with the highest accuracy available today. This spectroscopic measure allowed the unresolved CXRB to be accurately probed with a much higher energy resolution. In particular, the constraint on the 1.5–2 keV band is a factor of three tighter than before.
In this letter, we take advantage of these new measurements of the unresolved fraction of the CXRB to put firm upper limits on the global accretion history of massive black holes at . The aim of our approach is not to exclude a particular model but rather to highlight the existence of some tension between the need for efficient and rapid accretion required by the observation of supermassive black holes already in place at and the strict upper limit on the accreted mass of the whole high– MBH population imposed by the very tiny CXRB unresolved fraction.
We adopt a cosmology.
2 Soltan’s argument and the CXRB
The so–called “Soltan’s argument” (Soltan 1982) translates the observed radiation emission of AGNs integrated over the cosmic history of the Universe into mass accreted onto the putative supermassive black-hole population. While the argument is usually expressed in terms of AGN luminosity functions, it is straightforward to apply it in the context of background radiation in a given observed band, which can easily be done as follows.
Let us assume that the average AGN X-ray spectrum has a power–law form , so that the comoving specific emissivity vs. redshift can be factorized as
| (1) |
Here is a function describing the redshift evolution of the emissivity. Neglecting absorption in the IGM, the contribution to the background at observed energy due to sources located at redshifts is
| (2) |
where . If (the matter– equivalence redshift), we can neglect the cosmological constant energy density in the line element, and by assuming derive the normalization emissivity
| (3) |
Now let us consider the standard Soltan’s argument. The comoving mass density accreted onto MBHs within a given is
| (4) |
where is the mass–radiation conversion efficiency. It is worth noting that at high redshifts could well be significantly lower than the total mass density locked in MBHs. We now relate the bolometric emissivity to the emissivity in a given energy band, , by introducing a bolometric correction
| (5) |
By substituting eq. 3 into eq. 4 and integrating, we finally obtain
| (6) | |||||
which is valid for . The above formula allows us to estimate the maximum mass accreted onto MBHs within any given redshift interval, that contributes at any specified level to the observed background.
3 Results
We are interested in placing a firm upper limit on the mass accreted onto MBHs prior to by considering the unresolved fraction of the CXRB. The unresolved CXRB is well–described by a single power–law with a very hard photon-index () and a flux of erg s-1 cm-2 deg-2 in the 1.5–7 keV energy band. Comparing the measured unresolved CXRB to the AGN population model by Gilli et al. (2007), Moretti et al. (2012) find that most of the flux at keV can be accounted for by faint, sources, but that their model falls short for keV, suggesting that there is a larger population of Compton thick sources at moderate redshifts (, see fig. 10 in Moretti et al. 2012). The maximum allowed (1– error) intensity of the unresolved CXRB at 1.5 keV is erg s-1 cm-2 deg-2. This value reduces to erg s-1 cm-2 deg-2 when the contribution of the faint sources modeled by Gilli et al. (2007) is taken into account. Eq. 6 derived in the previous section can be used to readily translate these limits into constraints on the total accreted mass density. To model the average Type I-Type II composite AGN spectrum, we adopt the spectral energy distribution (SED) proposed by Sazonov, Ostriker & Sunyaev (2004). In the 2–10 keV range, the spectrum is well–approximated by a power–law with , with a bolometric correction . Assuming , for keV eq. 6 gives111We note that for reasonable values of the cosmic evolution .
| (7) |
In general, our mass density limit is valid for any X–ray emitting population that is not resolved above in the deepest X–ray surveys. For our purposes, the above limit is valid in particular for as no AGNs above such a redshift limit has been identified in the 4 Msec CDF-S (Xue et al. 2011).
In fig. 1, we plot the limits obtained by adopting the Moretti et al. (2012) results described above. The dark shaded region is excluded since it would imply an unresolved CXRB at 1.5 keV that is higher than observed. The more stringent light-shaded region is obtained by subtracting the contribution of faint or absorbed sources or both at . At , the maximal possible accreted mass along the cosmic evolution of MBHs is M⊙Mpc-3 ( M⊙Mpc-3 subtracting the faint sources at lower redshifts).
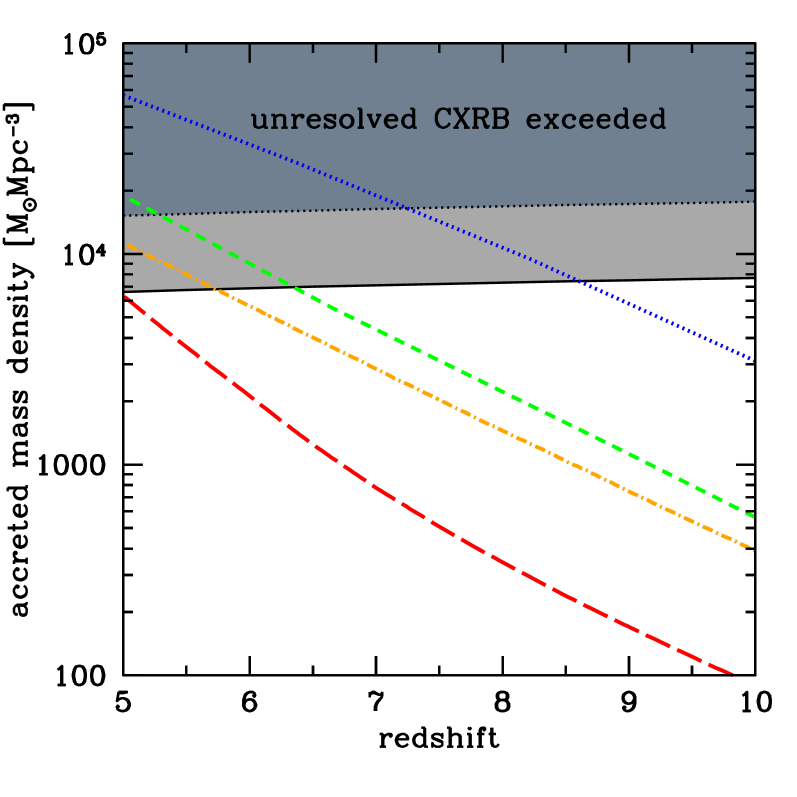
The limits obtained above provide strong constraints on the models of the formation and evolution of MBHs in the early Universe. The accreted mass density is one of the most direct predictions of semi-analytical models (see Volonteri 2010 for a review) and can be directly compared with our constraints. We compare our limit on to simple models (Volonteri & Begelman 2010), which assume that all MBHs shine at a fixed fraction, 30%, of the Eddington luminosity and that accretion activity is major-merger driven and self-regulated by the host, assuming an unvarying relation to the velocity dispersion at all redshifts. Gravitational wave recoil is neglected. In spite of the simple description of the physical processes leading to the growth of the seeds (e.g., assumptions of a constant Eddington ratio for all objects at all redshifts and of the local scaling relations being established in the high redshift Universe), these models are rather successful in reproducing the observed AGN population. As an example, they reproduce the local MBH mass density, and the observed AGN bolometric luminosity function at low-to-intermediate redshifts. We stress that the accreted mass density should be considered a qualitative result, as Volonteri & Begelman (2010) did not attempt to model in detail the evolution of the MBH population (e.g., they assumed a fixed accretion rate for all MBHs at all times, which is clearly an oversimplification), but instead whished to estimate whether a particular class of seeds produced a physically reasonable MBH population. Despite the qualitative nature of the theoretical constraints, these models are very useful in putting the strict limit on the accreted mass density implied by the CXRB in the context of MBH evolution studies.
Models involving stellar-size Population III seeds may have difficulties in accounting for the existence of a MBH as massive as M⊙ at , as observed by Mortlock et al. (2011) (see discussion in Petri, Ferrara, Salvaterra 2012). A model involving stellar-sized seeds is below our limits (lower long–dashed curve in Fig. 1), but fixing the accretion rate at 30% of the Eddington luminosity, it is unable to explain the presence of the population of quasars (Willott et al. 2010). If we increased the accretion rate to 100% Eddington, to account for quasars, this model would overproduce the total unresolved CXRB (see Treister et al. 2011 for an example of this case).
Massive seeds, e.g., the so-called “quasistars” (see Volonteri 2010 and references therein), seem to be a more viable option to explain the observed population of high-z quasars. This class of models accounts for a population of MBHs with at . Volonteri & Begelman (2010) provide two observationally limited cases for the efficiency of the formation of massive seeds. The results in terms of are also shown in fig. 1. The high efficiency model (upper dotted curve) results in a very early reionization of the IGM, while the low efficiency one (middle short-dashed curve) barely succeeds in assembling enough MBHs as massive as M⊙ by . Direct collapse models with fixed accretion rates all exceed our limits. The model with the higher efficiency would overproduce the total unresolved CXRB at , while the low efficiency model is above the more stringent limit based on the subtraction of lower-resdhift sources, for . Similar results are found by considering the MBH growth models of Volonteri, Lodato & Natarajan (2008), and Agarwal et al. (2012), among others.
We stress that our result does not directly favour one seed model over another, but highlights the strong constraints on the average accretion rate of the high-z MBH population, as a whole. Assuming an initial mass density (), and a mean Eddington ratio222Which can be considered a combination of accretion rate and duty cycle, see, e.g., Tanaka, Perna, & Haiman 2012. (), the accreted mass density is
| (8) |
where Gyrs ( is the speed of light, is the Thomson cross–section, and is the proton rest mass). This approximation requires that all seeds have similar masses and form roughly at the same time. Additionally, such a generic argument does not take into account any self-regulation or feedback effect that limits the MBH growth. Keeping these caveats in mind, for plausible values of M⊙ Mpc-3, the average must be less than 0.1–0.3 at . This is in line with lower–redshift results that the distribution of Eddington rates of luminous quasars is dominated by sub–Eddington sources (Kelly et al. 2010). With such an average , the M⊙ black–hole observed by Mortlock et al. (2011) at would require a seed black-hole of mass exceeding M⊙. We conclude that the most massive MBHs at very high redshift cannot accrete at the average Eddington ratio (see also Trakhtenbrot et al. 2011). Models require rates close to Eddington to explain the high–mass end of the mass function of quasar-powering MBHs (Natarajan & Volonteri 2011).
4 Possible solutions
Massive black–hole growth models seem to predict above our observational limit. One may argue that the bulk of the accreted mass is missing in the small volume sampled by the CDFs. A simple estimate implies that objects rarer than Mpc-3 are not present in the field. However, even assuming that all of these BHs were accreted up to M⊙, the resulting would be much lower than our limit, further increasing the disagreement with evolutionary models.
On the theoretical side, models tested here are based on simple assumptions. As an example, is expected to be reduced by gravitational wave recoil, which we however neglect. We did check that in the considered models the effect on is at most %, hence that the inclusion of the recoil does not represent a viable solution. A stronger impact, but still insufficient, is obtained by considering a non–fixed accretion rate. A model starting from massive seeds coupled to the empirical distribution of Eddington ratios derived by Merloni & Heinz (2008), shown in fig. 1 as a dot–dashed line, exceeds our limit at .
The most promising solution relies on the possibility that the most massive black holes are able to maintain a high during their cosmic history, while lighter ones accrete at a much lower rate. Therefore, accretion must strongly depend on either the MBH mass (or most likely the host mass as in ‘selective accretion’, Volonteri & Stark 2011) or environment (di Matteo et al. 2012), or must have a low–mass cut-off (“global warming”, Tanaka et al. 2012). This is in line with the observational evidence that high redshift quasars seem to be powered by MBHs that are ‘over-massive’ for a fixed galaxy property with respect to their counterparts at (e.g., Wang et al. 2010). Willott et al. (2010) instead find that either many massive galaxies at do not have MBHs, or that these MBHs are less massive than expected assuming that MBHs are roughly 1/1000 of the host stellar mass. This suggests overall that while some (most–likely the most massive) MBHs can grow above today’s correlations, most of them should be less massive than expected from local relations (cf. Volonteri & Stark 2011).
5 Conclusions
We have placed firm upper limits on the global accretion history of MBH at by taking advantage of the measurement of the unresolved fraction of the CXRB provided by Moretti et al. (2012). The maximum allowed unresolved CXRB intensity observed at 1.5 keV implies a maximum accreted–mass density onto MBH at of M⊙Mpc-3. Considering the contribution of lower– AGNs333Adopting the speculative model of Moretti et al. (2012) which is able to explain the very hard shape of the unresolved 1.5–7 keV CXRB, the limit on further decreases by a factor of . (Gilli et al. 2007), this limit reduces to M⊙Mpc-3. This value translates into HI ionizing photon per baryon produced by accretion onto MBHs at , confirming the common wisdom that hydrogen reionization is driven by stellar–like sources (cf. Haardt & Madau 2012).
It is important to stress that this calculation is a strict upper limit to the accreted mass onto MBHs at , as most of the unresolved CXRB could well be attributed to faint sources at lower redshift that are not accounted for by the Gilli et al. model. That the spectrum of the unresolved CXRB determined by Moretti et al. (2012) is very hard, alone seems to exclude there be a significant contribution from AGNs at . For such a population, the Compton reflection roll–over (rest–frame energy keV) would fall within the observed energy band, resulting in an emission much softer than the observed unresolved CXRB. Therefore, a significant contribution from high– sources would result in an even harder spectrum of the still unaccounted fraction of the CXRB, possibly at odds with current population–synthesis models.
A possibly stricter upper limit on at can be obtained by the stacking analysis of the X–ray emission of i–dropouts selected by Bouwens et al. (2006) in the CDF–S. In contrast to Treister et al. (2011), Willott (2011), Fiore et al. (2012), and Cowie et al. (2012) did not find any evidence of X–ray emission. The flux limit in the observed hard X–ray band derived from the stacking analysis corresponds to a MBH mass density of M⊙Mpc-3. A much stronger, about ten times lower, upper limit is obtained from the flux limits obtained using the more sensitive soft X–ray band, though here absorption can play a decisive role. These limits are tighter than ours at the same redshift, although we believe that our results are less subject to biases and assumptions than those derived from the stacking analysis. In particular: i) the stacking analysis relies on the corrections for incompleteness, photometric redshift measurements, and dust absorption of the Bouwens et al. sample; ii) the flux limit of the i–dropouts implicitly introduces a lower limit on the MBH mass probed (that we estimate to be a few times M⊙); and iii) the stacking analysis results strictly refer only to the AGN activity in a narrow redshift range. The limits we place on are instead unaffected by any of these effects since the background intensity directly measures the time–integrated accreted mass.
We investigate how much our assumptions on the emission properties of high– MBHs affect our results. The adoption of a much flatter SED, e.g. with , will result in limits that are less stringent than those shown in fig. 1. On the other hand, as shown by Marconi et al. (2004), the fraction of light emitted by AGNs in the rest-frame 2–10 keV band increases with decreasing bolometric luminosities, so that can be considered a conservative choice. We note that at the observed 1.5 keV photons has been emitted at energy keV, where absorption can not be very strong even for high intrinsic column–densities. Thus, even assuming that high– AGNs are heavily obscured, our limits cannot increase by much. Finally, our adopted value of the accretion efficiency, , is in–between the range of allowed values. For Schwartzschild BHs (), the limits would be 1.7 higher, while for maximal rotating BHs () they are a factor of six lower.
The bottom line of our analysis is that there is some tension between the need for efficient and rapid accretion required by the observation of SMBHs already in place at (Mortlock et al. 2011), and the strict upper limit on the accreted mass derived from the CXRB. Therefore, accretion must be very efficient for the most massive BHs during their lifetime, but sub–Eddington for most of the AGN population.
Acknowledgements.
We thank F. Fiore for helpful discussions and comments, and the anonymous referee for her/his useful suggestions.References
- (1) Agarwal, B., Khochfar, S., Johnson, J.L., Neistein, E., Dalla Vecchia, C., & Livio, M. 2012, MNRAS submitted, arXiv:1205.6464
- (2) Barth, A.J., Martini, P., Nelson, C.H., & Ho, L.C. 2003, ApJ, 594, L95
- (3) Bouwens, R.J., Illingworth, G.D., Blakeslee, J.P., & Franx M. 2006, ApJ, 653, 53
- (4) Dijkstra, M., Haiman, Z., & Loeb, A. 2004, ApJ, 613, 646
- (5) Di Matteo, T., Khandai, N., DeGraf, C., Feng, Y., Croft, R. A. C., Lopez, J., & Springel, V. 2012, ApJ, 745, L29
- (6) Fan, X., Strauss, M.A., Schneider, D.P., et al. 2001, AJ, 121, 54
- (7) Fiore, F., Puccetti, S., & Mathur, S. 2012, AdAst, 2012, 9
- (8) Gilli, R., Comastri, A., & Hasinger, G. 2007, A&A, 463, 79
- (9) Haardt, F., & Madau, P. 2012, ApJ, 746, 125
- (10) Hickox, R.C., & Markevitch M. 2007, ApJ, 661, L117
- (11) Jiang, L., Fan, X., Bian, F., et al. 2009, AJ, 138, 305
- (12) Kelly, B. C., Vestergaard, M., Fan, X., Hopkins, P., Hernquist, L., & Siemiginowska, A. 2010, ApJ, 719, 1315
- (13) Kuntz, K.D., & Snowden, S.L. 2000, ApJ, 543, 195
- (14) Lehmer, B.D., Xue, Y.Q., Brandt, W.N., et al. 2012, ApJ, 752, 46
- (15) Marconi, A., Risaliti, G., Gilli, R., Hunt, L.K., Maiolino, R., & Salvati, M. 2004, MNRAS, 351, 169
- (16) Merloni, A., & Heinz, S. 2008, MNRAS, 388, 1011
- (17) Moretti, A., Campana, S., Lazzati, D., & Tagliaferri, G. 2003, ApJ, 588, 696
- (18) Moretti, A., Vattakunnel, S., Tozzi, P., Salvaterra, R., Severgnini, P., Fugazza, D., Haardt, F., & Gilli, R. 2012, A&A, 548, A87
- (19) McQuinn, M. 2012 ApJ submitted, arXiv:1206.1335
- (20) Mortlock, D.J., Warren, S.J., Venemans, B.P., et al. 2011, Nature, 474, 616
- (21) Natarajan, P., & Volonteri, M. 2012, MNRAS, 422, 2051
- (22) Petri, A., Ferrara, A., & Salvaterra, R. 2012, MNRAS, 422, 1690
- (23) Salvaterra, R., Haardt, F., & Volonteri, M. 2007, MNRAS, 374, 761
- (24) Salvaterra, R., Haardt, F., & Ferrara, A. 2005, MNRAS, 362, L50
- (25) Sazonov, S.Y., Ostriker, J.P., & Sunyaev, R.A. 2004, MNRAS, 347, 144
- (26) Soltan, A. 1982, MNRAS, 200, 115
- (27) Tanaka, T., Perna, R., & Haiman, Z. 2012, MNRAS submitted, arXiv:1205.6467
- (28) Trakhtenbrot, B., Netzer, H., Lira, P., & Shemmer, O. 2011, ApJ, 730, 7
- (29) Treister, E., Schawinski, K., Volonteri, M., Natarajan, P., Gawiser, E. 2011, Nature, 474, 356
- (30) Volonteri, M., & Begelman, M.C. 2010, MNRAS, 409, 1022
- (31) Volonteri, M., Lodato, G., & Natarajan, P. 2008, MNRAS, 383, 1079
- (32) Volonteri, M. 2010, A&ARv, 18, 1049
- (33) Volonteri, M., & Stark, D.P. 2011, MNRAS, 417, 2058
- (34) Wang, R., Carilli, C.L., Neri, R., et al. 2010, ApJ, 714, 699
- (35) Willot, C.J., Delorme, P., Reyelè, C., et al. 2008, AJ, 682, 745
- (36) Willott, C.J., Albert, L., Arzoumanian, D., et al. 2010, AJ, 140, 546
- (37) Willott, C.J. 2011, ApJ, 742, L8
- (38) Worsley, M.A., Fabian, A.C., Bauer, F.E., et al. 2005, MNRAS, 357, 1281
- (39) Xue, Y.Q., Luo, B., Brandt, W.N., et al. 2011, ApJS, 195, 10
- (40) Yu, Q., & Tremaine, S. 2002, MNRAS, 335, 965