Anomalous anisotropic cross-correlations between WMAP CMB maps and SDSS galaxy distribution and implications on the dark flow scenario
Abstract
We search for the dark flow induced diffuse kinetic Sunyaev Zel’dovich (kSZ) effect through CMB-galaxy cross correlation. Such angular correlation is anisotropic, with a unique angular dependence and hence can be distinguished from other components. Here, is the angle between the opposite dark flow direction and the direction of the sky where the correlation is measured. We analyze the KIAS-VAGC galaxy catalog of SDSS-DR7 and the WMAP seven-year temperature maps, applying an unbiased optimal weighting scheme to eliminate any statistically isotropic components and to enhance the dark flow detection signal. Non-zero weighted cross correlations are detected at for the redshift bin and at for the bin , implying the existence of statistically anisotropic components in CMB. However, further analysis does not support the dark flow explanation. The observed directional dependence deviates from the relation expected, and hence can not be explained by the presence of a single dark flow, and if the observed cross correlation is generated by the dark flow induced kSZ effect, the velocity would be too high ( km/s). We report this work as the first attempt to search for dark flow through weighted CMB-galaxy cross correlation and to draw the attention on the sources of the detected anomalous CMB-galaxy cross correlation.
Subject headings:
Dark flow – Kinetic Sunyaev-Zel’dovich – cross correlation – galaxy and CMB1. Introduction
The peculiar velocity field of galaxies provides an important and robust way to understand the matter distribution of the universe. In the standard cosmology, the peculiar velocities arise from matter density perturbation and are unbiased tracer of the background matter distribution. It has been used to constrain the amplitude of matter power spectrum or the matter density fraction , and it could be used to detect possible sources of gravitational field which can not be observed directly with existing galaxy surveys.
The peculiar velocity field of the nearby universe has been explored extensively using variant velocity tracers. On small scales () the peculiar velocities of galaxies are consistent with the standard model (Pike & Hudson 2005; Abate & Erdoğdu 2009; Juszkiewicz et al. 2010). However, on larger scales, various groups have reported bulk flows with unexpected amplitude. (1) On intermediate scales extending to about , there is mounting evidence of a bulk flow with amplitude using a composition of current velocity catalogs (Watkins et al. 2009; Feldman et al. 2010; Macaulay et al. 2011), which is unlikely within the frame of standard model, despite the fact that there are some authors who claimed normal bulk velocities on these scales using seperate velocity catalog (Nusser & Davis 2011; Turnbull et al. 2012; Ma & Scott 2012). (2) On Gpc scales extending to , an even larger bulk flow of about was reported recently (Kashlinsky et al. 2008, 2009, 2010), by measuring the kinetic Sunyaev-Zel’dovich (kSZ) effect of galaxy clusters in WMAP. Whether or not this dark flow exists is still under intensive detate (c.f. Osborne et al. (2011) and Mody & Hajian (2012) for negative result, and Li et al. (2012) for peculiar velocities in simulation). If confirmed, this large bulk flow, dubbed “dark flow”, would severely challenge the standard model of cosmology and structure formation.
It is therefore valuable to perform independent tests of the dark flow scenario beyond the cluster kSZ effect. In this paper we make an independent observational check of the dark flow scenario by cross-correlating the SDSS-DR7 galaxies with the WMAP 7 year CMB data. The galaxy-CMB cross correlation has been measured extensively (Fosalba et al. 2003; Cabré et al. 2006a, b; Giannantonio et al. 2006, 2008; Ho et al. 2008; Hirata et al. 2008; López-Corredoira et al. 2010; Raccanelli et al. 2008; Sawangwit et al. 2010; Francis & Peacock 2010; Bielby et al. 2010; Hernández-Monteagudo 2010), mainly to detect the integrated Sachs-Wolfe (ISW) effect. Similar analysis can be carried out to probe dark flow, under a specially designed weighing scheme. As Zhang (2010) (hereafter Z10) proposed, a large dark flow will induce significant small scale anisotropies on the CMB temperature through the kSZ effect, due to fluctuations in the free electron number density. On each small patch of the sky, the kSZ effect induced by the clustering pattern of this dark flow traces the large scale structure closely. However, the overall amplitude is modulated and has a dipole pattern across the sky, with the positive maxima located at the direction opposite to the dark flow, and the negative minima located at the direction of the dark flow. This statistically anisotropic distribution is distinctively different from all cosmic sources such as the primary CMB, the ISW effect, the thermal Sunyaev Zel’dovich (tSZ) effect, and the cosmic radio and infrared backgrounds. For this reason, one can apply a weighting function of appropriate directional dependence to eliminate the (statistically) isotropic components and isolate the kSZ component in CMB-galaxy cross correlations. This is a major difference between our work and other existing works on galaxy-CMB cross correlation. The proposed method can be extend to any redshift to measure coherent large scale flow against CMB, if any. It is complementary to the recent measurement by Hand et al. (2012), which measures the mean pairwise momentum of clusters through the kSZ effect of clusters and hence probe the peculiar motion at smaller scales.
In §2 we review the theoretical prediction of the dark flow induced kSZ effect. The CMB temperature maps and galaxy catalog we used are described in §3, and the data analysis is done in §4. Results are shown in §5, along with investigations on possible systematics. We conclude the paper in §6, with a brief summary.
2. The kSZ-galaxy cross correlation
Dark flow, if exists, will induce CMB temperature fluctuations at all angular scales through the modulation of the inhomogeneous electron distribution on the uniform dark flow (Z10). The induced kSZ effect is given by111The original paper (Z10) missed a minus sign. However, numerical results presented in Z10 is unaffected.
| (1) | |||||
where is the CMB temperature at present, is the dark flow velocity vector, with as its amplitude and the angle between the line of sight and the opposite dark flow direction. The effective projection function for the kSZ signal is defined as
| (2) |
where is the ionization fraction, is the Thomson cross section, and is baryon density parameter. The integration in Eq. (1) is over the dark flow region along the line of sight. The first term in the last expression is a pure dipole term, which has no correlation with the large scale structure. For this reason, we will neglect this term hereafter. The second term represents the kSZ effect arising from modulation of the inhomogeneous electron distribution () on the dark flow through the inverse Compton scattering. Clearly, this component traces the large scale structure and is tightly correlated with galaxy distribution. Hence it is promising to search for dark flow by cross correlating CMB temperature maps with galaxy distribution over the redshift range of dark flow. The induced cross correlation is
| (3) |
Here, is the galaxy surface number density fluctuation, is the angular separation between the two lines of sight, with . can be measured over either the whole survey area, or in each sub-region of it. We denoted this area average by a subscript “S”. should not be confused with , which is the angular separation between the opposite dark flow direction and the line of sight.
The kSZ-galaxy cross correlations induced by dark flow have a number of signatures by which it can be distinguished from the cross correlations arising from other CMB components, such as the thermal Sunyaev Zel’dovich effect, the integrated Sachs-Wolfe effect, and the foreground contaminations. Below we discuss these one by one:
-
•
is statistically anisotropic, with a characteristic angular dependence. On the contrary, cross correlations induced by the thermal SZ effect, the ISW effect and extragalactic foregrounds are statistically isotropic. One can search for such signature by splitting the survey sky into sub-regions according to the values of and measure in each sub-regions. Alternatively, one can choose an appropriate weighting function such that the weighted cross correlation
(4) vanishes for any isotropic CMB components. This requires . Here we denote this weighted cross correlation with a subscript “W”. The optimal weighting function minimizing the cross correlation measurement error is222Z10 proves that the optimal weighting function satisfies the equation . Here we show that the solution to the above equation is , up to an arbitrary prefactor of no dependence.
(5) The weighing scheme eliminates statistically isotropic components. Under this weighing scheme, the dark flow induced kSZ survives and the signal is optimized. However, anisotropic components of more complicated angular dependence (e.g. ()) also survive under the weighting. So a non-vanishing means the existence of anisotropic components, but not necessarily means the existence of dark flow. To further test it, we will compare the measured as a function of and check if it follows the dependence.
-
•
should be frequency independent, since kSZ is frequency independent.
-
•
(and ) should have similar dependence as that of the galaxy angular correlation function . The two cross correlations are related by the following order of magnitude approximation,
Here, , is the Thompson optical depth over the dark flow redshift range, is the bias of electron number distribution with respect to matter distribution and is the galaxy bias. For the dark flow direction (, ) reported by Kashlinsky et al. (2010), over the overlapping area of KIAS-VAGC and WMAP7. A complexity is that could have non-negligible scale dependence over relevant scales due to various gastrophysics such as AGN and supernova feedback. So the above relation only serve as a guideline. In the following, we use a fitting formula of gas window from hydrodynamical simulation of Jing et al. (2006) to account for . We define the scaling factor as ratio of observed galaxy correlation function to the halofit model prediction (Smith et al. 2003), , and the galaxy bias is simply, . The resulted kSZ signal induced by a single dark flow are shown in Figure 3 as dashed lines.
Hereafter we will search for the dark flow through such signatures in the WMAP-SDSS cross correlation.
3. Data
Our cross correlation measurements are based on the KIAS-VAGC galaxy catalog of SDSS DR7 main galaxy survey (Choi et al., 2010a) and the CMB temperature maps from the WMAP seven-year data release.
3.1. KIAS-VAGC galaxy catalog
The main source of KIAS-VAGC is the New York University Value-Added galaxy catalog (NYU-VAGC) large scale structure (LSS) sample “brvoid0” (Blanton et al., 2005), which has r-band magnitude limit of 17.6 rather than SDSS limit 17.7 to maintain a homogeneous survey depth and a simple survey boundary. All magnitudes are k-corrected (Blanton et al., 2003a) and evolved to rest frame magnitudes at redshift z=0.1 using an updated version of the evolving luminosity model of Blanton et al. (2003b). The angular selection function is characterized carefully for each sector on the sky. The fiber collision results in about 7% of targeted galaxies not having measured spectra. These galaxies are assigned the redshifts of their nearest neighbors with available spectra. This method has been shown to be reasonably accurate for large scale structure measurement (Zehavi et al., 2005). Additionally, about 10k redshifts are borrowed from other spectroscopy galaxy surveys, such as the updated Zwicky Catalog (UZC) (Falco et al., 1999), the IRAS Point Source Catalog Redshift Survey (PCSZ) (Saunders et al., 2000), the Third Reference Catalog of Bright Galaxies (RC3) (de Vaucouleurs et al., 1995), and the Two Degree field Galaxy Redshift Survey (2dF-GRS) (Colless et al., 2001). The resulted catalog contains 593,514 redshifts and covers 2.56 sr of the sky. In high density regions, KIAS-VAGC has high completeness. More details about the KIAS-VAGC catalog are given in Choi et al. (2010b) and Choi et al. (2010a).
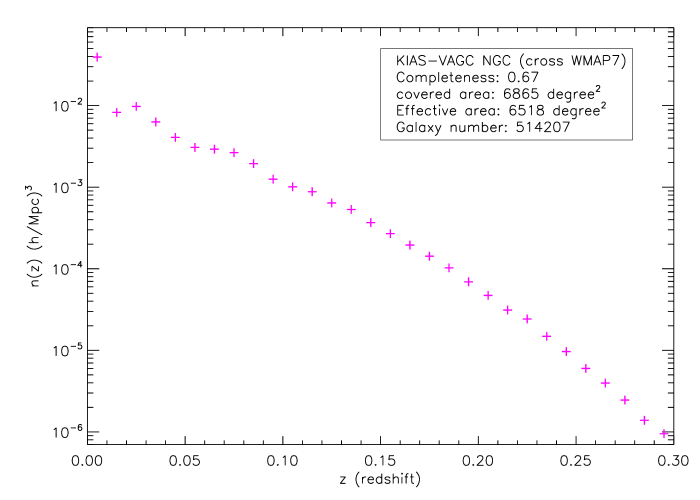
In this work we use the major part of KIAS-VAGC, the north Galactic cap (NGC), which covers an effective area of 6518 square degree. The sky area overlapping with the WMAP7 temperature maps out of the KQ75 mask contains 514207 galaxies. The number density of the resulted galaxy catalog is shown in Figure 1. To study the radial depth over which the dark flow extends, we split the galaxies into two redshift bins: and .
3.2. CMB Temperature Maps
The WMAP seven-year data products are publicly available in the Healpix format (Górski et al. 2005). The WMAP observed in 5 frequency bands, i.e. the band at 23 GHz, band at 31 GHz, band at 41 GHz, band at 61 GHz, and band at 94 GHz. The first two low frequency bands are used to extract Galactic foregrounds. The 3 high frequency bands , and (with 8 channels totally) has subdominant foreground contaminations and relatively higher resolutions, suitable for testing frequency-dependent contaminations to the small scale kSZ-galaxy cross correlations. In fact we do not see any considerable difference in the cross correlation results and the associated measurement errors of these three bands. We do not use the foreground-free ILC map provided by the WMAP team (Delabrouille et al., 2009), due to its low angular resolution (with an FWHM about ). We use the CMB temperature maps with resolution 9 () in Healpix format, corresponding to an angular resolution of 7 arcmins. This results in 3145728 pixels with 47.21 square arcmin each. We use a combination of the “Extended temperature analysis mask” (KQ75) and the “Point Source Catalog Mask” (Gold et al. 2011) to exclude unobserved or foreground contaminated regions. About sky regions are available after these maskings.
To explore the systematics coming from intrinsic CMB fluctuations, and to test the robustness of the Jackknife error estimation method in this analysis, we generated 1000 CMB temperature simulations with the “Synfast” code provided by WMAP. These simulated maps are drawn with the best-fit CMB power spectrum, then we add thermal noise to each map. The thermal noise are Gaussian distributed with a variance inversely proportional to the observation times of each pixel. The thermal noise in different pixels are uncorrelated.
Due to large errors in the cross correlation measurements, we do not use the cross-correlated mock samples for galaxy and CMB. It has been shown that the estimated errors in the cross correlation measurements using the CMB simulation maps are consistent with those using cross correlated mock samples with high precision (Cabré et al. 2007).
4. Cross correlation and error estimation
The galaxy overdensity in the -th pixel is , where is the galaxy surface number density and is the expected mean galaxy number density. The CMB temperature anisotropy is . The cross correlation function at angular separation is given by
| (7) |
Here is the galaxy selection function or completeness and is the fraction of pixel outside of the CMB masks. They are used to correct for the incompleteness of the survey. The sum is over all pairs whose separations are within the angular bins. Correspondingly, the weighted cross correlation is given by
| (8) |
where, is the weighting function given by Eq.(5).
Since we are interested in angular separation of degree scale (), we can perform the above measurement for each small patch of the sky, as long as the sky patch is much larger than one square degree. is defined as the angle between the center of such sky patch and the opposite dark flow direction. For statistically isotropic CMB sources (tSZ, the ordinary kSZ, ISW, etc.) and cosmic radio and infrared foregrounds, the induced cross correlations (contaminations for our purpose) should be isotropic and be independent of . Only the dark flow induced kSZ has the characteristic angular dependence. This is the key to separate this component from other correlations.
We estimate the errors of the cross correlation measurements using the Jackknife method. We divide the joint survey region into 1000 subregions which have equal effective area (weighted by galaxy completeness). Then the Jackknife samples are built by discarding one of the subregions each time. The cross correlation is estimated by , where is the number of subregions, is the cross correlation measured from the full survey region and from the th Jackknife sample. This estimator is nearly bias free in general cases. Especially if is only a quadratic function as this case, the defined here will be unbiased. The error of this estimator is given by
| (9) |
where is the average of . To explore the cross talk between different angular bins, we also construct the full covariance matrix for the Jackknife samples,
| (10) |
5. Measurements and implications
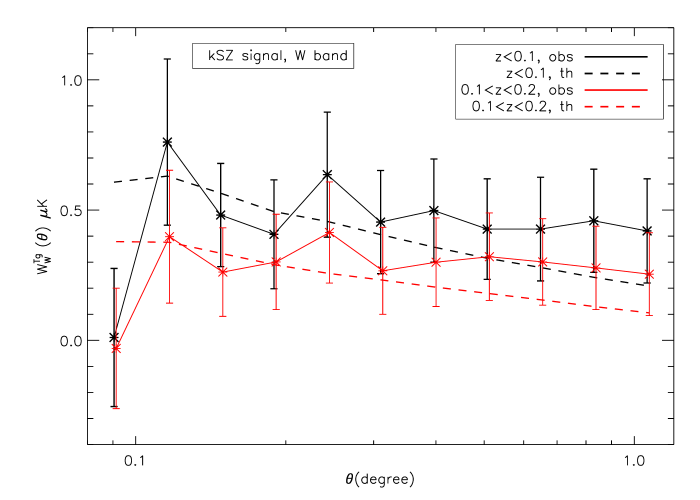
The weighted CMB-galaxy cross correlations are shown in figure 3, for two redshift bins and . The measurement is pretty noisy. Nevertheless, we detect non-zero correlations at for low redshift bin and for high redshift bin.
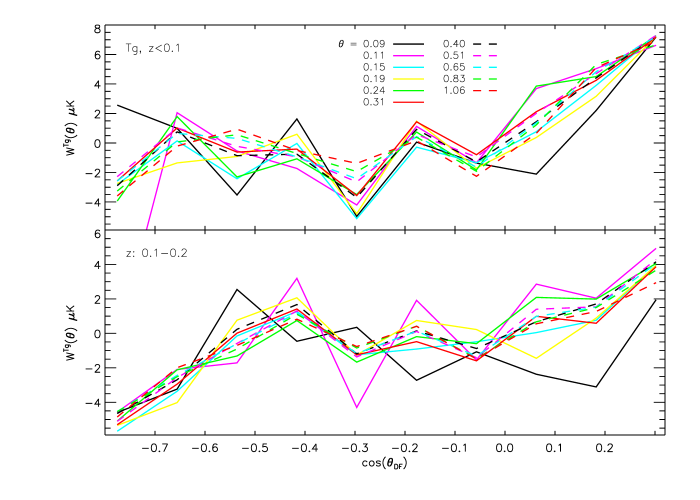
To further quantify the anisotropy of the CMB-galaxy cross correlation, we divide the survey region into 10 subregions according to the value of and then measure in each sub-regions. The results are shown in figure 4. The measured shows significant dependence on , which is consistent with a non-zero signal.
As explained earlier, the ensemble average of the weighted cross correction vanishes for statistically isotropic CMB components and galaxy distributions. Hence the detected non-zero cross correlation may imply either (1) statistical fluke caused by statistical fluctuations in CMB and galaxy distribution, (2) anisotropic and correlated residual contaminations in CMB and galaxy distribution, or (3) the dark flow induced kSZ effect that we are searching for.
5.1. Statistical fluke?
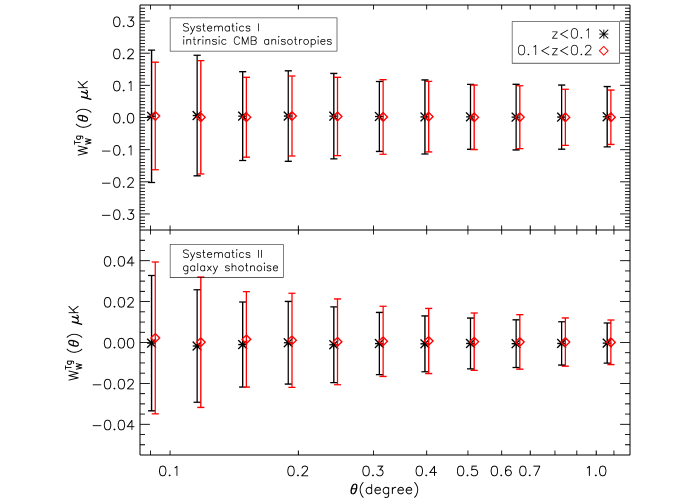
We have performed a number of tests to check whether the detected abnormal anisotropic correlation is caused by statistical fluctuations in the intrinsically isotropic CMB and galaxy distribution. In particular, we pay attention to the intrinsic CMB temperature fluctuations, the galaxy shot noise and the CMB monopole and dipole. These components are uncorrelated with the galaxy distribution. However, they do induce statistical fluctuations to the measured CMB-galaxy cross correlations and can in principle mislead the interpretation of the measurements.
5.1.1 CMB fluctuations: intrinsic and secondaries
Firstly we have generated 1000 simulated CMB temperature maps using the best fit angular power spectrum and the beam function provided by the WMAP team. Then Gaussian distributed white noise are added to each pixel of the map according to the observation times of that pixel. We have not included the 1/f instrumental noise since it has been removed during map-making procedure and it does not correlate with galaxies and hence only contributes statistical errors. The weighted cross correlation are measured for these simulated maps, and the results are shown in the upper panel of figure 5. As expected, the intrinsic CMB anisotropies do not bias our kSZ signal and the errors are consistent with those of Jackknife method.
The CMB secondaries, such as thermal SZ and ISW effect, in principle, are statistically isotropic. So under the designed weighting scheme, they contribute only the statistical error to our cross correlation measurements, rather than bias them. Simple order of magnitude estimation shows that the induced statistical fluctuations are negligible to that of primary CMB. The induced statistical error per multiple bin is . Here, is the corresponding power spectrum of the primary CMB, the thermal SZ effect, the ISW effect, instrumental noise, galaxy number density and galaxy shot noise, respectively. The subscript “” denotes the corresponding quantity under the anisotropic weighting scheme. At angular scales accessible to WMAP, primary CMB is the dominant component and hence contributes most to the statistical error. So for estimating the statistical error of the cross correlation, we can neglect the other components. Nevertheless, to fully consider these effects one needs to simulate the CMB temperature and galaxies simultaneously with cross correlations predicted by the corresponding components. While Cabré et al. (2007) have concluded that within the 10% level, the statistical errors coming from simulated CMB maps with and without cross correlations with galaxies are fully consistent, especially for scales smaller than . This result confirms our estimation. So in this work we just ignore the CMB secondaries in the statistical error estimation.
5.1.2 Galaxy shot noise
Secondly, we examine the galaxy shot noise effect by generating 100 mock galaxy catalogs using the KIAS-VAGC selection function. Each mock catalog has the same number of galaxies as the real one. We have measured the weighted cross correlation for the mock catalogs and the real CMB data. The results are shown in the lower panel of Figure 5. Again, we do not see any bias effect and the errors are small enough to be neglected. We do not attempt to include the intrinsic galaxy clustering effect, since Cabré et al. (2007) have shown that using simulated CMB maps one can get sufficient precision for this kind of cross correlation measurements with low signal-to-noise ratio.
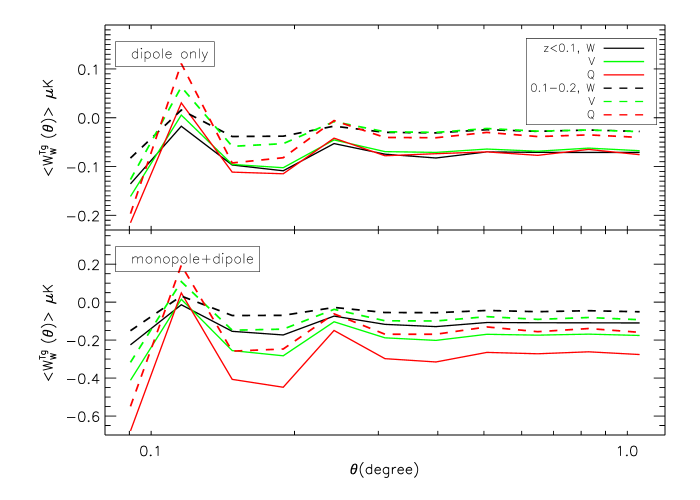
5.1.3 CMB monopole and dipole
The CMB dipole are anisotropic over large angular scales, which could interfere with our searching for dark flow. The CMB monopole has a large amplitude, which may induce large statistical fluctuations in the cross correlation. Hence we remove them in the CMB maps we used. Nevertheless, there could exist residual monopole and dipole, which may contaminate our cross correlation measurement. To test this possibility, we cross correlate the monopole/dipole components of the CMB maps we used with the galaxies. The results for the three WMAP bands are shown in Figure 6. The frequency dependence presented in the figure comes from the difference of dipoles on the maps. For the W band we are focused on, the residual dipole contribution to the weighted cross correlation is less than , so is the residual monopole.
5.2. Systematical errors from residual contaminations
Based on these tests, we conclude that the measured anisotropic correlation is unlikely caused by statistical fluctuations, such as CMB primaries or the even smaller components, TSZ and ISW effects. Rather, it implies either a dark flow induced kSZ effect, or caused by the residual contaminations in WMAP/SDSS.
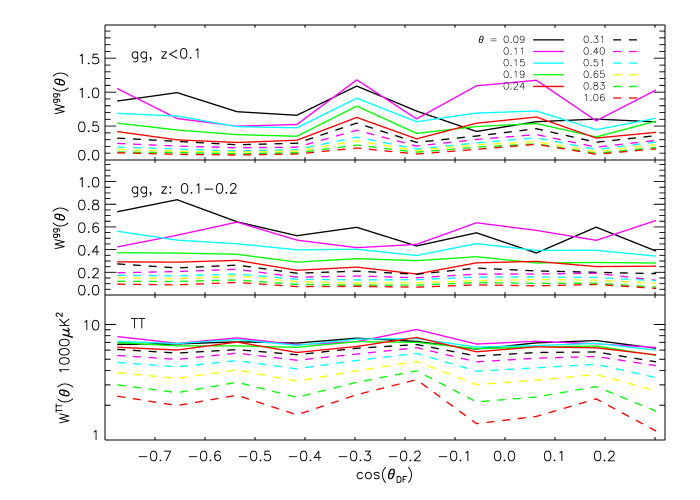
5.2.1 Are CMB intrinsic fluctuations and galaxy distribution isotropic?
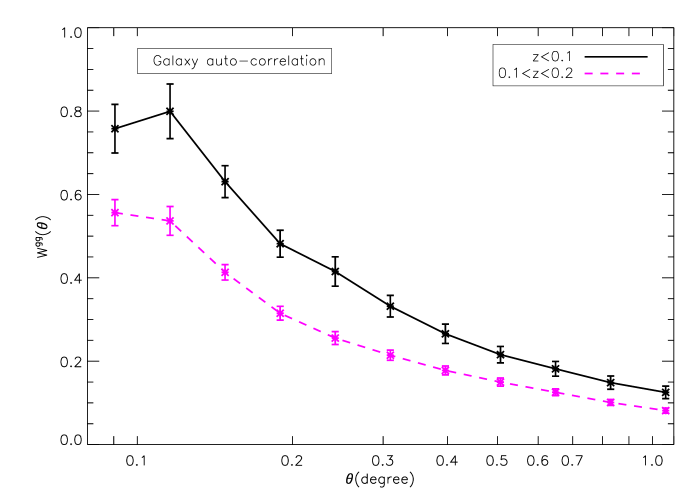
One measure of the residual CMB/galaxy contaminations is the isotropy of CMB and galaxy distribution. We measure the sky-dependence of the galaxy and the CMB temperature auto-correlation in the same subregions. The results are shown in figure 7. None of them show statistically significant sky dependence. This implies that the residual contaminations are well under control and it is unlikely to be the cause of the measured anisotropic cross correlation.
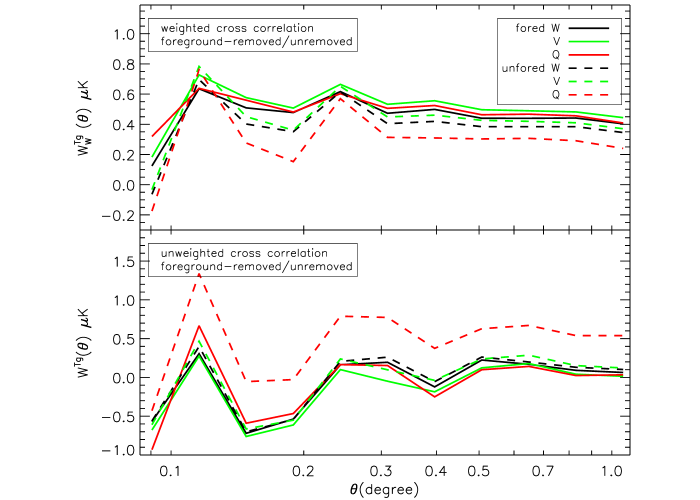
5.2.2 CMB foregrounds
We compared the cross correlation results using the foreground removed CMB maps with the ones which use maps without foreground removal, the results are shown in figure 8. As can be seen from the figure, the high frequency band W and V do not suffer much from the foreground, while the Q band is contaminated badly. After the foreground removal procedure, the frequency dependence is greatly suppressed for both the weighted and unweighted cross correlations, showing that the foreground contamination has been largely cleaned, and its contribution to the cross correlations should be small.
5.3. The dark flow induced kSZ effect?
We find that the observed cross correlation can not be explained by the reported dark flow scenario either, mainly due to two reasons. First, the observed directional dependence does not match the prediction of dark flow. As explained earlier, the dark flow induced kSZ effect predicts a unique relation . However, figure 4 shows that the measured directional dependence is rather complicated and can not be well described by the above relation. Furthermore, a puzzling issue is that over the range , the cross correlations for both redshift bins do follow the dipole pattern. This is also the case for the bin with . Given the noisiness of the measurements, we do not attempt to quantify the statistical significance of these behaviors. Nevertheless, the complicated directional dependence suggests that it unlikely, for the cross correlations we found, comes from a single dark flow.
Second, to match the measurements, the required dark flow amplitude must be much larger than the km/s value reported by Kashlinsky et al. (2010). For quick comparison, in figure 3 we plot the theoretical predictions of kSZ signal coming from dark flow, using method described in section 2. We adopt a value of over redshift range (black dashed line) and over redshift range (red dashed line). A dark flow of such large amplitude is unrealistic, since it would cause the kSZ signal of clusters to be comparable or even dominate over the tSZ signal of keV clusters and contradict existing SZ observation of clusters at low redshifts, especially the measurements at the 217 GHz frequency band (e.g. the Planck intermediate results, Planck Collaboration et al. 2012).
Hence we rule out the possibility of a dark flow as the major source of the observed anomalous anisotropic WMAP-SDSS cross correlation. However, the above results do not rule out a dark flow of much smaller amplitude, such as the km/s dark flow reported by Kashlinsky et al. (2010). Such dark flow would contribute a sub-dominant fraction to the measured cross correlation and hence do not necessarily contradict with the measurements. The low signal-to-noise ratio in our measurement prohibits further investigation. The upcoming Planck project, with better angular resolution and lower instrumental noise, could provide us more information on the true origin of the anomalous anisotropic correlations.
6. Summary
In this paper we report detection of anomalous anisotropic CMB-galaxy cross correlations using KIAS-VAGC galaxy catalog of SDSS-DR7 and WMAP7 CMB data and discuss their implications in the dark flow scenario. We measure this anisotropy using a specially weighted cross correlation, which vanishes for isotropic components. It is detected at 3.5 for redshift bin and 3 for . We measured the sky dependence of the cross correlation. It shows complicated dependence, inconsistent with the dark flow scenario. Also, we find that the measured cross correlation is too large to be caused by the reported km/s dark flow. Improvements in CMB measurement by Planck and improvements in galaxy surveys will help us to significantly improve the cross correlation measurements and better understand the origin of the measured anomalous cross correlation.
Acknowledgments
We thank Yun-Young Choi and Changbom Park for kindly providing the KIAS-VAGC galaxy catalog. We acknowledge the use of the LAMBDA archive (http://lambda. gsfc.nasa.gov). ZL and XC are supported by the National Science Foundation of China (NSFC) under grant No.11073024; XC is supported by the John Templeton Foundation; PJZ is supported by NSFC under grant No. 10821302, 10973027, 11025316, the CAS/SAFEA International Partnership Program for Creative Research Teams (KJCX2-YW-T23) and National Basic Research Program of China (973 Program) under grant No.2009CB24901.
Funding for the SDSS and SDSS-II has been provided by the Alfred P. Sloan Foundation, the Participating Institutions, the National Science Foundation, the U.S. Department of Energy, the National Aeronautics and Space Administration, the Japanese Monbukagakusho, the Max Planck Society, and the Higher Education Funding Council for England. The SDSS Web Site is http://www.sdss.org/.
The SDSS is managed by the Astrophysical Research Consortium for the Participating Institutions. The Participating Institutions are the American Museum of Natural History, Astrophysical Institute Potsdam, University of Basel, Cambridge University, Case Western Reserve University, University of Chicago, Drexel University, Fermilab, the Institute for Advanced Study, the Japan Participation Group, Johns Hopkins University, the Joint Institute for Nuclear Astrophysics, the Kavli Institute for Particle Astrophysics and Cosmology, the Korean Scientist Group, the Chinese Academy of Sciences (LAMOST), Los Alamos National Laboratory, the Max-Planck-Institute for Astronomy (MPIA), the Max-Planck-Institute for Astrophysics (MPA), New Mexico State University, Ohio State University, University of Pittsburgh, University of Portsmouth, Princeton University, the United States Naval Observatory, and the University of Washington.
References
- Abate & Erdoğdu (2009) Abate, A., & Erdoğdu, P. 2009, MNRAS, 400, 1541, 0905.2967
- Bielby et al. (2010) Bielby, R., Shanks, T., Sawangwit, U., Croom, S. M., Ross, N. P., & Wake, D. A. 2010, MNRAS, 403, 1261, 0902.1098
- Blanton et al. (2003a) Blanton, M. R. et al. 2003a, AJ, 125, 2348, arXiv:astro-ph/0205243
- Blanton et al. (2003b) ——. 2003b, ApJ, 592, 819, arXiv:astro-ph/0210215
- Blanton et al. (2005) ——. 2005, AJ, 129, 2562, arXiv:astro-ph/0410166
- Cabré et al. (2006a) Cabré, A., E, G., M, M., P, F., & F, C. 2006a, ArXiv Astrophysics e-prints, arXiv:astro-ph/0611046
- Cabré et al. (2007) Cabré, A., Fosalba, P., Gaztañaga, E., & Manera, M. 2007, MNRAS, 381, 1347, arXiv:astro-ph/0701393
- Cabré et al. (2006b) Cabré, A., Gaztañaga, E., Manera, M., Fosalba, P., & Castander, F. 2006b, MNRAS, 372, L23, arXiv:astro-ph/0603690
- Choi et al. (2010a) Choi, Y., Han, D., & Kim, S. S. 2010a, Journal of Korean Astronomical Society, 43, 191
- Choi et al. (2010b) Choi, Y., Park, C., Kim, J., Gott, J. R., Weinberg, D. H., Vogeley, M. S., Kim, S. S., & for the SDSS Collaboration. 2010b, ApJS, 190, 181, 1005.0256
- Colless et al. (2001) Colless, M. et al. 2001, MNRAS, 328, 1039, arXiv:astro-ph/0106498
- de Vaucouleurs et al. (1995) de Vaucouleurs, G., de Vaucouleurs, A., Corwin, H. G., Buta, R. J., Paturel, G., & Fouque, P. 1995, VizieR Online Data Catalog, 7155, 0
- Delabrouille et al. (2009) Delabrouille, J., Cardoso, J., Le Jeune, M., Betoule, M., Fay, G., & Guilloux, F. 2009, A&A, 493, 835, 0807.0773
- Falco et al. (1999) Falco, E. E. et al. 1999, PASP, 111, 438, arXiv:astro-ph/9904265
- Feldman et al. (2010) Feldman, H. A., Watkins, R., & Hudson, M. J. 2010, MNRAS, 407, 2328, 0911.5516
- Fosalba et al. (2003) Fosalba, P., Gaztañaga, E., & Castander, F. J. 2003, ApJ, 597, L89, arXiv:astro-ph/0307249
- Francis & Peacock (2010) Francis, C. L., & Peacock, J. A. 2010, MNRAS, 406, 2, 0909.2494
- Giannantonio et al. (2006) Giannantonio, T. et al. 2006, Phys. Rev. D, 74, 063520, arXiv:astro-ph/0607572
- Giannantonio et al. (2008) Giannantonio, T., Scranton, R., Crittenden, R. G., Nichol, R. C., Boughn, S. P., Myers, A. D., & Richards, G. T. 2008, Phys. Rev. D, 77, 123520, 0801.4380
- Gold et al. (2011) Gold, B. et al. 2011, ApJS, 192, 15, 1001.4555
- Górski et al. (2005) Górski, K. M., Hivon, E., Banday, A. J., Wandelt, B. D., Hansen, F. K., Reinecke, M., & Bartelmann, M. 2005, ApJ, 622, 759, arXiv:astro-ph/0409513
- Hand et al. (2012) Hand, N. et al. 2012, ArXiv e-prints, 1203.4219
- Hernández-Monteagudo (2010) Hernández-Monteagudo, C. 2010, A&A, 520, A101, 0909.4294
- Hirata et al. (2008) Hirata, C. M., Ho, S., Padmanabhan, N., Seljak, U., & Bahcall, N. A. 2008, Phys. Rev. D, 78, 043520, 0801.0644
- Ho et al. (2008) Ho, S., Hirata, C., Padmanabhan, N., Seljak, U., & Bahcall, N. 2008, Phys. Rev. D, 78, 043519, 0801.0642
- Jing et al. (2006) Jing, Y. P., Zhang, P., Lin, W. P., Gao, L., & Springel, V. 2006, ApJ, 640, L119, arXiv:astro-ph/0512426
- Juszkiewicz et al. (2010) Juszkiewicz, R., Feldman, H. A., Fry, J. N., & Jaffe, A. H. 2010, JCAP, 2, 21, arXiv:astro-ph/0901.0697
- Kashlinsky et al. (2010) Kashlinsky, A., Atrio-Barandela, F., Ebeling, H., Edge, A., & Kocevski, D. 2010, ApJ, 712, L81, 0910.4958
- Kashlinsky et al. (2008) Kashlinsky, A., Atrio-Barandela, F., Kocevski, D., & Ebeling, H. 2008, ApJ, 686, L49, 0809.3734
- Kashlinsky et al. (2009) ——. 2009, ApJ, 691, 1479, 0809.3733
- Li et al. (2012) Li, M. et al. 2012, ArXiv e-prints, 1207.5338
- López-Corredoira et al. (2010) López-Corredoira, M., Sylos Labini, F., & Betancort-Rijo, J. 2010, A&A, 513, A3, 1001.4000
- Ma & Scott (2012) Ma, Y.-Z., & Scott, D. 2012, ArXiv e-prints, 1208.2028
- Macaulay et al. (2011) Macaulay, E., Feldman, H., Ferreira, P. G., Hudson, M. J., & Watkins, R. 2011, MNRAS, 391, 1010.2651
- Mody & Hajian (2012) Mody, K., & Hajian, A. 2012, ArXiv e-prints, 1202.1339
- Nusser & Davis (2011) Nusser, A., & Davis, M. 2011, ArXiv e-prints, 1101.1650
- Osborne et al. (2011) Osborne, S. J., Mak, D. S. Y., Church, S. E., & Pierpaoli, E. 2011, ApJ, 737, 98, 1011.2781
- Pike & Hudson (2005) Pike, R. W., & Hudson, M. J. 2005, ApJ, 635, 11, arXiv:astro-ph/0511012
- Planck Collaboration et al. (2012) Planck Collaboration et al. 2012, ArXiv e-prints, 1207.4061
- Raccanelli et al. (2008) Raccanelli, A., Bonaldi, A., Negrello, M., Matarrese, S., Tormen, G., & de Zotti, G. 2008, MNRAS, 386, 2161, 0802.0084
- Saunders et al. (2000) Saunders, W. et al. 2000, MNRAS, 317, 55, arXiv:astro-ph/0001117
- Sawangwit et al. (2010) Sawangwit, U., Shanks, T., Cannon, R. D., Croom, S. M., Ross, N. P., & Wake, D. A. 2010, MNRAS, 402, 2228, 0911.1352
- Smith et al. (2003) Smith, R. E. et al. 2003, MNRAS, 341, 1311, arXiv:astro-ph/0207664
- Turnbull et al. (2012) Turnbull, S. J., Hudson, M. J., Feldman, H. A., Hicken, M., Kirshner, R. P., & Watkins, R. 2012, MNRAS, 420, 447, 1111.0631
- Watkins et al. (2009) Watkins, R., Feldman, H. A., & Hudson, M. J. 2009, MNRAS, 392, 743, 0809.4041
- Zehavi et al. (2005) Zehavi, I. et al. 2005, ApJ, 630, 1, arXiv:astro-ph/0408569
- Zhang (2010) Zhang, P. 2010, MNRAS, 407, L36, 1004.0990