Molecular gas and dust in the highly magnified galaxy behind the Bullet Cluster
Abstract
Context. The gravitational magnification provided by massive galaxy clusters makes it possible to probe the physical conditions in distant galaxies that are of lower luminosity than those in blank fields and likely more representative of the bulk of the high-redshift galaxy population.
Aims. We aim to constrain the basic properties of molecular gas in a strongly magnified submm galaxy located behind the massive Bullet Cluster (1E 0657-56). This galaxy (SMM J0658) is split into three images, with a total magnification factor of almost 100.
Methods. We used the Australia Telescope Compact Array (ATCA) to search for 12CO(1–0) and 12CO(3–2) line emission from SMM J0658. We also used the SABOCA bolometer camera on the Atacama Pathfinder EXperiment (APEX) telescope to measure the continuum emission at 350 .
Results. CO(1–0) and CO(3–2) are detected at 6.8 and 7.5 significance when the spectra toward the two brightest images of the galaxy are combined. From the CO(1–0) luminosity we derive a mass of cold molecular gas of , using the CO to H2 conversion factor commonly used for luminous infrared galaxies. This is of the stellar mass. From the width of the CO lines we derive a dynamical mass within the CO-emitting region of . We refine the redshift determination of SMM J0658 to . The CO(3–2) to CO(1–0) brightness temperature ratio is , which is similar to the values found in other star-forming galaxies. Continuum emission at 350 from SMM J0658 was detected with SABOCA at a signal-to-noise ratio of 3.6. The flux density is consistent with previous measurements at the same wavelength by the Herschel satellite and BLAST balloon-borne telescope. We study the spectral energy distribution of SMM J0658 and derive a dust temperature of K and a dust mass of .
Conclusions. SMM J0658 is one of the least massive submm galaxies discovered so far. As a likely representative of the bulk of the submm galaxy population, it is a prime target for future observations.
Key Words.:
Submillimeter: galaxies – Infrared: galaxies – Cosmology: observations – Gravitational lensing1 Introduction
Molecular gas is the raw material from which stars form. Determining the amount of molecular material and the physical conditions of the molecular interstellar medium in distant galaxies is important to understand the cosmic history of star-formation and the evolution of galaxies (see reviews by Solomon & Vanden Bout 2005 and Walter et al. 2010). Since the first detection of carbon monoxide in a high-redshift galaxy twenty years ago (IRAS F10214+4724 at ; Brown & Vanden Bout 1991; Solomon et al. 1992), CO and other molecules have been detected in different types of distant galaxies, indicating the presence of significant reservoirs of molecular gas: in Lyman-break galaxies (e.g., Stanway et al. 2008, Riechers et al. 2010), larger amounts (a few times ) in some submillimeter-faint radio-selected starburst galaxies (e.g. Chapman et al. 2008), and even larger amounts (¿ ) in near-infrared–selected star-forming galaxies (e.g., Dannerbauer et al. 2009), submillimeter galaxies (SMGs) (e.g., Greve et al. 2005; Daddi et al. 2009; Ivison et al. 2011), and in quasars and quasi-stellar objects (e.g., Alloin et al. 2007; Coppin et al. 2008). The SMG population contains extreme objects: high-redshift dust-obscured star-forming galaxies with rest-frame far-infrared luminosities larger that 10 and star-formation rate of about 1000 yr-1 (e.g. Smail et al. 1997, Blain et al. 2002).
Whereas the brightest SMGs contribute largely to the star-formation rate in the Universe, they are not representative of the high-redshift SMG population as a whole: number counts indicate a steep increase of the SMG population with decreasing flux density, : the space density of SMGs is about deg-2 for sources with mJy (e.g. Hughes et al. 1998; Chapman et al. 2001; Smail et al. 2002), and it is about ten times larger for galaxies with mJy (e.g. Knudsen et al. 2008). The abundant sub-mJy population is difficult to detect in observations of relatively poor angular resolution () because of confusion noise. Most detections so far were possible because of gravitational lensing by a foreground galaxy or a galaxy cluster, that not only brightens a source but also provides an effective increase in angular resolution, which lowers the confusion limit (e.g. Smail et al. 1997, 2002; Chapman et al. 2002; Knudsen et al. 2005, 2006, 2008; Johansson et al. 2010; Wardlow et al. 2010; Rex et al. 2009; Egami et al. 2010; Johansson et al. 2011). With the Atacama Large Millimeter/Submillimeter Array (ALMA), the Large Millimeter Telescope (LMT) and the Cerro Chajnantor Atacama Telescope (CCAT), the situation will be transformed, making it possible to observe faint sources directly. Until then, observations of highly magnified sources provide a first glimpse into the bulk of the SMG population.
Few sub-mJy SMGs have been discovered so far: there are seven in Knudsen et al. (2008)’s sample, and five in Cowie et al. (2002)’s sample. Smail et al. (2002) estimated number counts down to 0.25 mJy, but the low-end counts were inferred from a Monte Carlo analysis and lower limits on the magnification of several faint sources. To allow detection in a reasonable amount of observing time, the submm flux density (before correcting for magnification) should preferrably be larger than 10 mJy, implying a magnification higher than 10. One SMG that satisfies those criteria is the galaxy at lensed by the massive cluster Abell 2218 (Kneib et al. 2004, Kneib et al. 2005). This source has a total magnification of 45 and an intrinsic submm flux of 0.8 mJy. CO(3–2) was detected in all three images and CO(7–6) in the brightest one, and a gas mass of and a star formation rate of about were inferred (Kneib et al. 2005).
Another sub-mJy SMG is the recently discovered galaxy SMM J065837.6–555705 (hereafter SMM J0658) at situated near the caustic line of the Bullet Cluster (1E 0657-56) at , and magnified about 100 times (Bradač et al. 2006; Wilson et al. 2008; Gonzalez et al. 2009, Gonzalez et al. 2010 (hereafter G10), Johansson et al. 2010). It is the subject of this paper. The galaxy classifies as a Luminous Infrared Galaxy (LIRG), with an intrinsic far-infrared luminosity of a few times 10. The source was also detected by BLAST and Herschel; its infrared spectral energy distribution is consistent with that of a dusty starburst galaxy (Rex et al. 2009, 2010). It is the brightest source in our APEX LABOCA 870 survey of gravitationally lensed submm galaxies (Johansson et al. 2011), in which it was detected with a significance of . When corrected for the gravitational magnification, it appears to be one of the intrinsically faintest submm galaxies detected so far ( mJy). The galaxy is strongly lensed, and three images, A through C, were identified in infrared Spitzer images (Gonzalez et al. 2009, G10). Images A and B are separated by 8″ and have individual magnification factors of and (G10). The third image, C, lies 30″ away from the centroid of images A and B, and its magnification factor is smaller (), making it too faint for detection in the submm and mm observations discussed here. Recently, a faint arc extending between images A and B was discovered in Hubble Space Telescope near-infrared images (G10). G10 also presented the first spectroscopic redshift of SMM J0658, , derived from Polycyclic Aromatic Carbon (PAH) bands. They also reported the detection of two rotational lines of H2, and derived a warm molecular gas mass of , where is the total magnification, and a gas temperature of K.
In this paper, we present the first detections of CO(1–0) and CO(3–2) in SMM J0658. The observations were done with the Australia Telescope Compact Array (ATCA). We use the CO detections to constrain the basic properties of the cold molecular gas in SMM J0658. To complement the existing Herschel observations we also present APEX SABOCA observations of the 350 continuum that we use to quantify the dust properties.
Throughout the paper, we adopt the following cosmological parameters: a Hubble constant km s-1 Mpc-1, a matter density parameter , and a dark energy density parameter . In this cosmology, corresponds to an angular-diameter distance of 1650 Mpc, a luminosity distance of 23800 Mpc and a scale of 8.0 kpc/arcsec111We used Ned Wright’s cosmology calculator (Wright 2006) available at http://www.astro.ucla.edu/~wright/cosmocalc.html..
2 Observations and data reduction
2.1 SABOCA (350 )
We observed SMM J0658 with the Submillimeter APEX Bolometer Camera (SABOCA), a facility instrument operating in the 350 atmospheric window on the Atacama Pathfinder EXperiment (APEX222This publication is based on data acquired with the Atacama Pathfinder EXperiment (APEX). APEX is a collaboration between the Max-Planck-Institut für Radioastronomie, the European Southern Observatory, and the Onsala Space Observatory.) telescope in Chile (Güsten et al. 2006). SABOCA consists of 39 bolometers, has an instantaneous field-of-view of 15, and the main beam has a full width at half maximum (FWHM) of 78 (Siringo et al. 2010).
SMM J0658 was observed in 2010, on June 2nd and 9th and on August 2nd and 5th, as part of observing program O-085.F-9308A. The total observing time was 7.4 hours, out of which approximately 5.4 hours were spent on source and the remaining time was used for calibration scans and pointing. Pointing scans were performed every minutes and the pointing corrections were usually smaller than 2″. Skydips (fast scans in elevation at constant azimuthal angle) were performed at least once during each observing session to estimate the atmospheric opacity. The weather conditions at the time of the observations were good, with a median precipitable water vapor level of 0.46 mm, and standard deviation of 0.05 mm. The derived atmospheric optical depths were between 0.7 and 1.0. SABOCA was used in scanning mode to yield a constant noise level within the central arcminute of the map. In total, 42 scan maps were obtained.
The data were reduced with the Crush software333Crush can be used to reduce data from several instruments, including the APEX bolometer cameras, and can be downloaded from http://www.submm.caltech.edu/~sharc/crush/ (Kovács 2008), following the procedure outlined by Johansson et al. (2009).
2.2 ATCA (3 mm and 7 mm)
We observed SMM J0658 with the Australia Telescope Compact Array (ATCA444The Australia Telescope is funded by the Commonwealth of Australia for operation as a National Facility managed by CSIRO.) in October and November 2010 and in March 2011 with the aim to detect the two rotational lines of carbon monoxide () redshifted within the ATCA frequency coverage: namely, the and lines. For gas at these lines are redshifted into the 7 mm and 3 mm bands. The ATCA Compact Array Broadband Backend (CABB) correlator has two spectral bands with 2 GHz bandwidth each, which can be arranged in various configurations. The correlator was set up in the CFB 1M-0.5k mode yielding 2049 channels each with spectral width 1 MHz. In the 7 mm band, where the CO(1–0) line is redshifted to 30.41 GHz, we centered the band on 30.5 GHz, and covered frequencies between 29.5 and 31.5 GHz. In the 3 mm band the CO(3–2) line is redshifted to 91.23 GHz, and we centered the first band at 91 GHz, covering the range between 90 and 92 GHz. Because ATCA allows for another band to be observed simultaneously, we decided to center it at 93.8 GHz to search for the lines of hydrogen cyanide, HCN, redshifted to 93.53 GHz, and the formyl ion HCO+, redshifted to 94.13 GHz. The rest frequencies of the molecular transitions are listed in Table 6.
| Phase center (J2000): | |
|---|---|
| Right ascension | 06:58:37.62 |
| Declination | 55:57:04.8 |
| 3 mm band | |
| Central observing frequency | 30.5 GHz |
| Configuration | 214H |
| Bandpass calibrator | 1921–293 |
| Phase calibrator | 0537–441 |
| Primary flux calibrator | Uranus |
| Primary beam FWHM | 38″ |
| Synthesized beam111111footnotemark: | 21 17; ° |
| Channel velocity width | 3.3 |
| Final velocity resolution | 80 |
| Noise level222222footnotemark: | 1.6 mJy |
| 7 mm band | |
| Central observing frequency | 91 GHz |
| Configuration | 750A and 750D |
| Bandpass calibrator | 0537–441 |
| Phase calibrator | 0724–47 |
| Primary flux calibrator | Uranus |
| Primary beam FWHM | 110″ |
| Synthesized beam111111footnotemark: | 55 16; ° |
| Channel velocity width | 9.8 |
| Final velocity resolution | 80 |
| Noise level222222footnotemark: | 0.85 mJy |
The 7 mm observations were done on November 11-12, 2010. The array was in the 750A configuration and all six antennas were available. Additional 7 mm observations were carried out on 2011 March 4 and 7, on Director’s Discretionary Time, when the array was in the 750D configuration. The total observing time was hours.
The 3 mm observations were done on October 16-17, 2010, in the H214 array configuration in good weather conditions. On the first day, antenna 4 was taken offline, so most of the observations were done with four antennas. The total observing time was 10 hours.
The parameters of the ATCA observations are summarized in Table 5. The incomplete -coverage of the 7 mm observations results in an elongated beam in the north-south direction (see Table 5, and Figs. 2 and 3).
We used the Miriad software package to reduce the data. We calibrated each day and frequency band separately, using a standard calibration procedure. After initial flagging, the bandpass solution was derived and applied to all sources, followed by gain and flux calibration. The different calibrators we used are listed in Table 5. The data for each band were combined to the final 3 mm and 7 mm -datasets for SMM J0658. Images were obtained by Fourier-transform of these visibility sets, using natural weighting.
At 7 mm we discarded the data from all baselines including the most remote antenna (located 6 km away from the center of the array) because of significant phase noise on those baselines. We also flagged all data during the second half of the first night, when the stability was poor due to rainfall. For the CLEANing procedure, we selected regions around the two images of the galaxy and around a bright point source about 20 arcseconds south of them. This source is discussed in Sect. 3.2.1.
At 3 mm we corrected for the opacity of the atmosphere, phase differences between antennas, and interpolated between the measured system temperatures. Imaging the 3 mm data gave a map without noticeable artefacts and no CLEANing of the 3 mm cube was needed.
3 Results
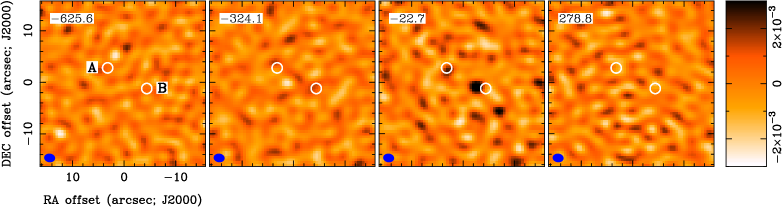
Channel maps at 3 mm (redshifted CO(3–2))
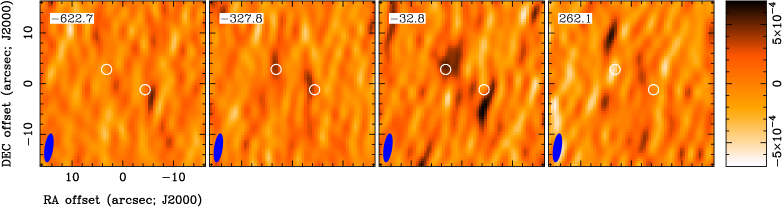
Channel maps at 7 mm (redshifted CO(1–0))
| Image A | Image B | Image A+B | Image A+B | |||
| Line | ……………Integrated flux …………… | Flux B/A | ||||
| [GHz] | [Jy km s-1] | |||||
| 12CO(1–0) | 115.271 | |||||
| 12CO(3–2) | 345.796 | |||||
| HCN(4–3) | 354.460 | … | … | ¡ 0.7 | ¡ 2.7 | … |
| HCO+(4–3) | 356.734 | … | … | ¡ 0.7 | ¡ 2.7 | … |
| CS(7–6) | 342.883 | … | … | ¡ 0.5 | ¡ 2.0 | … |
| Brightness temperature ratios () | ||||||
3.1 350 m continuum
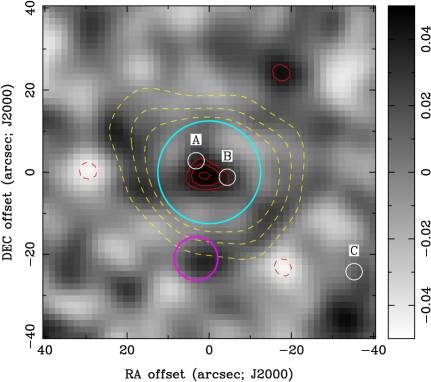
The 350 SABOCA map is shown in Fig. 1, overlaid with contours of the signal-to-noise map. The symbols indicate the location of the infrared counterparts. SMM J0658 is detected at 350 m with a peak signal-to-noise ratio of 3.6. The integrated flux density is mJy, where the uncertainty is the noise level estimated from the data. It does not include the systematic uncertainty in absolute flux calibration, which is (Siringo et al. 2010).
We now compare our measurement to previous detections at 350 . Rex et al. (2010) measured a flux density of mJy, which does not include calibration uncertainties or confusion noise, in the Herschel beam of 25″. The absolute flux calibration for the SPIRE instrument operating at 350 is better than 15% (Griffin et al. 2010). Previously, Rex et al. (2009) had measured a flux density at the same wavelength of mJy with BLAST, for which the absolute flux calibration is better than . The Herschel, BLAST and SABOCA measurements are consistent when calibration uncertainties and confusion noise are taken into account.The SABOCA observations confirm that the emission comes from SMM J0658.
We use the SABOCA and Herschel measurements in the analysis of the spectral energy distribution (Sect. 4.1).
3.2 CO lines
3.2.1 Astrometry of ATCA data
The presence of a bright point-like continuum source in the field of view of the 7 mm data allows us to assess the astrometry of the 7 mm map. The source is located at RA 06:58:37.99, Dec –55:57:25.8, which is 21″ south of SMM J0658, and it is shown in yellow contours in Fig. 3. The elongated 7 mm synthesized beam is shown in the bottom left corner. When the entire 7 mm dataset is collapsed in velocity/frequency the signal-to-noise of this source is around 50. The source is located southeast of a strong radio source detected by Liang et al. (2000) in cm-wave ATCA observations (their source A). Its flux density at 7 mm is mJy, and together with the cm detections we derive a centimeter-to-millimeter spectral index of (), indicative of a radio synchrotron emission mechanism.
The extrapolated continuum flux density in the 3 mm band is 0.3 mJy. This is below the noise level at the edge of the primary beam of the 3 mm map, where the source lies, and it is not detected.
In the HST near-infrared map (see Fig. 3), the radio source has a counterpart in an elliptical galaxy which is a member of the structure at behind the Bullet Cluster (Rex et al. 2010). The near-infrared galaxy is located northeast of the radio source. The offsets between the radio source and the galaxy in Spitzer maps are also . The offsets to the infrared and infrared counterparts of the source implies that the astrometry in our 7 mm map is better than .
In order to remove sidelobe effects from the continuum source, we subtracted it in the Fourier plane using the Miriad task uvlin. Imaging this modified dataset produced an improved CO(1–0) map of SMM J0658.
3.2.2 The CO maps
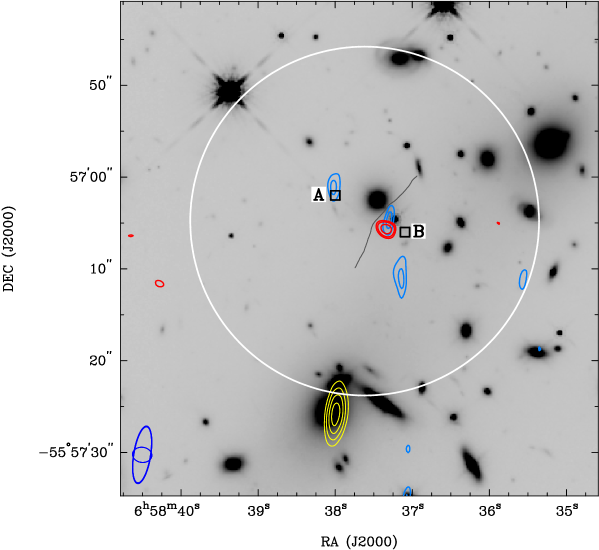
The CO maps are shown in Fig. 2 (channel maps) and Fig. 3 (contours of CO integrated intensity overlaid on an HST image in grayscale).
In the channel maps, which are averaged over , emission near the Spitzer images A and B is best seen in the third panels. In the 3 mm maps, CO(3–2) is detected at image B in the channel centered near 0 . A faint peak is seen near image A. The distance between the two positions is smaller than that between the Spitzer images A and B. In the 7 mm maps, CO(1–0) is detected close to images A and B in the channel centered near 0 and also in the one centered near , although with lower significance. The positions of the CO(1–0) emission are slightly offset to the north and south of the Spitzer images A and B.
We selected the velocity range from to to make images of the integrated CO emission. This is the approximate range from which the CO(3–2) emission originates (see Fig. 4). We measured the integrated intensity of both transitions and both images in the maps, by fitting the sum of two point sources convolved with the synthesized beam in each map at the positions discussed above. Measuring the flux in the extracted spectra instead yield results which agree within . CO(1–0) emission is detected near both Spitzer images. CO(3–2) emission, on the other hand, is clearly detected only near image B.
Continuum emission at 7 mm is seen from the elliptical galaxy to the south. Offsets between the ATCA and Spitzer counterparts of SMM J0658 are discussed in Sect. 4.3.
In Table 6 we list integrated fluxes and luminosities for both CO lines, measured from the integrated images. The relation between integrated flux and line luminosity is
| (1) |
where is the observed (sky) frequency (in GHz) of the spectral line and is the luminosity distance (in Mpc) (Solomon & Vanden Bout 2005). The dependence on the magnification value is explicitly included. The CO line luminosities derived from this equation are expressed in units of K pc2.
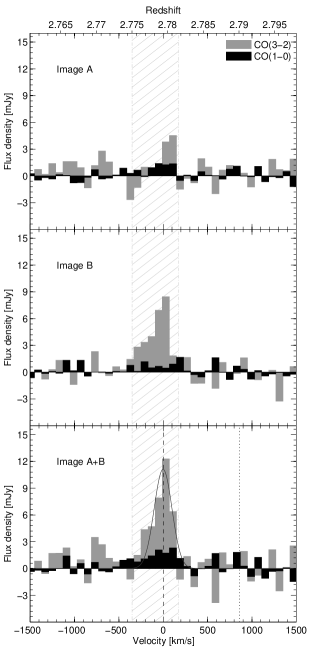
3.2.3 The CO spectra
The spectra extracted from the positions of images A and B discussed in the previous section are displayed in Fig. 4. In the two upper panels we show the spectra from the CO(3–2) and CO(1–0) transitions toward both images. Assuming that the spectra toward images A and B originate from the same galaxy, we can increase the signal-to-noise ratio of the detections by simply adding the spectra toward the two images. The total CO(1–0) and CO(3–2) spectra are shown in the lowest panel of Fig. 4.
In the combined spectra (image A + B), CO(3–2) is detected at significance, and CO(1–0) is detected at significance.
We used the CO(3–2) spectrum combined for images A and B to determine the redshift of the galaxy and measure the linewidth by fitting a single Gaussian. We derived a redshift . This value is consistent with the CO(1–0) detection, and slightly lower than the value measured by G10 (see Fig. 4). This value is adopted in all -dependent results.
The resulting Gaussian has a velocity width of . The fit is adequate, with a reduced of 1.2 and a probability to exceed of 20%. The linewidth is used to estimate the dynamical mass in Sect. 4.2.
A brightness temperature ratio is found between the CO(3–2) and CO(1–0) lines. This is within the range of values found in those star-forming galaxies where both CO lines have been observed. In a sample of 49 local LIRGs, Leech et al. (2010) found a median brightness temperature ratio , and ranging between . Few high-redshift galaxies have been detected in both the CO(1–0) and CO(3–2) line; this is because observation of the CO(1–0) line in the redshift range has become possible only recently, with the Expanded Very Large Array (e.g. Ivison et al. 2011), the CABB correlator of the ATCA, or the Z-receiver at the Green Bank Telescope. In those SMGs where both CO(1–0) and CO(3–2) have been detected, -values are similar to that derived for SMM J0658. Swinbank et al. (2010) reported in the lensed SMG SMMJ2135-0102 at and Harris et al. (2010) found in a sample of three SMGs at . Ivison et al. (2011) found in four SMGs at . Observations of additional rotational transitions of CO are required to further constrain the excitation conditions in SMM J0658.
3.3 On the non-detection of dense gas tracers
The large bandwidth of the ATCA correlator provides coverage of other interesting molecular lines (HCN(4–3), HCO+(4–3) and CS(7–6)), and upper limits on their integrated fluxes and luminosities are given in Table 6. These molecules have larger critical densities than CO, and trace denser gas. The flux ratio between CO(3–2) and HCO+(4–3) is in the Cloverleaf quasar (Weiß et al. 2003; Riechers et al. 2011). In their study of the lensed SMG SMMJ2135-0102, Danielson et al. (2010) detected HCN(3–2), and found a flux density ratio of compared to CO(3–2). Their non-detections of HCO+(4–3) and CS(7–6) also indicated flux ratios compared with CO(3–2). This is similar to our limits on the ratios between CO(3–2) and HCN, HCO+ and CS, and thus our non-detections are not surprising.
4 Discussion
4.1 Dust properties
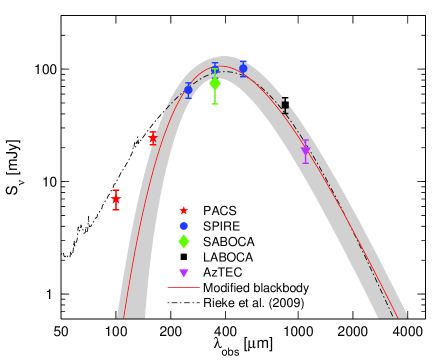
The FIR/submm continuum emission of SMM J0658 has been thoroughly studied and it is established that SMM J0658 is a LIRG with a far-infrared luminosity . (Wilson et al. 2008; Rex et al. 2009; Johansson et al. 2010; Rex et al. 2010; Pérez-González et al. 2010). From the continuum data that include our SABOCA 350 m measurement and the LABOCA 870 m measurement of Johansson et al. 2010 we constructed the FIR/submm spectral energy distribution (SED) displayed in Fig. 5.
Rex et al. (2009) used the continuum data measured by BLAST and AzTEC to estimate a dust temperature in SMM J0658 of 32 K. In the analysis of the more sensitive observations by the SPIRE and PACS instrument on the Herschel satellite, Rex et al. (2010) fitted SED models but did not derive a dust temperature. To calculate the dust temperature we therefore fitted a modified blackbody curve to the SED, following the approach in Rex et al. (2009). We adopted the following functional form of the SED
| (2) |
where is the flux density, the amplitude, the frequency, and is the Planck function. We fitted the model to the data using a minimization routine, keeping fixed at 1.5. The best-fit curve is shown in Fig. 5 together with the 95% confidence interval, and it corresponds to a dust temperature of K. Changing between 1 and 2 results in changes in the derived dust temperature that are smaller than the confidence interval.
A more elaborate model must be used to fit the full SED, as the PACS data points fall outside the best-fit curve; however, our aim is not to accurately model the dust SED, but to derive a lower limit to the dust temperature. A second hotter dust component within the ISM of SMM J0658 could give rise to an excess power at wavelengths below 100 (the detection of hot molecular gas with K (G10) indicates the possibility of a hot dust component in SMM J0658). Rex et al. (2010) used the LIRG templates of Rieke et al. (2009) to model the far-infrared/submm SED in SMM J0658. In Fig. 5 we show for reference the Rieke et al. template for a corresponding total far-infrared luminosity of , magnified by a factor , which fits the observed data better on the Wien side of the spectrum.
We can also use the Rieke et al. template to calculate the estimated continuum flux density for SMM J0658 in the two ATCA bands. The expected flux densities are mJy in the 3 mm band and Jy in the 7 mm band. This is below our detection limits and is consistent with our non-detection.
From the SED we also estimate the total mass of cold dust in SMM J0658. Following Papadopoulos et al. (2000), we calculate the dust mass from
| (3) |
where is the rest frequency of the observed 870 emission, is the 870 flux density, and is the dust emissivity function. As in the SED fitting, we used . Together with the dust temperature derived above and K the dust mass is , where the uncertainties are due to the uncertainty in the dust temperature. The systematic uncertainty in the normalization and shape of the dust emissivity function is not included. However, it is considerable and likely overshadows the uncertainties in the dust temperature.
4.2 Molecular and dynamical mass
In this section we estimate the molecular gas mass and the dynamical mass using the luminosity of the CO lines and their linewidth.
Using CO as a tracer of the more abundant H2 molecule is the main method to infer the total molecular mass in a molecular cloud or an entire galaxy (e.g. Dickman, Snell, & Schloerb 1986). The relation between CO luminosity and molecular mass is then , where the constant of proportionality, , is for the line in Galactic giant molecular clouds or nearby disk galaxies. For starburst galaxies (LIRGs and ULIRGs) is considerably lower (, Solomon et al. 1997). The main reason for the difference is that in disk galaxies the molecular gas is distributed in individual virialized molecular clouds, whereas in the centers of starburst galaxies the CO emission originates from an extended medium and the CO linewidths are determined by the total dynamical mass in the region (Maloney & Black 1988; Solomon & Vanden Bout 2005). For a recent discussion of the influence of the physical conditions of the interstellar medium on the CO-to-H2 conversion factor in luminous IR galaxies see, for instance, Papadopoulos et al. (2011), Papadopoulos et al. (2012).
Adopting , and using the luminosity of the combined CO(1–0) line displayed in Table 6, we find a gas mas of , where the uncertainties are and represent only the statistical uncertainty in the CO luminosity, not the systematic uncertainty in the value of , which most likely dominates. Using instead, as is appropriate for the Milky Way (e.g. Strong et al. 1988), nearby spiral galaxies (e.g. Maloney & Black 1988), and which has also been found in BzK-galaxies (Daddi et al. 2010), for SMM J0658, the total gass mass is considerably larger, . Even with the latter value, SMM J0658 is a LIRG with low CO emission and a low gas mass, when compared to intrisically brighter submm galaxies.
The dynamical mass can be estimated, assuming again that the CO line originates from an extended medium whose dynamics depend on the total enclosed mass, from
| (4) |
(e.g. Solomon & Vanden Bout 2005), where is the size of the region where the CO emission originates from, is the full width at half maximum of the CO line, and G is Newton’s constant.
Due to the moderate signal-to-noise ratio in our data, we refrain from estimating the size of the CO emitting region. However common values adopted for SMGs in the literature are kpc (e.g. Kneib et al. 2005; Danielson et al. 2010). Using the linewidth of the CO(3–2) line, the dynamical mass is then . Uncertainties are due to the uncertainty in the linewidth and do not include systematic uncertainties, which most likely dominate. Note that the dynamical mass is to first order independent of the gravitational magnification.
The properties of SMM J0658 are compared with those of other star-forming galaxies in Sect. 4.4.
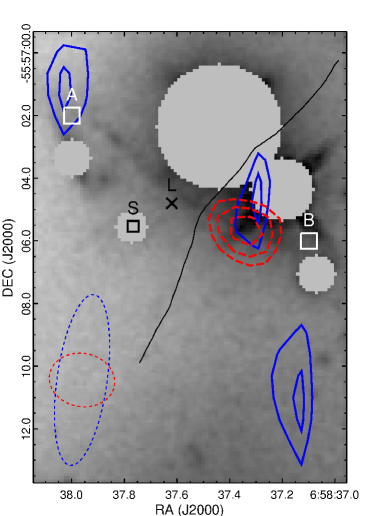
4.3 Positional offsets
Offsets of a few arcseconds are seen between the positions of the CO detections and those of the two Spitzer images of SMM J0658, image A and image B. Those offsets are listed in Table 9, and are best seen in Fig. 6, which shows the HST WFC3 map of SMM J0658 in grey-scale777Proposal identifier 11099, principal investigator M. Bradač; (G10).. To reveal the faint arc between the two Spitzer images, we subtracted a model of the foreground elliptical galaxy using the Galfit code (Peng et al. 2010). We masked out other bright objects near SMM J0658. The positions of the centroids of the SABOCA and LABOCA detections are shown. Their offset is within the uncertainties of the observations.888The positional accuracy when fitting two-dimensional Gaussians to sources superimposed on uncorrelated Gaussian noise can be written (Condon 1997; Ivison et al. 2007). The accuracy in the fit for the SABOCA and LABOCA detections is thus 2″ and respectively. The pointing accuracy of both instruments is 2″ in azimuth and 4″ in elevation (Siringo et al. 2009, 2010).
Contours of the integrated intensity images of CO(3–2) and CO(1–0) are also overlaid. No contour for the CO(3–2) signal close to image A is drawn because of the low significance of the detection. The CO(3–2) detection appears about 2′′ to the east of the Spitzer western image (image B). The CO(1–0) detection, on the other hand, peaks about 5′′ to the south of image B. The CO(1–0) is therefore shifted relative to the CO(3–2) by about 1.5′′ in RA and 5′′ in declination. Concerning image A, a smaller offset of about is seen between the CO(1–0) and the faint CO(3–2) detections. There, the CO(1–0) seems to be shifted to the north of image A.
The positional accuracy of our CO(1–0) map has been checked using the position of the bright radio source 21″ south of SMM J0658, as described in Sect 3.2.1; it agrees within one arcsecond with the position measured by Liang et al. (2000) in cm-wave ATCA observations and also with the Spitzer and HST positions.
Clearly, deeper maps are needed to determine whether the observed offsets in SMM J0658 are real or due to a combination of pointing uncertainties, low signal-to-noise ratio, and the elongated CO(1–0) beam.
| Reference | |||
|---|---|---|---|
| LABOCA (870 ) | 0.0 | 0.0 | 1 |
| SABOCA (350 )+ | 2 | ||
| CO(1–0) (Image A)⋆ | 2 | ||
| CO(1–0) (Image B)⋆ | 2 | ||
| CO(3–2) (Image A) | 2 | ||
| CO(3–2) (Image B) | 2 | ||
| IRAC (Image A)⋆⋆ | 3.2 | 2.8 | 3 |
| IRAC (Image B)⋆⋆ | 4.4 | 1.2 | 3 |
+ The first uncertainties come from the Gaussian fit and the second uncertainties are the pointing uncertainties.
⋆ We compared the astrometry of the CO(1–0) map to that of the HST image by measuring the position of the elliptical galaxy located 21″ south of SMM J0658. They agree within 1″.
⋆⋆ The positions were taken from Gonzalez et al. (2009) who don’t quote any uncertainties.
References: 1 – Johansson et al. (2010). 2 – This work. 3 – Gonzalez et al. (2009).
4.4 Physical parameters and comparison with other galaxies
Let us compare the properties of SMM J0658 with those of other galaxies, in particular the sub-mJy galaxy at (SMM J16359+6612) studied by Kneib et al. (2005) and the brighter lensed galaxy at (SMM J2135-0102) studied by Swinbank et al. (2010) and Danielson et al. (2010). Those are highly magnified galaxies with several similarities with SMM J0658.
Derived parameters for SMM J0658 and the two other galaxies are listed in Table 4.4. The intrinsic submm flux density of SMM J0658 is about 60% that of the galaxy and times lower than that of the galaxy. The ratios of the far-infrared luminosities are slightly different: the galaxy is times more luminous, and the galaxy is times more luminous. As expected, the amount of molecular gas in SMM J0658 is lower than in the two other galaxies. Interestingly, the star formation efficiency is comparable to that in the ULIRG at . The dust mass in SMM J2135-0102 is an order of magnitude larger than that in the two other galaxies. However, the gas to dust mass ratio, is for SMM J0658, for SMM J16359+6612 and for SMM J2135-0102. Given the large systematic uncertainties in determination of the gas and dust mass, no trends can be identified from the gas to dust ratios.
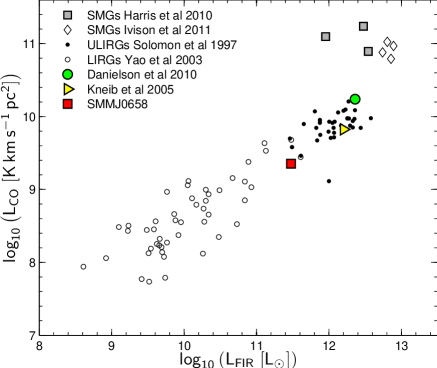
How does SMM J0658 compare with larger samples of local and high-redshift LIRGs and ULIRGs? In Figure 7 we show the CO-line luminosity versus the far-infrared luminosity for the three galaxies discussed above, and for the nearby luminous infrared galaxies of Yao et al. (2003) and Solomon et al. (1997) and the bright high-redshift submm galaxies of Ivison et al. (2011) and Harris et al. (2010) SMM J0658 falls on the general correlation and is the least FIR-luminous high-redshift galaxy in the diagram.
What is the possible duration of its starburst phase in SMM J0658? The star formation rate derived from the far-infrared SED is 100150 (G10). The molecular gas mass divided by the star formation rate () provides a measure of the possible duration of the starburst phase, or at least for how long the starburst phase can last at the current star formation rate and the current reservoir of molecular gas to form stars from. For SMM J0658 this ratio is 15 to 20 Myr. Note that the starburst duration is independent of the magnification factor. G10 fitted stellar population models to the near-infrared SED of SMM J0658 and found that models with a stellar population age Myr or between 1.4 Gyr and 2.6 Gyr give the best fit to the data. They noted however that the large submm flux density is a strong argument for the lower age, an argument which is strengthened by the starburst duration calculated here.
One can estimate the gas mass fraction, , from the gas mass derived from the CO lines and the stellar mass derived from near-infrared measurements. G10 gave and noted that systematic uncertainties can be a factor of 2 or larger, which makes them the largest source of uncertainty on the stellar mass. The influence of systematic uncertainties on derived stellar masses for near-infrared SEDs is discussed by Conroy et al. (2009). depends of course on the adopted value of the CO-to-H2 conversion factor, . For (as in local ULIRGs), in SMM J0658 would be . For (as in the Milky Way or in nearby spirals, see Sect. 4.2), . Note that the uncertainties on the gas mass fractions derived here do not include the systematic uncertainty in the stellar mass determination. The fact that such a large fraction of the molecular gas has not yet been converted into stars is another argument in favor of a young system. Such high gas mass fractions are typical for high-redshift systems: Tacconi et al. (2010) found in a sample of galaxies around . Despite the uncertainty in the adopted value of , the gas mass fraction in SMM J0658 is large compared with local galaxies: for comparison, the gas fraction in a sample of local spiral galaxies is (Leroy et al. 2005).
| Source | SMM J0658 | SMM J16359+6612 | SMM J21350102 |
|---|---|---|---|
| (1) | (2) | (3) | |
| Redshift | 2.7793 | 2.5174 | 2.3259 |
| Magnification | |||
| Submm flux density (mJy) | 0.5 | 0.8a𝑎aa𝑎aF | |
| – | |||
| b𝑏bb𝑏b | |||
| c𝑐cc𝑐cR | |||
| 100 – 150 | |||
| d𝑑dd𝑑dS | 170 | ||
| e𝑒ee𝑒eD |
(1) This work.
(2) Kneib et al. (2004, 2005).
(3) Danielson et al. (2010).
5 Conclusions
This paper presents a study of the molecular gas and dust in one of the least massive high-redshift galaxies observed so far, the submm galaxy SMM J0658 lensed by the Bullet Cluster.
-
•
We detected for the first time rotational transitions of CO from SMM J0658. The CO(1–0) to CO(3–2) brightness temperature ratio is comparable to that observed in other high-redshift star-forming galaxies.
-
•
We revise the redshift estimated by Gonzalez et al. (2010) from to .
-
•
The mass of cold molecular gas is estimated to be between and of the total baryonic mass.
-
•
From the linewidths of the CO(3–2) transition we derive a dynamical mass of , for a CO-emitting disk with a physical size of 1 kpc.
- •
-
•
Using ground-based 350 imaging we detected continuum radiation from SMM J0658. The signal-to-noise ratio is only 3.6, but the detection makes it possible to confirm that the emission previously seen in the larger beams of BLAST and Herschel (Rex et al. 2009, Rex et al. 2010) comes from SMM J0658. The value of the flux density measured by SABOCA is consistent with the Herschel and BLAST values.
-
•
Owing to the extremely high magnification, this galaxy is a target of choice for further studies of the properties of intrinsically faint high-redshift galaxies, for example with ALMA.
Acknowledgements.
We thank Anthony Gonzalez and collaborators for providing us with the WFC3 data displayed in Figures 3 and 6, and Padelis Papadopoulos for useful comments. We thank the ATCA Head of Science Operations Phil Edwards for allocating Director’s Discretionary Time in March 2011. We thank the anonymous referee for his/her comments that helped to improve the manuscript.References
- Alloin et al. (2007) Alloin, D., Kneib, J., Guilloteau, S., & Bremer, M. 2007, A&A, 470, 53
- Blain et al. (2002) Blain, A. W., Smail, I., Ivison, R. J., Kneib, J.-P., & Frayer, D. T. 2002, Phys. Rep, 369, 111
- Bradač et al. (2006) Bradač, M., Clowe, D., Gonzalez, A. H., et al. 2006, ApJ, 652, 937
- Brown & Vanden Bout (1991) Brown, R. L. & Vanden Bout, P. A. 1991, AJ, 102, 1956
- Chapman et al. (2008) Chapman, S. C., Neri, R., Bertoldi, F., et al. 2008, ApJ, 689, 889
- Chapman et al. (2001) Chapman, S. C., Richards, E. A., Lewis, G. F., Wilson, G., & Barger, A. J. 2001, ApJ, 548, L147
- Chapman et al. (2002) Chapman, S. C., Smail, I., Ivison, R. J., & Blain, A. W. 2002, MNRAS, 335, L17
- Condon (1997) Condon, J. J. 1997, PASP, 109, 166
- Conroy et al. (2009) Conroy, C., Gunn, J. E., & White, M. 2009, ApJ, 699, 486
- Coppin et al. (2008) Coppin, K. E. K., Swinbank, A. M., Neri, R., et al. 2008, MNRAS, 389, 45
- Cowie et al. (2002) Cowie, L. L., Barger, A. J., & Kneib, J.-P. 2002, AJ, 123, 2197
- Daddi et al. (2010) Daddi, E., Bournaud, F., Walter, F., et al. 2010, ApJ, 713, 686
- Daddi et al. (2009) Daddi, E., Dannerbauer, H., Stern, D., et al. 2009, ApJ, 694, 1517
- Danielson et al. (2010) Danielson, A. L. R., Swinbank, A. M., Smail, I., et al. 2010, MNRAS, 1565
- Dannerbauer et al. (2009) Dannerbauer, H., Daddi, E., Riechers, D. A., et al. 2009, ApJ, 698, L178
- Dickman et al. (1986) Dickman, R. L., Snell, R. L., & Schloerb, F. P. 1986, ApJ, 309, 326
- Egami et al. (2010) Egami, E., Rex, M., Rawle, T. D., et al. 2010, A&A, 518, L12
- Gonzalez et al. (2009) Gonzalez, A. H., Clowe, D., Bradač, M., et al. 2009, ApJ, 691, 525
- Gonzalez et al. (2010) Gonzalez, A. H., Papovich, C., Bradač, M., & Jones, C. 2010, ApJ, 720, 245
- Greve et al. (2005) Greve, T. R., Bertoldi, F., Smail, I., et al. 2005, MNRAS, 359, 1165
- Griffin et al. (2010) Griffin, M. J., Abergel, A., Abreu, A., et al. 2010, A&A, 518, L3+
- Güsten et al. (2006) Güsten, R., Nyman, L. Å., Schilke, P., et al. 2006, A&A, 454, L13
- Harris et al. (2010) Harris, A. I., Baker, A. J., Zonak, S. G., et al. 2010, ApJ, 723, 1139
- Hughes et al. (1998) Hughes, D. H., Serjeant, S., Dunlop, J., et al. 1998, Nature, 394, 241
- Ivison et al. (2007) Ivison, R. J., Greve, T. R., Dunlop, J. S., et al. 2007, MNRAS, 380, 199
- Ivison et al. (2011) Ivison, R. J., Papadopoulos, P. P., Smail, I., et al. 2011, MNRAS, 412, 1913
- Johansson et al. (2010) Johansson, D., Horellou, C., Sommer, M. W., et al. 2010, A&A, 514, A77
- Johansson et al. (2011) Johansson, D., Sigurdarson, H., & Horellou, C. 2011, A&A, 527, A117
- Kneib et al. (2005) Kneib, J.-P., Neri, R., Smail, I., et al. 2005, A&A, 434, 819
- Kneib et al. (2004) Kneib, J.-P., van der Werf, P. P., Kraiberg Knudsen, K., et al. 2004, MNRAS, 349, 1211
- Knudsen et al. (2006) Knudsen, K. K., Barnard, V. E., van der Werf, P. P., et al. 2006, MNRAS, 368, 487
- Knudsen et al. (2005) Knudsen, K. K., van der Werf, P., Franx, M., et al. 2005, ApJ, 632, L9
- Knudsen et al. (2008) Knudsen, K. K., van der Werf, P. P., & Kneib, J.-P. 2008, MNRAS, 384, 1611
- Kovács (2008) Kovács, A. 2008, in Presented at the Society of Photo-Optical Instrumentation Engineers (SPIE) Conference, Vol. 7020, Society of Photo-Optical Instrumentation Engineers (SPIE) Conference Series
- Leech et al. (2010) Leech, J., Isaak, K. G., Papadopoulos, P. P., Gao, Y., & Davis, G. R. 2010, MNRAS, 406, 1364
- Leroy et al. (2005) Leroy, A., Bolatto, A. D., Simon, J. D., & Blitz, L. 2005, ApJ, 625, 763
- Liang et al. (2000) Liang, H., Hunstead, R. W., Birkinshaw, M., & Andreani, P. 2000, ApJ, 544, 686
- Maloney & Black (1988) Maloney, P. & Black, J. H. 1988, ApJ, 325, 389
- Papadopoulos et al. (2000) Papadopoulos, P. P., Röttgering, H. J. A., van der Werf, P. P., et al. 2000, ApJ, 528, 626
- Papadopoulos et al. (2012) Papadopoulos, P. P., van der Werf, P., Xilouris, E., Isaak, K. G., & Gao, Y. 2012, ArXiv e-prints
- Papadopoulos et al. (2011) Papadopoulos, P. P., van der Werf, P., Xilouris, E. M., et al. 2011, ArXiv e-prints
- Peng et al. (2010) Peng, C. Y., Ho, L. C., Impey, C. D., & Rix, H. 2010, AJ, 139, 2097
- Pérez-González et al. (2010) Pérez-González, P. G., Egami, E., Rex, M., et al. 2010, A&A, 518, L15+
- Rex et al. (2009) Rex, M., Ade, P. A. R., Aretxaga, I., et al. 2009, ApJ, 703, 348
- Rex et al. (2010) Rex, M., Rawle, T. D., Egami, E., et al. 2010, A&A, 518, L13+
- Riechers et al. (2010) Riechers, D. A., Carilli, C. L., Walter, F., & Momjian, E. 2010, ApJ, 724, L153
- Riechers et al. (2011) Riechers, D. A., Walter, F., Carilli, C. L., et al. 2011, ApJ, 726, 50
- Rieke et al. (2009) Rieke, G. H., Alonso-Herrero, A., Weiner, B. J., et al. 2009, ApJ, 692, 556
- Siringo et al. (2010) Siringo, G., Kreysa, E., De Breuck, C., et al. 2010, The Messenger, 139, 20
- Siringo et al. (2009) Siringo, G., Kreysa, E., Kovács, A., et al. 2009, A&A, 497, 945
- Smail et al. (1997) Smail, I., Ivison, R. J., & Blain, A. W. 1997, ApJ, 490, L5+
- Smail et al. (2002) Smail, I., Ivison, R. J., Blain, A. W., & Kneib, J.-P. 2002, MNRAS, 331, 495
- Solomon et al. (1997) Solomon, P. M., Downes, D., Radford, S. J. E., & Barrett, J. W. 1997, ApJ, 478, 144
- Solomon et al. (1992) Solomon, P. M., Radford, S. J. E., & Downes, D. 1992, Nature, 356, 318
- Solomon & Vanden Bout (2005) Solomon, P. M. & Vanden Bout, P. A. 2005, ARA&A, 43, 677
- Stanway et al. (2008) Stanway, E. R., Bremer, M. N., Davies, L. J. M., et al. 2008, ApJ, 687, L1
- Strong et al. (1988) Strong, A. W., Bloemen, J. B. G. M., Dame, T. M., et al. 1988, A&A, 207, 1
- Swinbank et al. (2010) Swinbank, A. M., Smail, I., Longmore, S., et al. 2010, Nature, 464, 733
- Tacconi et al. (2010) Tacconi, L. J., Genzel, R., Neri, R., et al. 2010, Nature, 463, 781
- Walter et al. (2010) Walter, F., Carilli, C., & Daddi, E. 2010, Molecular Gas at High Redshift (Wiley-VCH Verlag GmbH & Co. KGaA), 167–177
- Wardlow et al. (2010) Wardlow, J. L., Smail, I., Wilson, G. W., et al. 2010, MNRAS, 401, 2299
- Weiß et al. (2003) Weiß, A., Henkel, C., Downes, D., & Walter, F. 2003, A&A, 409, L41
- Wilson et al. (2008) Wilson, G. W., Hughes, D. H., Aretxaga, I., et al. 2008, MNRAS, 390, 1061
- Wright (2006) Wright, E. L. 2006, PASP, 118, 1711
- Yao et al. (2003) Yao, L., Seaquist, E. R., Kuno, N., & Dunne, L. 2003, ApJ, 588, 771