Galaxy cluster outskirts: a universal entropy profile for relaxed clusters?
Abstract
We fit a functional form for a universal ICM entropy profile to the scaled entropy profiles of a catalogue of X-ray galaxy cluster outskirts results, which are all relaxed cool core clusters at redshift below 0.25. We also investigate the functional form suggested by Lapi et al. and Cavaliere et al. for the behaviour of the entropy profile in the outskirts and find it to fit the data well outside 0.3. We highlight the discrepancy in the entropy profile behaviour in the outskirts between observations and the numerical simulations of Burns et al., and show that the entropy profile flattening due to gas clumping calculated by Nagai & Lau is insufficient to match observations, suggesting that gas clumping alone cannot be responsible for all of the entropy profile flattening in the cluster outskirts. The entropy profiles found with Suzaku are found to be consistent with ROSAT, XMM-Newton and Planck results.
keywords:
X-rays: galaxies: clusters – galaxies: clusters: general1 Introduction
A breakthrough in the study of the low surface brightness X-ray emission from the intracluster medium (ICM) in the outskirts of galaxy clusters has been made possible by the low and stable particle background of Suzaku, and a statistical sample of clusters studied to 111 is the radius within which the mean mass density is 200 times the critical density for a flat universe. has started to emerge (see table 1). All of these are relaxed cool core clusters with redshifts of less than 0.25. Since these clusters have been chosen because they are very X-ray bright, they do not provide a representative sample of the actual cluster population, but nonetheless general trends have started to emerge. Understanding the thermodynamic properties of clusters in the outskirts is important for constraining the physical processes occurring in the ICM. We also need to understand the radius at which the hydrostatic equilibrium approximation breaks down, and the contributions of non-thermal pressure support which are expected to increase in the outskirts (Lau et al., 2009) in order to calculate accurate masses out to and beyond.
One of the interesting findings from studies of the outskirts of galaxy clusters is that the scaled ICM entropy () profile has a similar shape for each cluster, flattening off above away from a powerlaw increase. The entropy profile is of fundamental importance because it both determines the structure of the ICM and provides a record of the thermodynamic history of the ICM. As described in Voit et al. (2005), the entropy is more representative of the thermodynamic history of the ICM than temperature because when heated gas expands in a gravitational potential its thermal energy can be converted into gravitational potential energy. Introducing heat will always cause the entropy to rise while losing heat through radiative cooling will always cause the entropy to fall, whereas it is possible for the luminosity-weighted temperature to rise only slightly on the input of a large amount of energy, making it a less sensitive probe of ICM history (Voit et al., 2002).
Here we compile a sample based on the papers summarised in table 1, and fit an analytic function to the scaled entropy profiles. In addition to the clusters studied with Suzaku, we also add Abell 1835 and Abell 2204 which have been studied with Chandra out to and 0.7 respectively. We also add the Virgo cluster which has been studied with XMM-Newton out to along one narrow strip. We do not include the clusters studied with Suzaku in the outskirts described in Akamatsu & Kawahara (2011) as these observations are aligned specifically with radio relics, and so are not representative of the ICM of the whole cluster. Compiling a sample like this reduces the effect of the small azimuthal coverage of some of the observations, allowing a more realistic average to be obtained which reduces the bias of looking along particular directions in a cluster which may not be representative of the cluster as a whole. For instance Eckert et al. (2012) has used ROSAT PSPC observations and found that clusters in the outskirts have significant ( 70 percent) azimuthal scatter in their surface brightness when the clusters are divided into 12 sectors. Theoretically galaxy clusters are expected to be increasingly anisotropic in their outskirts with accretion occurring preferentially along large scale structure (LSS) filaments (Burns et al., 2010).
| Cluster | z | Reference | Plot symbol |
|---|---|---|---|
| Abell 2029 | 0.0767 | Walker et al. (2012)a | Red square |
| PKS 0745-191 | 0.1028 | Walker et al. (2012)b | Grey square |
| Abell 1795 | 0.063 | Bautz & et al. (2009) | Red triangle |
| Abell 1413 | 0.143 | Hoshino & et al. (2010) | Blue triangle |
| Abell 2142 | 0.0899 | Akamatsu et al. (2011) | Blue square |
| Hydra A | 0.0539 | Sato et al. (2012) | Cyan square |
| Perseus | 0.0183 | Simionescu et al. (2011) | Pink square |
| Abell 1689 | 0.183 | Kawaharada et al. (2010) | Red square |
| Abell 1835 | 0.253 | Bonamente et al. (2012) | Black square |
| Abell 2204 | 0.152 | Sanders et al. (2009) | Black triangle |
| Virgo | 16.1 Mpc | Urban et al. (2011) | Green crosses |
As mentioned in Walker et al. (2012)b, the emerging picture for these low redshift, relaxed cool core clusters is that of an entropy profile which obeys the powerlaw (from Voit et al. 2005) from around 0.2 out to around 0.5, beyond which it flattens. The radius at which this flattening starts, and the extent of this flattening, provides an important test of numerical simulations of galaxy clusters, requiring an accurate understanding and modelling of the gravitational and non-gravitational heating mechanisms in the ICM.
A number of physical processes are expected to affect the entropy profile in the outskirts. Gas clumping causes the gas density to be overestimated, thus causing the entropy to be underestimated. Gas clumping however is expected to be most significant outside , (Nagai & Lau, 2011).
A difference between the electron and ion temperatures in the ICM inside the accretion shock in the outskirts may also be important, and has been proposed in Hoshino & et al. (2010) and Akamatsu et al. (2011) as a cause for entropy profile flattening. This would arise because the ions, which carry most of the kinetic energy of the accreting gas (due to their greater mass) are thermalised first after the accretion shock, and this energy is then transferred inefficiently and slowly to the electrons through electron-ion collisions. However the absence of a pressure drop in the outskirts of galaxy clusters in the Sunyaev-Zeldovich (SZ) effect observations with Planck (Planck Collaboration et al., 2012), and the agreement between the Planck observations of the gas pressure with simulations suggests that the electrons and ions in the outskirts are in equilibrium. In addition, the hydrodynamical simulations of Wong & Sarazin (2009) indicate that within the electron and ion temperatures are expected to differ by less than a percent.
Lapi et al. (2010) and Cavaliere et al. (2011) have proposed that entropy profile flattening in the outskirts of relaxed galaxy clusters is the natural result of the weakening of the accretion shock as it expands. This is a result of the accreting material originating from the tapering wings of the dark matter perturbation over a decreasing background density level due to the accelerated cosmic expansion. Therefore the accreting gas falls through a progressively smaller potential drop as the accretion shock expands outwards. The weakening of the accretion shock as it expands reduces the entropy gain at the shock and also increases the amount of bulk energy passing across the shock by the infalling gas. This increases the level of turbulence and non-thermal pressure support in the outskirts, causing hydrostatic equilibrium mass estimates which use only the thermal pressure to underestimate the true mass (as has been found in Lau et al. 2009).
Lapi et al. (2010) and Cavaliere et al. (2011) propose a functional form for the entropy profile in the outskirts (outside ) which can be written as:
| (1) |
where is the virial radius, taken to be half the turnaround radius for the collapsing overdensity (which has detached from the Hubble flow) from which the cluster forms, which in a CDM universe is . This functional form has a maximum at , and a gradient at which is . Lapi et al. (2010) and Cavaliere et al. (2011) propose that as clusters get older the flattening and downturn of the entropy profile at large radius becomes more severe due to the reduction in the strength of the accretion shock. However the small redshift range covered by our sample (all have redshifts less than 0.25) means that no age evolution is discernible within our sample. The entropy profile flattening is not expected to occur in non-cool-core clusters, since for these younger clusters the high accretion rates and strong shocks should allow the entropy profile to follow the relation out to the virial radius, however their often disturbed morphologies complicates observations.
2 Analysis
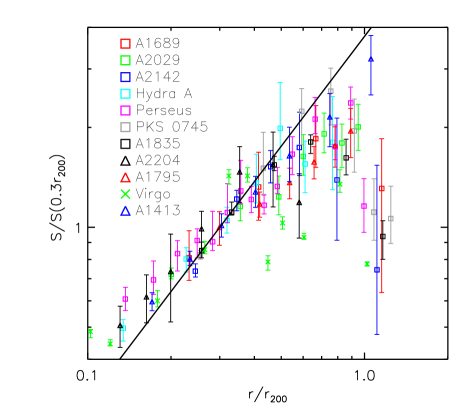
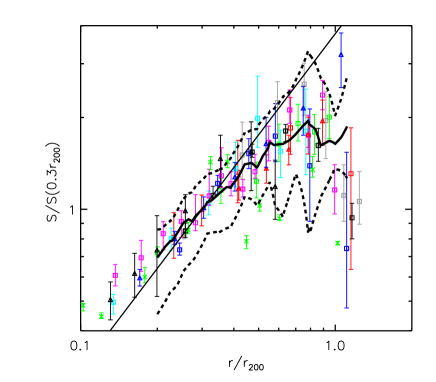
We use the entropy profiles for the clusters listed in table 1 and scale them by their entropy at , a region where the clusters all demonstrate a powerlaw increase in entropy and are in hydrostatic equilibrium since this is both far enough away from the core to avoid the affects of cooling and feedback processes, and far enough from the outskirts to be unaffected by accretion processes. This is shown in Fig. 1 left. For the data from Bautz & et al. (2009), which presents analytic forms for the entropy profile instead of points, we show points centred on the annuli from which the spectra were extracted, and include only the data in the range in which the analytic forms for the temperature and density (and thus entropy) were fit (between 5′-17.5′). We do the same for the results of Bonamente et al. (2012), in which a best fit analytic entropy profile line is presented rather than entropy data points for each annulus.
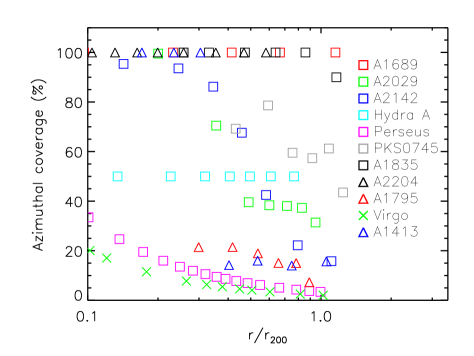
The results for the Virgo cluster from Urban et al. (2011), shown by the green crosses in Figs. 1 and 3, are systematically below the general trend of the other clusters, indicating more severe entropy profile flattening, with significant oscillatory behaviour in the entropy profile with radius. This may be the result of a combination of the following factors. Virgo is the poorest and least massive cluster in our sample, which may indicate that entropy profile flattening is a function of cluster mass. The small azimuthal coverage of the Virgo observations (as shown in Fig. 2, at the azimuthal coverage is 2 percent) may mean that the results are not representative of the cluster as a whole, given the observed azimuthal variations in the surface brightness of the ICM in the outskirts of clusters (Eckert et al., 2012). For instance, if the observed strip happened to coincide with a region of higher than average gas clumping then this would anomalously give a larger inferred density, and thus a lower inferred entropy than the actual azimuthal average in the outskirts. The fact that there is a cold front at in the direction observed may also make the results unrepresentative of the whole cluster.
The outermost entropy measurement from Abell 1413 (blue triangles) also lies above the average relation. However as shown in Fig. 2 the fraction of the ICM in the annulus which is studied is quite low ( 15 percent), and so may not be representative of the whole cluster at that radius.
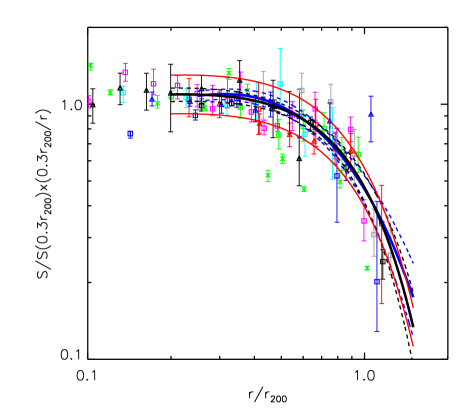
In Fig. 1 (right) we plot against r (scaling the profiles by ), which more clearly shows the deviation from a simple powerlaw above 0.5. We find that the profile is fitted well by the functional form for with best fitting parameters and , so that;
| (2) |
We also find the best fit to the scaled entropy profiles in the range using the functional form of equation 1 from Lapi et al. (2010) and Cavaliere et al. (2011), which is found to model the entropy profiles well with best fit parameters , , , so the best fit relation is
| (3) |
Since the errors on each parameter are correlated, the errors on the best fits were obtained by using a Monte Carlo method with 10000 trials, and the 2 variations of the best fit models are shown by the dashed lines in Fig. 1 right. Black lines show equation 2 while the blue lines show equation 3. When performing the fitting the entropy profiles from each cluster were also weighted by the azimuthal coverage of the observations of each cluster (shown in Fig. 2), so that more weight was given to observations with larger, more representative azimuthal coverage. This reduces the possible bias of observations which were taken along narrow strips which may not be representative of the cluster as a whole.
The solid red lines in Fig. 1 (right) show the effect of 30 percent density variations on the best fit entropy profile. This is the level of azimuthal scatter in the gas density inferred from the azimuthal scatter in the surface brightness of the clusters studied in Eckert et al. (2012) (where the observed surface brightness scatter was 70 percent around ). We find that the majority of the data lie within this range around the best fit profile, suggesting that most of the scatter around the best fit profile can be explained by the 30 percent azimuthal density variations found in Eckert et al. (2012). The Virgo results are however inconsistent with the trend of the other clusters. This may be because the azimuthal scatter measured in Eckert et al. (2012) was found by dividing the clusters in their ROSAT sample into 12 sectors of opening angle 30 degrees, whereas the Virgo strip is much narrower than this (its opening angle is 8 degrees). It is therefore possible that the scatter measured in Eckert et al. (2012) underestimates the level of scatter at scales smaller than the sector size they used.
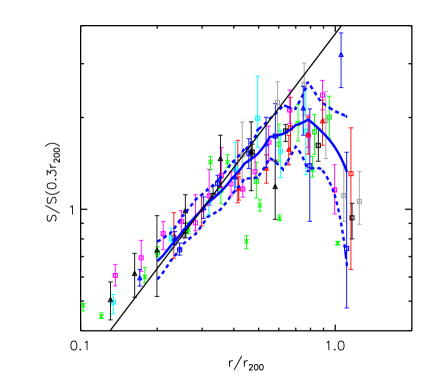
In Fig. 3 (black lines) we compare the scaled entropy profiles with the similarly scaled predicted entropy profiles from the numerical simulations of Burns et al. (2010) obtained using the Eulerian adaptive mesh refinement (AMR) cosmology code Enzo using only adiabatic gas physics (thus neglecting non-gravitational heating, cooling, magnetic fields, and cosmic rays). We find that the radius at which entropy flattening begins is higher in the simulations of Burns et al. (2010) than in the observations, suggesting that more physical processes need to be included in the numerical simulations to accurately describe the observed properties of clusters. The simulations of Kravtsov & Borgani (2012) also show the entropy profile flattening starting outside , at a higher radius than is seen in the observations. A possibility is that the simulations may overestimate the number of major mergers at late cosmic times, causing the strength of the accretion shocks to be overestimated and increasing the radius at which the entropy profile flattening begins.
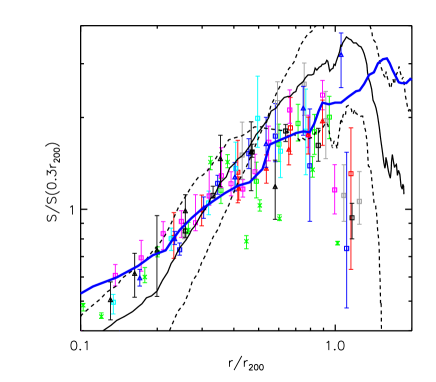
In Fig. 3 we also compare the observed entropy profiles with the profile shape obtained in the gas clumping simulations of Nagai & Lau (2011) (solid blue line), which included the effects of cooling and star formation (CSF). The clumping effect only becomes significant outside , and is not large enough to account for the amount of entropy flattening and turnover.
3 Comparing to ROSAT, XMM-Newton and Planck results
Planck Collaboration et al. (2012) obtained a pressure profile for a stacked sample of 62 clusters using the SZ-effect reaching out to , while Eckert et al. (2012) obtained an average density profile from a sample of 31 clusters obtained with ROSAT PSPC observations out to . Using that we can combine these to obtain a scaled entropy profile, and this is plotted in Fig. 4 (top) as the thick black line. The resulting entropy profile agrees well with the Suzaku observations, flattening off above 0.5.
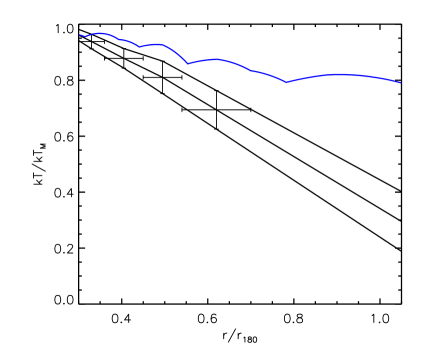
As another test we use the average temperature profile found in Leccardi & Molendi (2008) out to 0.7 using XMM-Newton observations of a sample of 50 clusters, and extrapolate this out linearly to , as shown in Fig. 5. When combined with the ROSAT density profile from Eckert et al. (2012) the resulting scaled entropy profile is shown by the solid blue line in Fig. 4 (bottom), which again agrees well with the Suzaku results.
4 Summary
We have compiled a sample of relaxed cool core galaxy clusters (with ) whose ICM has been studied to . We find that the scaled entropy profiles are best fit using a function of the form . We also investigate the analytic function proposed by Cavaliere et al. (2011), and have found it to fit the data well outside 0.3 (equation 3). This adds support to the suggestion of Lapi et al. (2010) and Cavaliere et al. (2011) that the flattening and downturn of the ICM entropy in the outskirts is the result of the decreasing strength of the accretion shock as it expands, due to the accreting matter coming from the tapering wings of the dark matter perturbation. The increase in bulk energy seeping through the shock is expected to lead to turbulence and non-thermal pressure support, which are predictions that could be tested by next generation instruments studying cluster outskirts.
The observed scaled entropy profiles turnover at a radius lower than that predicted by the numerical simulations of Burns et al. (2010) which used only adiabatic gas physics. The entropy profile flattening due to gas clumping calculated in the CSF numerical simulations of Nagai & Lau (2011) is insufficient to match the observations (Fig. 3), suggesting that clumping alone cannot be responsible for the flattening and turnover of the entropy profile, indicating that some other process must contribute. Clumping is required to explain the observed excess of the gas mass fraction over the mean cosmic baryon fraction around (Simionescu et al. 2011; Walker et al. 2012b; Planck Collaboration et al. 2012), though part of this excess may be the result of increasing non-thermal pressure support in the outskirts causing the total mass estimates using only thermal pressure to be underestimated by around 20 percent at (Lau et al. 2009; Walker et al. 2012b).
The Suzaku entropy profiles are in strong agreement with the entropy profiles obtained by combining the mean pressure profile obtained with Planck (Planck Collaboration et al., 2012), the mean density profile obtained with ROSAT PSPC (Eckert et al., 2012) and the extrapolation of the mean temperature profile obtained with XMM-Newton (Leccardi & Molendi, 2008).
Acknowledgements
SAW is supported by STFC, and ACF thanks the Royal Society. MRG acknowledges support from an NSF Graduate Research Fellowship and NASA grant NNX10AR49G. This research has used data from the telescope, a joint mission between JAXA and NASA.
References
- Akamatsu et al. (2011) Akamatsu H., Hoshino A., Ishisaki Y., Ohashi T., Sato K., Takei Y., Ota N., 2011, PASJ, 63, 1019
- Akamatsu & Kawahara (2011) Akamatsu H., Kawahara H., 2011, ArXiv:1112.3030
- Bautz & et al. (2009) Bautz M. W., et al. 2009, PASJ, 61, 1117
- Bonamente et al. (2012) Bonamente M., Landry D., Maughan B., Giles P., Joy M., Nevalainen J., 2012, ArXiv:1206.6067
- Burns et al. (2010) Burns J. O., Skillman S. W., O’Shea B. W., 2010, ApJ, 721, 1105
- Cavaliere et al. (2011) Cavaliere A., Lapi A., Fusco-Femiano R., 2011, ApJ, 742, 19
- Eckert et al. (2012) Eckert D., Vazza F., Ettori S., Molendi S., Nagai D., Lau E. T., Roncarelli M., Rossetti M., Snowden S. L., Gastaldello F., 2012, A&A, 541, A57
- Hoshino & et al. (2010) Hoshino A., et al. 2010, PASJ, 62, 371
- Kawaharada et al. (2010) Kawaharada M., Okabe N., Umetsu K., Takizawa M., Matsushita K., Fukazawa Y., Hamana T., Miyazaki S., Nakazawa K., Ohashi T., 2010, ApJ, 714, 423
- Kravtsov & Borgani (2012) Kravtsov A., Borgani S., 2012, ArXiv:1205.5556
- Lapi et al. (2010) Lapi A., Fusco-Femiano R., Cavaliere A., 2010, A&A, 516, A34
- Lau et al. (2009) Lau E. T., Kravtsov A. V., Nagai D., 2009, ApJ, 705, 1129
- Leccardi & Molendi (2008) Leccardi A., Molendi S., 2008, A&A, 486, 359
- Nagai & Lau (2011) Nagai D., Lau E. T., 2011, ApJ, 731, L10+
- Planck Collaboration et al. (2012) Planck Collaboration Ade P. A. R., Aghanim N., Arnaud M., Ashdown M., et al. 2012, ArXiv:1207.4061
- Sanders et al. (2009) Sanders J. S., Fabian A. C., Taylor G. B., 2009, MNRAS, 393, 71
- Sato et al. (2012) Sato T., Sasaki T., Matsushita K., Sakuma E., Sato K., Fujita Y., Okabe N., Fukazawa Y., Ichikawa K., Kawaharada M., Nakazawa K., Ohashi T., Ota N., Takizawa M., Tamura T., 2012, ArXiv:1203.1700
- Simionescu et al. (2011) Simionescu A., Allen S. W., Mantz A., Werner N., Takei Y., Morris R. G., Fabian A. C., Sanders J. S., Nulsen P. E. J., George M. R., Taylor G. B., 2011, Science, 331, 1576
- Urban et al. (2011) Urban O., Werner N., Simionescu A., Allen S. W., Böhringer H., 2011, MNRAS, 414, 2101
- Voit et al. (2002) Voit G. M., Bryan G. L., Balogh M. L., Bower R. G., 2002, ApJ, 576, 601
- Voit et al. (2005) Voit G. M., Kay S. T., Bryan G. L., 2005, MNRAS, 364, 909
- Walker et al. (2012) Walker S. A., Fabian A. C., Sanders J. S., George M. R., 2012, MNRAS, 424, 1826
- Walker et al. (2012) Walker S. A., Fabian A. C., Sanders J. S., George M. R., Tawara Y., 2012, MNRAS, 422, 3503
- Wong & Sarazin (2009) Wong K.-W., Sarazin C. L., 2009, ApJ, 707, 1141