Interpreting the near-infrared spectra of the ’golden standard’ Type Ia supernova 2005cf††thanks: Based on observations collected at ESO, Paranal. Program ID 075.D-0823(B).
Abstract
We present nine near-infrared (NIR) spectra of supernova (SN) 2005cf at epochs from d to d with respect to -band maximum, complementing the existing excellent data sets available for this prototypical Type Ia SN at other wavelengths. The spectra show a time evolution and spectral features characteristic of normal Type Ia SNe, as illustrated by a comparison with SNe 1999ee, 2002bo and 2003du. The broad-band spectral energy distribution (SED) of SN 2005cf is studied in combined ultraviolet (UV), optical and NIR spectra at five epochs between 8 d before and 10 d after maximum light. We also present synthetic spectra of the hydrodynamic explosion model W7, which reproduce the key properties of SN 2005cf not only at UV-optical as previously reported, but also at NIR wavelengths. From the radiative-transfer calculations we infer that fluorescence is the driving mechanism that shapes the SED of SNe Ia. In particular, the NIR part of the spectrum is almost devoid of absorption features, and instead dominated by fluorescent emission of both iron-group material and intermediate-mass elements at pre-maximum epochs, and pure iron-group material after maximum light. A single P-Cygni feature of Mg ii at early epochs and a series of relatively unblended Co ii lines at late phases allow us to constrain the regions of the ejecta in which the respective elements are abundant.
keywords:
supernovae: individual: SN 2005cf – supernovae: individual: SN 1999ee – supernovae: individual: SN 2002bo – supernovae: individual: SN 2003du – techniques: spectroscopic – radiative transfer1 Introduction
An empirical relation between their maximum brightness and light curve decline rate (Phillips, 1993) makes Type Ia supernovae (SNe Ia) one of the best tools to measure cosmological distances. Using this approach Riess et al. (1998) and Perlmutter et al. (1999) discovered that our Universe undergoes an accelerated expansion. This was in turn interpreted as evidence for the existence of ‘dark energy’ (e.g. Riess et al. 2007). Despite this importance for astrophysics and cosmology our knowledge about the progenitor systems or the explosion mechanisms of these luminous events is still limited. They are commonly believed to be thermonuclear explosions of carbon-oxygen white dwarfs in binary systems. However, many aspects are still unclear; e.g. the masses of the exploding stars, the nature of the companion star, the ignition conditions, the exact mechanism of the burning process or the origin of the various subclasses of SNe Ia. Systematic uncertainties arising from this ignorance are one factor limiting the precision of cosmological measurements. One way to improve our understanding of these objects is the comparison of observed spectra with predictions from theoretical models. This, however, requires complete data sets with a wide wavelength coverage (Röpke et al., 2012).
In particular, the near-infrared111In this paper we will refer to wavelengths between 9500 and 26 000 Å when talking about ‘near-infrared’. (NIR) regime has been proposed as a useful tool to discriminate between different explosion models (e.g. Marion et al., 2003). This is mainly due to the fact that the lower opacity in the NIR enables us to look deeper into the ejecta and thus probe layers still hidden to optical observations at the same epochs. Also, the NIR is believed to be less severely affected by line blending compared to optical or ultraviolet (UV) wavelengths (Harkness, 1991; Höflich et al., 1993; Spyromilio et al., 1994; Wheeler et al., 1998). At the same time, however, observations suggest SNe Ia to be excellent NIR standard candles (Elias et al. 1985; Meikle 2000; Krisciunas et al. 2004, but see Kattner et al. 2012), in contrast to optical wavelengths where they can only be used as standardizeable candles. This result was confirmed by a series of toy explosion models (Kasen, 2006). While the homogeneity in the NIR might point towards a common explosion mechanism for all SNe Ia, it could also mean that the NIR photons are not as sensitive to variations in the ejecta as previously suggested.
While optical spectra have been studied quite extensively, the NIR regime is still comparatively unexplored. Although there are quite a few publications containing NIR spectra of SNe Ia (e.g. Frogel et al. 1987; Spyromilio et al. 1992, 2004; Meikle et al. 1996; Bowers et al. 1997; Hamuy et al. 2002a, b; Höflich et al. 2002; Rudy et al. 2002; Marion et al. 2003, 2009; Benetti et al. 2004; Elias-Rosa et al. 2006; Stanishev et al. 2007; Taubenberger et al. 2011) one has to realize that for many SNe there is only one spectrum available – typically at post-maximum epochs – or that the objects are of a peculiar subclass. The number of well-sampled normal SNe Ia with pre-maximum-light observations in the NIR is actually quite small. Meikle et al. (1996) have published six spectra of SN 1994D, Hamuy et al. (2002a, b) eleven spectra of SN 1999ee, Benetti et al. (2004) six spectra of SN 2002bo, Pignata et al. (2008) four spectra of SN 2002dj, Elias-Rosa et al. (2006) ten spectra of SN 2003cg and Marion et al. (2009) four spectra of SN 2005am. Moreover, there are 14 spectra of SN 2003du out to the nebular phase, published by Motohara et al. (2006), Stanishev et al. (2007) and Marion et al. (2009).
In order to increase the sample of SNe Ia with good NIR coverage we present and analyze a set of nine NIR spectra of SN 2005cf, ranging from d to d with respect to -band maximum. SN 2005cf, according to Wang et al. (2009) ‘the golden standard Type Ia supernova’, is a spectroscopically normal SN Ia with a more complete data set than most other SNe Ia. Optical and NIR photometry as well as optical spectroscopy of SN 2005cf have been published by Garavini et al. (2007), Pastorello et al. (2007) and Wang et al. (2009). UV photometry and spectroscopy have been published by Bufano et al. (2009) and Wang et al. (2012).
Table 1 summarizes the most important properties of SN 2005cf: at -band maximum, it had a magnitude of (Pastorello et al., 2007), lies between 1.07 (Wang et al., 2009) and 1.12 (Pastorello et al., 2007), and the derived 56Ni mass is about 0.7 (Pastorello et al., 2007) or 0.78 (Wang et al., 2009). This corresponds quite well to the average values obtained for normal SNe Ia. An important shortcoming of the data set of SN 2005cf has so far been the lack of published NIR spectroscopy. This deficiency is now remedied with the data presented in this work.
| Pastorello et al. | Wang et al. | |
|---|---|---|
| (2007) | (2009) | |
| JD of | 2 453 534.0 0.3 | 2 453 533.66 0.28 |
| 13.54 0.02 | 13.63 0.02 | |
| 0.33 | ||
| 1.12 0.03 | 1.07 0.03 | |
| 0.7 | (0.78 0.10) | |
| (MCG-01-39-003) | (32.51 0.33) mag | (32.31 0.11) mag |
| 0 mag | (0.10 0.03) mag |
The paper is organised as follows. In Section 2 the NIR spectra of SN 2005cf are presented and the process of data reduction is described. In Section 3 we compare these observations to the NIR spectra of other SNe Ia and construct combined UV-optical-NIR spectra to investigate the broad-band spectral energy distribution (SED). Synthetic spectra of the hydrodynamic explosion model W7 (Nomoto et al., 1984) are used to explain the SED in terms of fluorescence and to perform a NIR line identification (Section 4). Conclusions are drawn in Section 5.
2 Observations and data reduction
The spectroscopic data of SN 2005cf were obtained with ISAAC (Moorwood et al., 1999), mounted at the Very Large Telescope at the Paranal Observatory of ESO (European Southern Observatory), and NICS (Near-Infrared Camera Spectrometer), mounted at the Telescopio Nazionale Galileo of Fundación Galileo Galilei and INAF (Istituto Nazionale di Astrofisica). The spectra were collected by the European Research Training Network (RTN) ‘The Physics of Type Ia Supernova Explosions’222http://www.mpa-garching.mpg.de/~rtn/. They cover the time interval from 10 d before to 42 d after -band maximum (see Table LABEL:table:SN2005cf_epochs for details).
| UT date | Julian Day | Epoch | Instrument |
|---|---|---|---|
| 2005/06/02 | 2 453 523.8 | d | ISAAC |
| 2005/06/03 | 2 453 524.5 | d | NICS |
| 2005/06/07 | 2 453 528.6 | d | ISAAC |
| 2005/06/12 | 2 453 533.7 | d | ISAAC |
| 2005/06/14 | 2 453 535.8 | d | ISAAC |
| 2005/06/23 | 2 453 544.7 | d | ISAAC |
| 2005/06/26 | 2 453 548.4 | d | NICS |
| 2005/07/13 | 2 453 565.4 | d | NICS |
| 2005/07/24 | 2 453 575.5 | d | NICS |
The spectra taken with ISAAC (at epochs d, d, d, 1.8 d and 10.7 d with respect to -band maximum) were taken in the short-wavelength low-resolution setup (resolution ). The observational data are divided into the four bands , , and , which cover the wavelength range from 9000 Å to 25 600 Å. The NICS spectra (at epochs d, 14.4 d, 31.4 d and 41.5 d with respect to -band maximum) were taken with an Amici prism as disperser. They cover the whole NIR region between about 7500 Å and 26 000 Å at very low resolution ().
For the NICS data, cross-talk and distortion corrections were applied
with snap333Speedy Near-IR data Automatic reduction
Pipeline,
http://www.arcetri.astro.it/~filippo/snap/.
All other reduction steps for both the NICS and the ISAAC data were
performed using iraf444iraf (Image Reduction
and Analysis Facility) is distributed by the National Optical
Astronomy Observatories, which are operated by the Association of
Universities for Research in Astronomy, Inc., under cooperative
agreement with the National Science Foundation., following standard
procedures in the NIR. This included dark-current and flat-field
corrections, and a pairwise subtraction of sub-exposures taken with
the target off-set along the slit in order to remove the sky emission.
One-dimensional spectra were obtained from the two-dimensional images
using an optimal, variance-weighted extraction method
(Horne, 1986). For the ISAAC spectra the wavelength was
calibrated with the help of arc-lamp spectra taken along with the SN
exposures using exactly the same telescope configuration, and the
calibration was checked with the position of known telluric features.
For the NICS spectra, the wavelength calibration was accomplished with
tabulated values. Telluric features were removed from the SN spectra
by dividing through spectra of telluric standard stars of type A0 or
similar, which had been observed at a similar airmass as the SN. A
first relative flux calibration was provided by multiplication with a
Vega spectrum. Then the absolute fluxes were adjusted to agree with
contemporaneous photometry by Pastorello et al. (2007) and
Wang et al. (2009). Finally, redshift () and reddening
[ mag, (Schlegel, Finkbeiner, &
Davis, 1998)] corrections
were applied.
3 Results
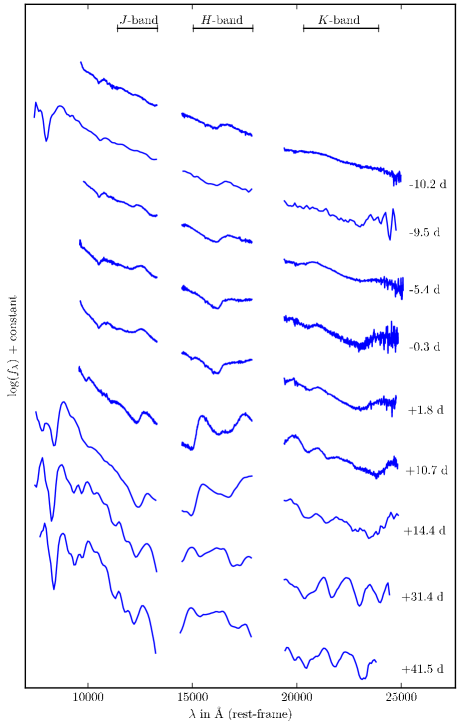
The nine final, reduced NIR spectra of SN 2005cf are presented in Fig. 1. Before maximum light, large parts of the spectra resemble the infrared tail of a black-body continuum. This changes significantly at later epochs, when the spectra start to show increasingly pronounced spectral features. Around 10 d after maximum (and thereafter) two distinct humps form between 15 000 Å and 18 000 Å. These have been previously identified as Co ii emission (Wheeler et al., 1998). Characteristic features in the band, which form at even later epochs, have also been attributed to Co emission (Wheeler et al., 1998). Compared to a corresponding black-body continuum there is an increasing flux deficit in the -band region after maximum light.
In the following we will take a more detailed look at the spectral properties of SN 2005cf, comparing the NIR data of SN 2005cf to those of other well-observed normal SNe Ia and studying the SED in combined UV-through-NIR spectra.
3.1 Comparison of SN 2005cf to other Type Ia supernovae
Representative, normal SNe Ia, for which multi-epoch NIR spectroscopy is available, are e.g. SNe 1999ee (Hamuy et al., 2002a, b), 2002bo (Benetti et al., 2004) and 2003du (Stanishev et al., 2007). An overview, comparing some of their properties to those of SN 2005cf, is given in Table 3.
| SN 1999ee | SN 2002bo | SN 2003du | SN 2005cf | |
| Branch subtypea | ‘shallow-silicon’ | ‘broad-line’ | ‘core-normal’ | ‘core-normal’ |
| Benetti subtypeb | LVG | HVG | LVG | LVG |
| (km s-1 d-1)b | 42 5 | 110 7 | 31 5 | 35 5 |
| (Si ii) ( km s-1)b | 9.90 0.10 | 11.73 0.15 | 10.10 0.10 | 9.94 0.30 |
| 0.94 0.06 | 1.13 0.05 | 1.02 0.05 | 1.12 0.03 | |
| 0.32 mag | (0.43 0.10) mag | (0.01 0.05) mag | 0.097 mag | |
| Redshift | 0.0117 | 0.0043 | 0.0064 | 0.00646 |
| References | Hamuy et al. (2002a, b) | Benetti et al. (2004, 2005) | Stanishev et al. (2007) | Garavini et al. (2007) |
| Stritzinger et al. (2002) | Stehle et al. (2005) | Benetti et al. (2005) | Pastorello et al. (2007) | |
| Benetti et al. (2005) | Branch et al. (2006) | Branch et al. (2009) | Branch et al. (2009) | |
| Branch et al. (2006) | Wang et al. (2009) |
The light-curve decline rate of SN 1999ee characterizes it as a relatively slowly declining SN Ia. However, its peak magnitude agrees with the light-curve shape as described by the Phillips relation (Phillips, 1993; Phillips et al., 1999). Marginally assigned to the ‘shallow-silicon’ class by Branch et al. (2006), the spectral features show that, overall, SN 1999ee is a typical SN Ia (Hamuy et al., 2002a, b). Concerning the spectral features, the same can be said about SN 2002bo, though at early phases this SN has higher ejecta velocities than the average normal SN Ia (Benetti et al., 2004; Stehle et al., 2005) and has been included in the ‘broad-line’ and ‘high-velocity-gradient’ SN Ia subclasses by Branch et al. (2006) and Benetti et al. (2005), respectively. SN 2003du, finally, is very similar to SN 2005cf in many respects, both being ‘core-normal’, ‘low-velocity-gradient’ SNe Ia (Branch et al., 2006; Benetti et al., 2005). Fig. 2 shows that the NIR spectral evolution of all four SNe is remarkably similar, with a few exceptions worth mentioning.
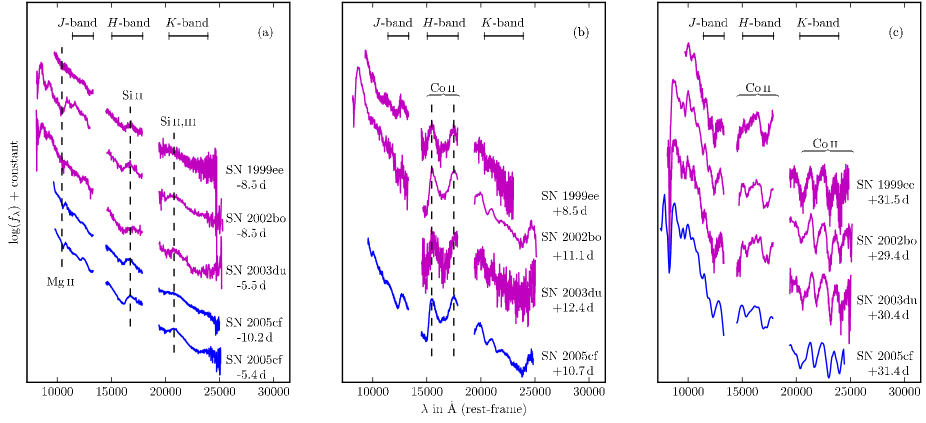
3.1.1 Spectra ten to five days before -band maximum
Panel (a) of Fig. 2 shows spectra between 10.2 and 5.4 d before -band maximum.
Around 10 400 Å there is a very prominent absorption feature in SN 2002bo. This feature was first observed in SN 1994D, where Meikle et al. (1996) suggested that it comes from either Mg ii 10926 or He i 10830. However, Wheeler et al. (1998) showed evidence that the line should come entirely from Mg. Benetti et al. (2004) followed this reasoning and attributed the feature in SN 2002bo to Mg ii. The same feature, though much weaker, is also present in the spectra of SNe 2003du and 2005cf, but only marginally detectable in SN 1999ee. Whether this variation is a sign of different Mg abundances or just different ionization and excitation conditions is unclear. A feature around 16 800 Å can be seen in all four SNe. Hamuy et al. (2002a, b), Marion et al. (2003), Benetti et al. (2004) and Stanishev et al. (2007) agree that it is likely due to Si ii. Benetti et al. (2004) believe that a weak feature in SN 2002bo at about 20 800 Å comes from Si ii. Stanishev et al. (2007) instead propose Si iii as the origin of the same feature in SN 2003du. In SN 2005cf the feature can also be discerned in the d spectrum, but appears more prominent in the d spectrum.
3.1.2 Spectra around ten days after -band maximum
Panel (b) of Fig. 2 shows spectra between 8.5 and 12.4 d after -band maximum.
In contrast to the spectra before maximum light, the Mg and Si features are no longer present in the spectra 3 weeks later. Instead, the NIR spectra now show markedly more structure and are dominated by singly ionized Co and Fe. In particular, there are strong Co ii features around 15 500 Å and 17 500 Å in all four SNe.
3.1.3 Spectra around thirty days after -band maximum
Panel (c) of Fig. 2 shows spectra between 29.4 and 31.5 d after -band maximum.
The strong features in the band seem almost identical in the four Type Ia SNe, but especially similar in SNe 2002bo and 2005cf. In SN 2003du this region appears to be somewhat better resolved into individual, narrower features, which could point to a slightly lower maximum expansion velocity of the iron-group-element-rich core of the ejecta. Above 20 000 Å, a characteristic pattern of Co ii lines (Wheeler et al., 1998) is now very prominent in all four SNe. As shown by Marion et al. (2009), these features appear in all SNe Ia at sufficiently advanced epochs. Similarly, a lack of flux in the band, compared to a corresponding black-body continuum, is now clearly visible in all the SNe of our sample.
3.1.4 Mg line velocities
In previous work it was reported that the blueshift of the Mg ii 10926 absorption line555‘Mg ii 10926’
is a short notation for the triplet
10914: 2p63d 2D5/2 – 2p64p 2P3/2,
10915: 2p63d 2D3/2 – 2p64p 2P3/2,
10952: 2p63d 2D3/2 – 2p64p 2P1/2.
does not evolve with time in
SNe 1994D (Meikle et al., 1996), 1999ee (Hamuy et al., 2002a, b)
and 2003du (Stanishev et al., 2007). Meikle et al. (1996) interpreted
this as the feature being detached, which means that it forms well
above the region of peak emissivity at these wavelengths. Accordingly,
the measured Mg velocity will not change when the emission region
recedes deeper into the core due to the increasing dilution of the
ejecta with time. Thus, the measured Mg ii velocity traces a zone
with high Mg ii abundance, or specifically the lower boundary of such a
zone where the density is highest.
Mg ii lines in the optical part
of the spectrum are less suited to unveil the location of the Mg-rich
zone since i) they are intrinsically stronger so that very little
Mg (already on the level of Mg present in the progenitor star) is
sufficient for them to form (Marion et al., 2003), ii) they are more
strongly blended with lines from other species, and iii) the
emissivity at shorter wavelengths peaks at much larger radii than
in the NIR (see Section 4.2) – at early phases inside or even
above the zone of highest Mg ii abundance.
In order to verify whether the constancy of the Mg ii 10926 velocity may indeed be a generic feature of normal SNe Ia, we measured the position of this line in our ISAAC spectra of SN 2005cf. We obtain velocities of 11 400 km s-1 for the d, d and d spectra, and 11 200 km s-1 for the d spectrum. Within the typical measurement uncertainties of 100–200 km s-1 this is a perfectly constant trend from the earliest spectrum to the disappearance of the line around maximum light, supporting the Meikle et al. (1996) interpretation of a detached feature. The absolute value of the Mg ii 10926 velocity of SN 2005cf is also quite similar to those derived for SNe 1994D ( 11 700 km s-1, Meikle et al. 1996) and 1999ee ( 10 500 km s-1, Hamuy et al. 2002a, b), indicating a similar layering in these three low-velocity-gradient SNe.
Unfortunately there is only a single pre-maximum NIR spectrum available for SN 2002bo, and accordingly the time evolution of the Mg ii 10926 velocity cannot be checked. The value of 14 400 km s-1 measured in the d spectrum, however, is significantly larger than in the other SNe. SN 2002bo is a high-velocity-gradient SN with particularly broad and strongly blueshifted Si ii and Ca ii lines in the early optical spectra. It may well be that the same mechanism that is responsible for the high-velocity absorptions at optical wavelengths (a density or abundance enhancement in the very outer layers, see e.g. Mazzali et al. 2005) also acts to produce a NIR Mg ii line that is more pronounced and more strongly blueshifted than usual.
3.2 UV-optical-infrared
While UV-optical spectra (with varying quality of the UV part) have been published for several SNe Ia (e.g. Kirshner et al., 1993; Bufano et al., 2009; Wang et al., 2012; Foley et al., 2012a; Maguire et al., 2012) and combined optical-NIR spectra are available for many well-observed SNe Ia, complete UV-through-NIR spectra are still a novelty. In fact, to the authors’ best knowledge only a single UV-through-NIR spectrum of a SN Ia (though with a very high quality UV part) has thus far seen the light of day: a maximum-light spectrum of SN 2011iv presented by Foley et al. (2012b).
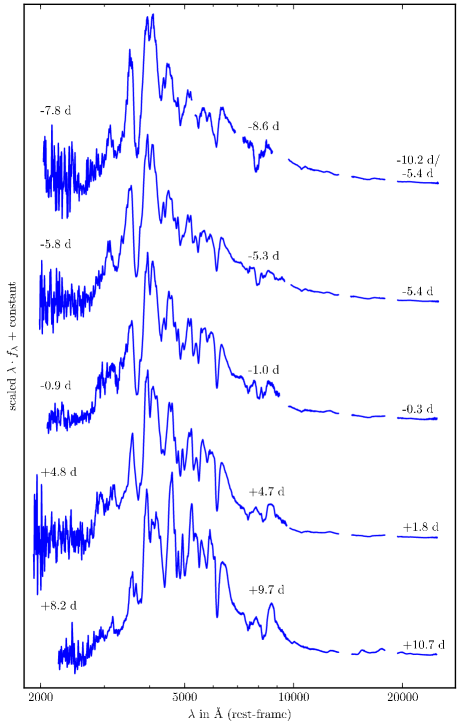
The unusually complete data set of SN 2005cf in different wavelength regimes enabled us to create a set of five spectra combined from UV (Bufano et al., 2009), optical (Garavini et al., 2007) and NIR (this paper) data (Fig. 3). As the spectra were typically not taken at exactly the same epoch, we chose the spectra closest in time and adjusted the fluxes of the UV and NIR spectra to match the flux level of the optical spectra. Our UV-through-NIR spectra which cover epochs from 8 d before to 10 d after maximum light, are presented in Fig. 3.
Foley et al. (2012b) already commented on the SED of SN 2011iv at maximum light being strongly peaked at optical wavelengths. From Fig. 3 one can see that for SN 2005cf this is true for all epochs from 8 d before to 10 d after maximum, and that the SED does not change much in this period. The flux blueward of 3000 Å and redward of 10 000 Å never contributes much to the total emission. The strong UV flux deficit in otherwise blue spectra is caused by severe line blanketing of iron-group elements at wavelengths shorter than 4000 Å (Pinto & Eastman, 2000). The main route for UV photons to escape is by fluorescence into the optical or NIR regime, which is discussed in more detail in Section 4.2.
4 Modelling
The discussion of spectral features in the previous section was solely based on a comparison of our NIR spectra of SN 2005cf to observed spectra of similar SNe Ia and line identifications made for those SNe. Here, we use detailed radiative-transfer models to discuss the spectral features in the NIR and the evolution of the overall SED in more detail.
4.1 Setup
To this end we used the Monte Carlo radiative-transfer code artis (Kromer & Sim, 2009; Sim, 2007) to obtain a self-consistent solution of the radiative-transfer problem and calculate synthetic spectra for the hydrodynamical explosion model W7 (Nomoto et al., 1984; Iwamoto et al., 1999). W7 is a one-dimensional model of a carbon deflagration in an accreting Chandrasekhar-mass carbon-oxygen white dwarf. It is a well-studied and widely-distributed model and reproduces observed optical spectra and light curves of SNe Ia reasonably well (e.g. Branch et al. 1985; Kasen et al. 2006; Kromer & Sim 2009; Jack et al. 2011; van Rossum 2012). In the NIR, however, W7 has not been studied in great detail yet and the main focus has been laid on the light curve evolution (Kasen et al., 2006; Kromer & Sim, 2009; Jack et al., 2012). The synthetic NIR spectra of W7 presented here can thus be a basis for future comparisons among different radiative-transfer codes.
For our simulation we used the ‘big_gf-4’ atomic data set of Kromer & Sim (2009, see their table 1) with a total of lines. The ejecta were mapped to a Cartesian grid. We then computed the propagation of photon packets from 2 to 120 d after the explosion. The calculation was split into 111 logarithmic time steps. To speed up the initial phase, a grey approximation, as discussed by Kromer & Sim (2009), was used in optically thick cells, and the initial 30 time steps (i.e. the initial six days after the explosion) were treated in local thermodynamic equilibrium (LTE). Since this is well before the epoch of our first spectrum of SN 2005cf it should not have any influence on the following discussion.
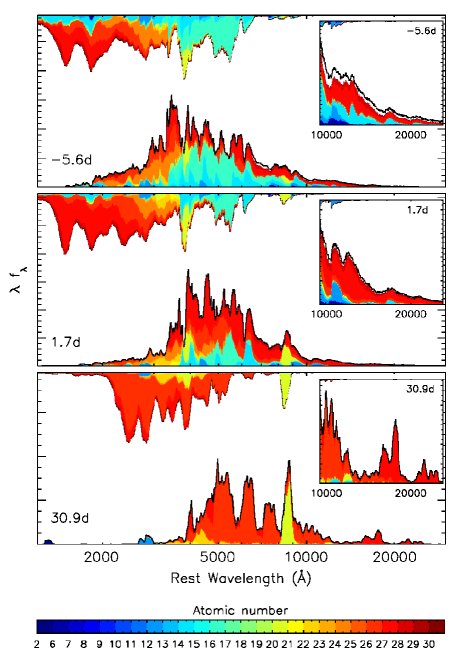
Three snapshots of the resulting spectral evolution at , 1.7 and 30.9 d with respect to -band maximum (which occurs 19.5 d after the explosion, at an absolute magnitude of ) are shown in Fig. 4 for UV to NIR wavelengths.
4.2 Formation of the spectral energy distribution
From our Monte Carlo simulation we do not only get the spectral evolution but also information on the last absorption and emission processes. In Fig. 4 this information is used to colour-code below the synthetic spectrum the fraction of escaping packets in each wavelength bin which were last emitted by bound-bound transitions of a particular element (the associated atomic numbers are illustrated in the colour bar). White regions between the emerging spectrum and the colour coded part indicate wavelengths at which continuum processes (bound-free, free-free) contribute to the last emission. The coloured regions along the top of the plots show the distribution of photon wavelengths that bound-bound-emitted escaping packets had prior to their last interaction. Again the colour coding indicates the elements which were responsible for absorbing packets in a particular wavelength bin.
Due to energy conservation the total ‘area’ of the emissions and absorptions, respectively, is equal. Thus the information depicted by the colour coding in Fig. 4 can be used to understand how the overall SED of our model forms. Around maximum light (middle panel) the flux is strongly suppressed by line blanketing of a dense forest of iron-group-element lines below 3000 Å. Between 3000 Å and 6000 Å prominent absorption features due to resonance scattering in lines of intermediate-mass elements are imprinted on an underlying quasi-continuum emitted by a dense forest of iron-group-element and intermediate-mass-element lines. Redward of 6000 Å the emerging flux is almost only due to fluorescent emission – a prominent exception is the Ca ii NIR triplet.
As visible from the inlays in the top right corners of the plots in Fig. 4, this behaviour is even more obvious in the NIR where almost no absorption occurs. The only feature which shows some absorption contribution in this wavelength regime is the aforementioned feature at 10 400 Å, which can be clearly identified as the Mg ii 10926 line from our simulation. Although even this line has a significant contribution from fluorescent emission, this confirms the interpretation of Wheeler et al. (1998) and justifies our use of the associated P-Cygni absorption trough in Section 3.1.4 to measure ejecta velocities of Mg. Note also that continuum processes contribute to some extent to the emission in the NIR (indicated by the white region between the emerging spectrum and the colour coded emission due to bound-bound processes). From our simulations we find that this continuum contribution is dominated by free-free emission.
Comparing the synthetic spectrum at about maximum light (middle panel of Fig. 4) to pre- and post-maximum epochs (top and bottom panels, respectively) it is clearly visible that the SED is dominated by different species at different epochs. While before maximum light intermediate-mass elements dominate the spectral features, they are almost negligible at 30.9 d after maximum (the strong NIR triplet of Ca ii is a prominent exception). Instead, the spectra are then completely dominated by fluorescent emission of iron-group elements. This is a consequence of the increasing dilution of the ejecta with time, which leads to lower optical depths allowing an observer to look deeper into the ejecta (which are strongly layered in the case of W7, see top panel of Fig. 5).
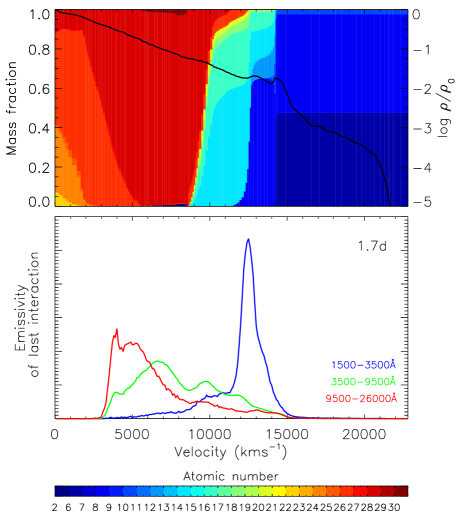
In the NIR this transition to an iron-group-element-dominated spectrum is already completed at maximum light, and even at pre-maximum epochs iron-group-element emission contributes a significant fraction to the emerging flux. This is further illustrated in the histograms in the bottom panel of Fig. 5, which show the regions of last emission for different wavelength regimes at 1.7 d after maximum light. While the NIR emissivity is strongly peaked at 5000 km s-1, the optical emissivity has significant contributions from a wider velocity range. The UV, in contrast, originates from a narrow region outside the iron-group-element-rich inner core, since the dense forest of iron-group-element lines causes extremely large optical depths within the core so that UV photons are trapped. The substructure in the histograms is a consequence of the emission by different species and the strong layering of the ejecta.
4.3 NIR line identification and comparison to SN 2005cf
The information on the last absorption and emission processes presented in the last section cannot only be used to investigate the formation of the broad-band SED, but also to identify individual features in the spectra. For that purpose contributions from individual ionization states can be extracted from the simulation, similarly to the contributions of different elements shown in Fig. 4.
We used this approach to identify individual features in the NIR regime of our model spectra. The results are presented in Fig. 6 along a time sequence of our synthetic spectra of the W7 model for 8 epochs between and 41.2 d with respect to -band maximum. In order to improve the signal-to-noise ratio the W7 spectra at 10.2, 5.6, 0.5 d before and 1.7 d after peak brightness were obtained by averaging over five, three, two and two subsequent time steps, respectively. This is not expected to have a significant influence on the physical information encoded in the respective spectra, as adjacent time steps are very close at the earlier epochs due to their logarithmic distribution.
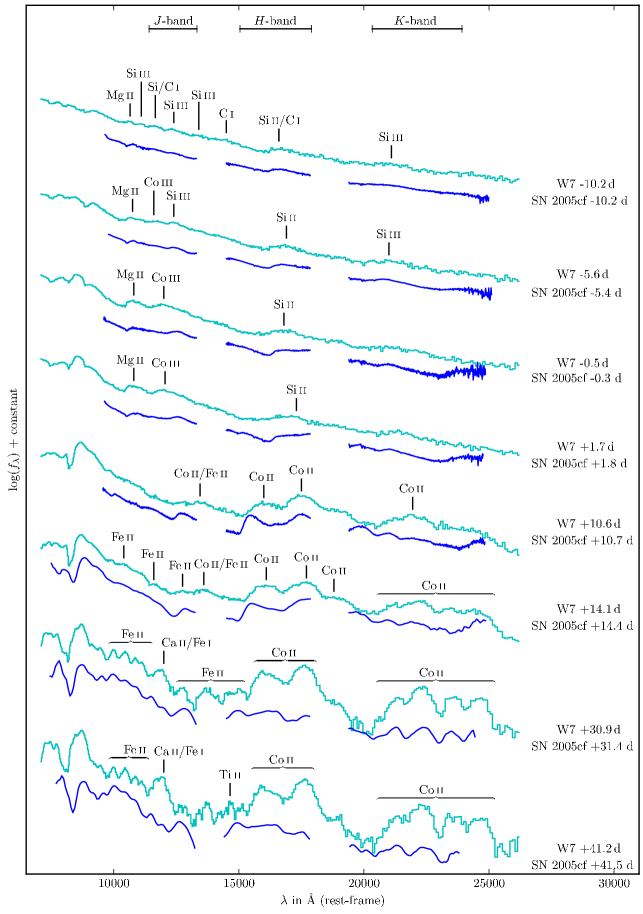
For comparison Fig. 6 also shows our NIR spectra of SN 2005cf at the corresponding epochs. In general, the agreement between our synthetic W7 spectra and SN 2005cf is quite good and it seems that the W7 model, designed only to fit optical spectra, can also represent NIR spectra at early epochs. That we identify many more features in the W7 spectrum at d than we can safely detect in SN 2005cf is not necessarily a flaw of W7. It could rather be due to the fact that these features are relatively weak (both in the SN and in the simulation) and we are only able to identify them for the W7 model because we can resolve the various contributions.
Ten days after -band maximum the agreement between the synthetic and the observed spectra starts to deteriorate redward of 14 000 Å. Although our W7 spectra reproduce the characteristic Co ii features which dominate this wavelength region at about the right epoch, their relative strengths do not always match those observed in SN 2005cf. Also there seems to be a small wavelength offset for the Co ii 15 500 Å feature. This, for example, might be explained by uncertainties in the atomic data. Many of the lines used in our simulations which are based on the atomic data of (Kurucz, 2006) are only theoretically predicted so that both oscillator strengths and resonance wavelengths could be at fault,666For example, for the Co ii lines given in Table 4 we compared the wavelengths found in the atomic data base of Kurucz (2006) with the corresponding level energy differences in the NIST database (http://www.nist.gov/pml/data/asd.cfm). From this we find typical offsets on the order of 300 km s-1. or some weaker lines may be missing completely. Kasen (2006) and Kromer & Sim (2009) have shown that this can have a significant influence on NIR observables. Moreover, the simplified excitation treatment used by artis (see Kromer & Sim 2009 for a detailed description) may lead to inaccurate populations of excited levels, particularly at late epochs when non-LTE effects become increasingly important.
An interesting result, which will be unaffected by the aforementioned uncertainties on a qualitative level, is the fact that starting two weeks after maximum the emission in the various NIR bands is dominated by different iron-group species. While the -band is dominated by Fe ii emission the - and -band emission originates mainly from Co ii (see Figs. 4 and 6). Since the ionisation potential of both species is of the same order, the and colours are potential probes to the Co/Fe-ratio in SNe Ia ejecta. Compared to the observed spectra of SN 2005cf, the W7 spectra have too much flux in the and bands relative to the band at these epochs (Fig. 6). This might indicate a deficiency of stable iron-group elements in the ejecta of W7. However, on a quantitative level the uncertainties in the atomic data and the radiative-transfer treatment currently prevent any firm conclusions on this issue.
4.4 Constraining the extension of the iron core
Like most other features in the NIR spectra of SNe Ia the four characteristic Co ii humps that dominate the -band spectrum a month after maximum light are blends. However, our simulation shows that in this case the number of involved transitions is comparatively small. In fact, the main contribution comes from no more than 8 Co ii emission lines, which are characterised by particularly low-lying upper levels. Apparently, the population of other Co ii levels from which -band transitions can originate is very low. The wavelengths and configurations for the 8 Co ii lines are given in Table 4.
| Wavelength | Upper level | Lower level | ||||
|---|---|---|---|---|---|---|
| (Å) | Conf. | Term | Conf. | Term | ||
| 3d7(4F)4p | z5F | 1 | 3d64s2 | a5D | 1 | |
| 3d7(4F)4p | z5F | 2 | 3d64s2 | a5D | 2 | |
| 3d7(4F)4p | z5F | 4 | 3d64s2 | a5D | 4 | |
| 3d7(4F)4p | z5F | 3 | 3d64s2 | a5D | 3 | |
| 3d7(4F)4p | z5F | 5 | 3d64s2 | a5D | 4 | |
| 3d7(4F)4p | z5F | 2 | 3d64s2 | a5D | 1 | |
| 3d7(4F)4p | z5F | 3 | 3d64s2 | a5D | 2 | |
| 3d7(4F)4p | z5F | 4 | 3d64s2 | a5D | 3 | |
We note that the small number of contributing lines makes it possible to deblend the -band region and derive the extension of the emitting Co-rich core independently from invoking a complex modelling machinery. As a simple recipe, this can be accomplished by fitting Gaussians to each contributing emission line, keeping the central wavelengths fixed and enforcing a common full width at half maximum (FWHM) in velocity space. The FWHM which – besides the individual intensities – is a fit parameter, then gives an estimate for the extension of the emitting Co-rich core. Note, however, that there is not necessarily a one-to-one correspondence between the two quantities so these velocities are only indicative.
Applying this technique to our spectra of SN 2005cf using 8 Gaussians corresponding to the aforementioned Co ii lines (Table 4), we find that the wavelength region between 20 800 Å and 25 000 Å is adequately reproduced with a FWHM velocity of 11 000 km s-1 for the spectra at +31 and +41 d. Slightly smaller FWHM velocities of 10 000 to 10 200 km s-1 are derived for the +29 d spectrum of SN 2002bo and the +32 and +42 d spectra of SN 1999ee.
These numbers are in rough agreement with the extension of the iron-group-element zone in W7 where those elements are abundant at the 10 per-cent level at a velocity of 10 600 km s-1, and drop to a mass fraction of 1 per cent at 12 300 km s-1. The fair match could already be expected from the rough agreement between the spectra of SN 2005cf and the model spectra of W7. It is, however, no validation of the W7 model, since in detail there are numerous other differences between the model and the observed spectrum.
5 Conclusions
We have presented NIR spectroscopy of SN 2005cf covering epochs from d to d with respect to -Band maximum. Together with archival data at other wavelengths this makes SN 2005cf one of the currently best-observed SNe Ia and allowed us to compile combined UV-optical-NIR spectra at five epochs between 8 d before and 10 d after maximum light. In this respect SN 2005cf is a unique object since to our best knowledge thus far only a single UV-through-NIR spectrum of a SN Ia has been published by Foley et al. (2012b) for SN 2011iv.
A comparison of our spectra to observations of SNe 1999ee (Hamuy et al., 2002a, b), 2002bo (Benetti et al., 2004) and 2003du (Stanishev et al., 2007) shows that SN 2005cf is a perfectly normal SN Ia at NIR wavelengths. A similar conclusion has already been drawn at optical wavelengths by Garavini et al. (2007), Pastorello et al. (2007) and Wang et al. (2009).
We have also performed radiative-transfer simulations to obtain NIR spectra for the standard hydrodynamical explosion model W7 (Nomoto et al., 1984). Comparing the obtained synthetic spectra to our spectra of SN 2005cf we find that W7 reproduces the key properties of normal SNe Ia not only at UV-optical as reported in earlier work (e.g. Branch et al., 1985; Kasen et al., 2006; Kromer & Sim, 2009; Foley et al., 2012b) but also at NIR wavelengths. From a detailed analysis of the emission processes in the radiative-transfer simulation we have identified the main spectral features in the NIR. We find only a single clear P-Cygni line: the Mg ii 10926 triplet which is present at early epochs. Apart from that the NIR part of the spectrum is almost devoid of absorption features. Instead, fluorescence is the driving mechanism that shapes the SED of SNe Ia. Before maximum light both intermediate-mass elements and iron-group elements contribute to the fluorescent emission. After maximum light almost all the flux originates from iron-group elements, though different iron-group species contribute to the various NIR bands. This makes the and colours a few weeks after maximum light potential probes to the ratio of different iron-group species. While most of the fluorescent emission is strongly blended, we find that the characteristic Co ii humps which form at about a month after maximum light in the band result from a series of relatively unblended lines. This provides a simple possibility to constrain the iron-group-element-rich regions of the ejecta from observed spectra.
Acknowledgments
The authors thank F. Bufano and V. Stanishev for providing archival observations. Additional data were obtained from the Online Supernova Spectrum Archive (SUSPECT).
This work was supported by the European Union’s Human Potential Programme ‘The Physics of Type Ia Supernovae’ under contract HPRN-CT-2002-00303, by the Deutsche Forschungsgemeinschaft via the Transregional Collaborative Research Center TRR 33 ‘The Dark Universe’ and the Excellence Cluster EXC153 ‘Origin and Structure of the Universe’. SB is partially supported by the PRIN-INAF 2009 with the project ‘Supernovae Variety and Nucleosynthesis Yields’.
Observations were collected at the ESO 8.2 m Very Large Telescope UT1 (Cerro Paranal, Chile, programme 075.D-0823) and the Italian 3.58 m Telescopio Nazionale Galileo (La Palma, Spain). We thank the astronomers at both observatories for their support. The simulations were carried out at the John von Neumann Institute for Computing (NIC) in Jülich, Germany (project hmu14/hmu20). Finally, we thank the reviewer for the thorough review and helpful comments.
References
- Benetti et al. (2005) Benetti S. et al., 2005, ApJ, 623, 1011
- Benetti et al. (2004) Benetti S. et al., 2004, MNRAS, 348, 261
- Bowers et al. (1997) Bowers E. J. C., Meikle W. P. S., Geballe T. R., Walton N. A., Pinto P. A., Dhillon V. S., Howell S. B., Harrop-Allin M. K., 1997, MNRAS, 290, 663
- Branch et al. (2009) Branch D., Dang L. C., Baron E., 2009, PASP, 121, 238
- Branch et al. (2006) Branch D. et al., 2006, PASP, 118, 560
- Branch et al. (1985) Branch D., Doggett J. B., Nomoto K., Thielemann F.-K., 1985, ApJ, 294, 619
- Bufano et al. (2009) Bufano F. et al., 2009, ApJ, 700, 1456
- Elias et al. (1985) Elias J. H., Matthews K., Neugebauer G., Persson S. E., 1985, ApJ, 296, 379
- Elias-Rosa et al. (2006) Elias-Rosa N. et al., 2006, MNRAS, 369, 1880
- Foley et al. (2012a) Foley R. J. et al., 2012a, ApJ, 744, 38
- Foley et al. (2012b) Foley R. J. et al., 2012b, ApJ, 753, L5
- Frogel et al. (1987) Frogel J. A., Gregory B., Kawara K., Laney D., Phillips M. M., Terndrup D., Vrba F., Whitford A. E., 1987, ApJ, 315, L129
- Garavini et al. (2007) Garavini G. et al., 2007, A&A, 471, 527
- Hamuy et al. (2002a) Hamuy M. et al., 2002a, AJ, 124, 417
- Hamuy et al. (2002b) Hamuy M. et al., 2002b, AJ, 124, 2339
- Harkness (1991) Harkness R., 1991, in European Southern Observatory Conference and Workshop Proceedings, Vol. 37, European Southern Observatory Conference and Workshop Proceedings, Danziger I. J., Kjaer K., eds., p. 447
- Höflich et al. (2002) Höflich P., Gerardy C. L., Fesen R. A., Sakai S., 2002, ApJ, 568, 791
- Höflich et al. (1993) Höflich P., Müller E., Khokhlov A., 1993, A&A, 268, 570
- Horne (1986) Horne K., 1986, PASP, 98, 609
- Iwamoto et al. (1999) Iwamoto K., Brachwitz F., Nomoto K., Kishimoto N., Umeda H., Hix W. R., Thielemann F.-K., 1999, ApJS, 125, 439
- Jack et al. (2011) Jack D., Hauschildt P. H., Baron E., 2011, A&A, 528, A141
- Jack et al. (2012) Jack D., Hauschildt P. H., Baron E., 2012, A&A, 538, A132
- Kasen (2006) Kasen D., 2006, ApJ, 649, 939
- Kasen et al. (2006) Kasen D., Thomas R. C., Nugent P., 2006, ApJ, 651, 366
- Kattner et al. (2012) Kattner S. et al., 2012, PASP, 124, 114
- Kirshner et al. (1993) Kirshner R. P. et al., 1993, ApJ, 415, 589
- Krisciunas et al. (2004) Krisciunas K., Phillips M. M., Suntzeff N. B., 2004, ApJ, 602, L81
- Kromer & Sim (2009) Kromer M., Sim S. A., 2009, MNRAS, 398, 1809
- Kurucz (2006) Kurucz R. L., 2006, in EAS Publications Series, Vol. 18, Radiative Transfer and Applications to Very Large Telescopes, Stee P., ed., EDP Sciences, pp. 129–155
- Maguire et al. (2012) Maguire K. et al., 2012, eprint arXiv:1205.7040
- Marion et al. (2009) Marion G. H., Höflich P., Gerardy C. L., Vacca W. D., Wheeler J. C., Robinson E. L., 2009, AJ, 138, 727
- Marion et al. (2003) Marion G. H., Höflich P., Vacca W. D., Wheeler J. C., 2003, ApJ, 591, 316
- Mazzali et al. (2005) Mazzali P. A. et al., 2005, ApJ, 623, L37
- Meikle (2000) Meikle W. P. S., 2000, 314, 782
- Meikle et al. (1996) Meikle W. P. S. et al., 1996, MNRAS, 281, 263
- Moorwood et al. (1999) Moorwood A. et al., 1999, The Messenger, 95, 1
- Motohara et al. (2006) Motohara K. et al., 2006, ApJ, 652, L101
- Nomoto et al. (1984) Nomoto K., Thielemann F.-K., Yokoi K., 1984, ApJ, 286, 644
- Pastorello et al. (2007) Pastorello A. et al., 2007, MNRAS, 376, 1301
- Perlmutter et al. (1999) Perlmutter S. et al., 1999, ApJ, 517, 565
- Phillips (1993) Phillips M. M., 1993, ApJ, 413, L105
- Phillips et al. (1999) Phillips M. M., Lira P., Suntzeff N. B., Schommer R. A., Hamuy M., Maza J., 1999, AJ, 118, 1766
- Pignata et al. (2008) Pignata G. et al., 2008, MNRAS, 388, 971
- Pinto & Eastman (2000) Pinto P. A., Eastman R. G., 2000, ApJ, 530, 757
- Riess et al. (1998) Riess A. G. et al., 1998, AJ, 116, 1009
- Riess et al. (2007) Riess A. G. et al., 2007, ApJ, 659, 98
- Röpke et al. (2012) Röpke F. K. et al., 2012, ApJ, 750, L19
- Rudy et al. (2002) Rudy R. J., Lynch D. K., Mazuk S., Venturini C. C., Puetter R. C., Höflich P., 2002, ApJ, 565, 413
- Schlegel et al. (1998) Schlegel D. J., Finkbeiner D. P., Davis M., 1998, ApJ, 500, 525
- Sim (2007) Sim S. A., 2007, MNRAS, 375, 154
- Spyromilio et al. (2004) Spyromilio J., Gilmozzi R., Sollerman J., Leibundgut B., Fransson C., Cuby J.-G., 2004, A&A, 426, 547
- Spyromilio et al. (1992) Spyromilio J., Meikle W. P. S., Allen D. A., Graham J. R., 1992, MNRAS, 258, 53P
- Spyromilio et al. (1994) Spyromilio J., Pinto P. A., Eastman R. G., 1994, MNRAS, 266, L17
- Stanishev et al. (2007) Stanishev V. et al., 2007, A&A, 469, 645
- Stehle et al. (2005) Stehle M., Mazzali P. A., Benetti S., Hillebrandt W., 2005, MNRAS, 360, 1231
- Stritzinger et al. (2002) Stritzinger M. et al., 2002, AJ, 124, 2100
- Taubenberger et al. (2011) Taubenberger S. et al., 2011, MNRAS, 412, 2735
- van Rossum (2012) van Rossum D. R., 2012, e-print ArXiv:1206.5463
- Wang et al. (2009) Wang X. et al., 2009, ApJ, 697, 380
- Wang et al. (2012) Wang X. et al., 2012, ApJ, 749, 126
- Wheeler et al. (1998) Wheeler J. C., Hoeflich P., Harkness R. P., Spyromilio J., 1998, ApJ, 496, 908