Quantum Oscillations in Iron Pnictide Superconductors
Abstract
Insight into the electronic structure of the pnictide family of superconductors is obtained from quantum oscillation measurements. Here we review experimental quantum oscillation data that reveal a transformation from large quasi-two dimensional electron and hole cylinders in the paramagnetic overdoped members of the pnictide family to significantly smaller three-dimensional Fermi surface sections in the antiferromagnetic parent members, via a potential quantum critical point at which an effective mass enhancement is observed. Similarities with the Fermi surface evolution from the overdoped to the underdoped normal state of the cuprate superconducting family are discussed, along with the enhancement in antiferromagnetic correlations in both these classes of materials, and the potential implications for superconductivity.
I Quantum Oscillations
Quantum oscillation measurements are a vital tool to characterise the electronic structure of metals. Originally conceived as a tool to probe elementary metals, quantum oscillations have grown in scope and have now been observed in complex intermetallics and oxides, including heavy fermions [1, 2], other unconventional superconductors [3, 4], and even doped Mott insulating cuprate superconductors [5, 6, 7, 8, 9, 10, 11, 12, 13]. The particular strength of quantum oscillations is their utility as a bulk probe of electronic structure, providing high momentum space resolution of constant energy surfaces at the Fermi energy.
In the presence of an applied magnetic field, a free electron gas whose surface of constant energy is spherical is arranged into a series of concentric cylinders known as ‘Landau tubes’ (fig. 1). Electron motion is now confined to the surface of these ‘Landau tubes’, resulting in quantised motion along ‘cyclotron orbits’. The quantisation of Landau tube areas arises from the quantum condition
| (1) |
where is the angular frequency of an electron executing cyclotron motion, given by
| (2) |
where is the effective cyclotron mass, and is the cross sectional area in reciprocal space of a constant energy Landau tube intersected by a plane normal to the magnetic field . From equations 1 and 2, the condition for Landau tube area quantisation is yielded as
| (3) |
When the magnetic field is increased, each Landau tube expands in area (shown in fig. 1), causing its height accommodated within the Fermi surface to shrink, until it spans the extremity of the Fermi surface (with extremal area ) just before it ‘pops’ out of the Fermi surface entirely. As each Landau tube pops out of the Fermi surface, there is a sudden discontinuous change in the total energy of the occupied states. Such an event happens periodically as tubes of successively small quantum numbers pass through the Fermi surface at equal intervals of (from eqn. 3). The frequency of Landau tubes popping out is given by
| (4) |
where is the magnetic flux quantum, is the area of the Brillouin zone in reciprocal space, and and are the unit cell dimensions in real space assuming a tetragonal lattice [14]. We label the frequency harmonics as , where represents the th harmonic. All derivatives of the free energy, such as magnetisation, consequently display oscillatory behaviour. These quantum oscillations in magnetisation are referred to as ‘de Haasvan Alphen’ oscillations, and in electrical transport are referred to as ‘Shubnikov de Haas’ oscillations [14]. The frequency of oscillations reflects the area of the extremal Fermi surface orbit. A complex Fermi surface geometry with multiple orbits, or a Fermi surface comprising multiple sections would yield an oscillatory signal comprising multiple frequencies, which can be analysed by filtering or Fourier transform methods.

I.1 Angular dependence
I.1.1 Fermi surface geometry
Quantum oscillations have an important role in characterising Fermi surface geometry, with the potential to reveal significant information about the physics of the systems studied, especially in strongly correlated systems. For instance, in heavy fermion systems, the geometry of the Fermi surface can reveal information about the participation or otherwise of -electrons in the electronic conduction of the system [1, 2]. In underdoped high temperature cuprate superconductors, quantum oscillations measurements of the Fermi surface geometry have proved an important indicator of likely Fermi surface reconstruction by a long range ordering wavevector [10, 11, 13].
The area of extremal orbits of the Fermi surface can be studied with great precision from the measured quantum oscillation frequencies. To further identify the momentum space location of the Fermi surface sections and map out the precise Fermi surface geometry, comparison with calculated theoretical band structures is typically required. Measurement of the quantum oscillation frequency as a function of the magnetic field direction specifies the extremal areas of the Fermi surface normal to all directions relative to the crystalline axes. This provides geometrical information about the Fermi surface that can be compared with band structure calculations. For a quasi-two dimensional Fermi surface, the angular dependence provides information relating to the -axis dispersion of the Fermi surface [15].
I.1.2 Spin splitting
The quantum oscillation amplitude as a function of angle is also modulated by an effect known as spin splitting: separate sets of Landau levels arise from spin-up and spin-down electrons, leading to a phase difference between oscillations from spin-up and spin-down electrons, and hence a modulation of the oscillation amplitude due to interference. Whereas the Zeeman splitting between spin up and spin down electrons is invariant with angle in the absence of significant spin-orbit effects, the Landau level separation is a function of the projected magnetic field for quasi-two dimensional systems, where is the angle between the applied magnetic field and the crystalline axis. The quantum oscillation amplitude as a function of angle is consequently modulated by a prefactor
| (5) |
where is the effective spin-splitting factor, and is the effective quasiparticle mass corresponding to a magnetic field applied at an angle to the crystalline -axis. In cases where the spins are ordered in such a way that the spin moment is suppressed, the interference term is not expected to appear potentially proving a diagnostic tool in detecting forms of spin order [11, 13].
II Magnetic field dependence
An important source of quantum oscillation amplitude modulation is ‘phase smearing’ (i.e.) effects occur that are equivalent to the superposition of oscillations over a finite phase window, resulting in an amplitude modulation of the net oscillations. One such amplitude reduction factor (, denoted by ) arises from a finite energy spread due to quasiparticle scattering time, and is given by
| (6) |
where ; represents the Landau level spacing, is the scattering time, is the mean free path, and is the cyclotron radius. As a consequence, crystal quality is paramount in observing sufficiently large quantum oscillations. The exponential rate of growth of the experimentally observed quantum oscillation amplitude with magnetic field yields a measure of the purity of the measured single crystal, with a faster rate of growth indicating a higher impurity concentration.
III Temperature Dependence
Another source of phase smearing is finite temperature. For quasiparticles with Fermi Dirac statistics, the temperature dependence of the quantum oscillation amplitude is governed by the sharp Fermi Dirac distribution that grows more rounded with increasing temperature. A reduction at finite temperatures in the abruptness with which the particle occupation as a function of energy vanishes causes phase smearing, and a consequent reduction in the amplitude of the measured quantum oscillations. In this case, the magnitude of amplitude reduction as a function of temperature is given by a derivative of the Fermi Dirac distribution
| (7) |
where , is the Boltzmann constant. For ,
where is expressed in terms of the Landau level spacing , analogous to the magnetic field dependent damping. A measure of quantum oscillation amplitude as a function of temperature is used to directly verify Fermi Dirac statistics [8], and to measure the effective cyclotron mass of elementary quasiparticles.
The enhancement in effective quasiparticle mass over the band mass is a direct measure of the strength of correlations, of particular importance in strongly correlated materials. A value of effective cyclotron mass is extracted by a fit to the temperature dependence of the experimentally measured quantum oscillation amplitude. The effective mass can furthermore, serve as a diagnostic of a quantum critical point at which a relevant susceptibility diverges. Quantum oscillations have proven an effective way to detect a quantum critical point, especially underlying an unconventional superconducting phase by measuring a divergent effective mass (i.e. a collapse in Fermi velocity) on the suppression of superconductivity by an applied magnetic field [1, 16]. Furthermore, the vicinity of a quantum critical point may be a propitious location in phase space to look for a breakdown of Fermi Dirac statistics, given that a divergence in effective mass signals a breakdown in the quasiparticle concept [17].
IV Iron Pnictide Superconductors
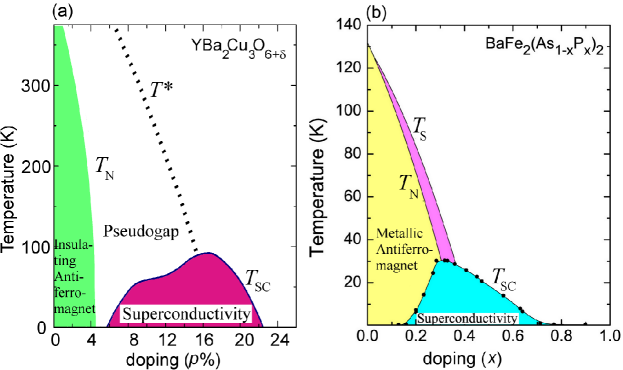
We now turn to the iron pnictide family of superconductors, and the measurements of quantum oscillations in these materials. A landmark advance in the field of superconductivity was made with the discovery of the family of superconducting iron pnictides [18, 19]. These tetragonal structure-type materials that contain tetrahedrally coordinated Fe2+ on a square lattice superconduct at temperatures as high as 56 K [20]. Proving next only to the copper oxide superconductors in superconducting temperatures, iron pnictide materials are of particular interest due to the unconventional nature of superconductivity they exhibit [21]. Materials include the ‘1111’ family with the ZrCuSiAs-structure type, containing FeAsO members (=rare earth) [18, 19, 20], the ‘122’ family with the ThCr2Si2-structure type, containing Fe2As2 (=alkaline earth, alkali metal) [22, 23, 24] members, the ‘111’ family with the Ce2Sb-structure type [25, 26, 27], containing FeAs members, and the ‘11’ family with the PbO-structure type, containing Fe (=chalcogen) [28] members, among others. Nearly all these materials such as the ‘1111’ and ‘122’ families are antiferromagnetic in their groundstate [22, 23, 29], and become superconducting on the application of either charge or isovalent chemical doping [19, 20, 30, 31, 32, 33, 34, 35] or the application of pressure [36, 37]. Intriguingly, the phase diagram of the pnictides has some broad similarities with other unconventional superconductors such as heavy fermions, organics, and high temperature cuprate superconductors [21] (shown in figure 2).
V Quantum oscillations in antiferromagnetic parent iron pnictides
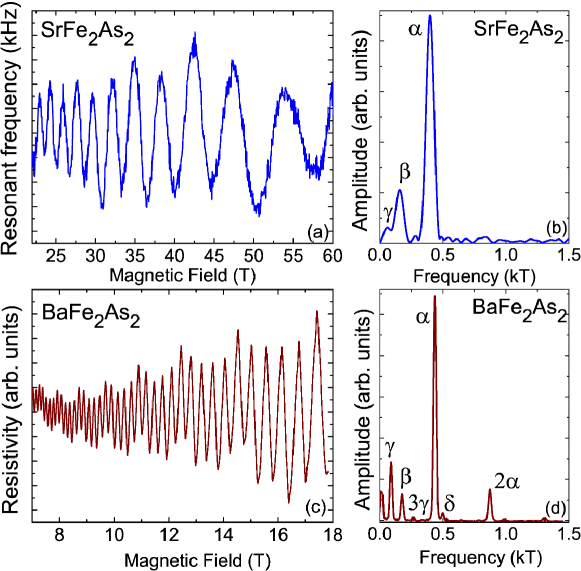
Soon after the discovery of superconductivity in the iron pnictide family of materials, quantum oscillations were discovered in the antiferromagnetic parent iron arsenide SrFe2As2 using the resonant oscillatory technique in a pulsed field magnet and torque magnetometry in a DC hybrid magnet [39], and the superconducting iron phosphide LaFePO using torque and resistivity techniques in superconducting and DC hybrid magnets [40]. Quantum oscillations have now been measured in other members of the pnictide family of superconductors including other ‘122’ and ‘111’ materials by a variety of experimental techniques including magnetic torque measurements, resonant oscillatory measurements, and electrical transport measurements in a range of magnets - from pulsed, to DC resistive and hybrid, to superconducting magnets [41, 42, 43, 44, 45, 46, 47, 48, 49, 50, 51, 40]. Here we focus on quantum oscillations in the parent and overdoped ‘122’ family and the evolution of quantum oscillations as a function of doping in these materials.
Figures 3a,c show a sample of quantum oscillations measured over different magnetic field ranges in single crystals of SrFe2As2 and detwinned single crystals of BaFe2As2, which are antiferromagnetic parent pnictides with ordering temperatures of 205 K and 140 K respectively [23, 22]. Prominent oscillations periodic in inverse magnetic field are measured in the field range 7 T to 60 T. Figures 3b,d show Fourier transforms of measured quantum oscillations in SrFe2As2 and BaFe2As2 over different field ranges. Low frequency Fourier peaks are observed at =370(20) T, =140(20) T, =70(20) T in SrFe2As2 [39], and at =500 T, =440 T, =170 T, =90 T in BaFe2As2 [43, 41].
V.1 Fermi surface geometry: nonmagnetic and antiferromagnetic bandstructure calculations
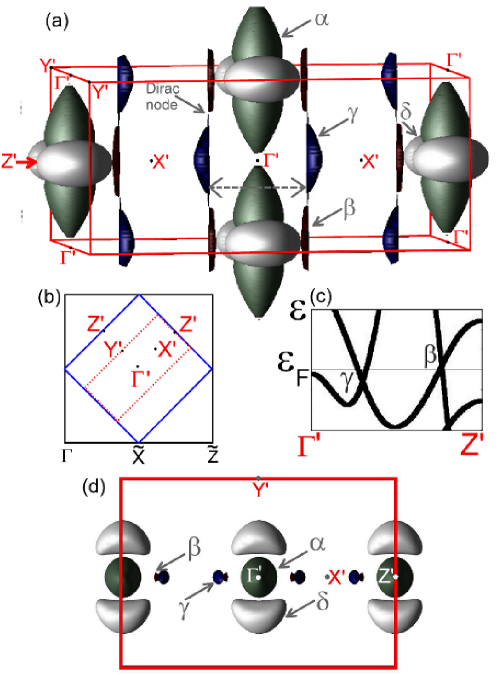
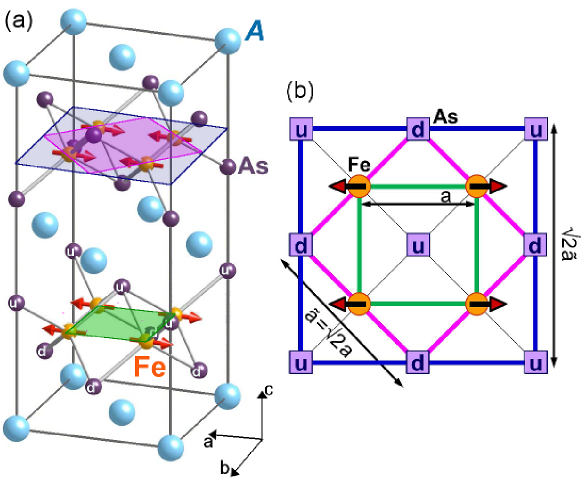
The crystal structure of the ‘122’ iron pnictide is shown in figure 4a. Shown in green in figures 4a,b is the basal plane unit cell containing a single Fe ion, of side . However, the alternating positioning of the As ions above (marked as ‘u’) and below (marked as ‘d’) the Fe-ion plane (shown in figures 4a,b) mean that the primitive unit cell contains two Fe ions. The basal plane unit cell containing two Fe ions of side (where ) is shown in pink in figures 4a,b. For the remainder of this chapter, we adopt this two-Fe ion notation in describing the unit cell and the Brillouin zone, and the ordering wavevector within the Brillouin zone. An alternate convention arises on noting that the low energy part of the electronic structure is equivalent to a Brillouin zone that is twice as large, and corresponds to a unit cell in dimension, containing a single Fe ion. The first convention can be related to the second, by noting that the and points in the one-Fe unit cell correspond to the point in the two-Fe unit cell. In the nonmagnetic state, local density approximation (LDA) calculations yield an electronic structure of Fe2As2 that comprises two electron-like surfaces near the point, and two hole surfaces near the point (shown in fig. 5) [39, 53].
It is clear that the experimentally measured Fermi surface sections, each occupying of nonmagnetic Brillouin zone ( of Brillouin zone area occupied by each Fermi surface section shown in table 1) are vastly smaller in size than the quasi-two-dimensional sections occupying up to of the nonmagnetic Brillouin zone expected in the calculated nonmagnetic bandstructure. A Fermi surface transformation into sections of much smaller size is expected from reconstruction due to an additional superstructure, which would increase the size of the unit cell in real space, thereby reducing the size of the Brillouin zone in momentum space, and causing the Fermi surface to break up into smaller sections. Such a superstructure in antiferromagnetic Fe2As2 might be expected to occur at the quasi-nesting wavevector between the electron and hole pockets which are separated in momentum space in the nonmagnetic electronic structure, given the enhanced Lindhard function in the vicinity of this wavevector [54, 55, 56, 57]. Indeed, the onset of an antiferromagnetic wavevector at the Nel temperature has been measured by inelastic neutron scattering in the parent pnictide materials, in which neighbouring Fe moments are arranged parallel to each other along one direction, and antiparallel to each other along the orthogonal direction (shown in figure 4) [29]. In SrFe2As2 and BaFe2As2, a spin moment of per Fe ion is measured [60, 59], and indications from the breadth of the measured high energy dispersion are that the spin density wave is itinerant in character [61].
| SrFe2As2 | BaFe2As2 | |||||||
|---|---|---|---|---|---|---|---|---|
| Fermi surface | ||||||||
| (hole) | 2.0(1) | 2.1(1) | ||||||
| (Dirac) | 1.5(1) | 1.8 | ||||||
| (Dirac) | 0.9 | |||||||
| (electron) | 2.4(3) | |||||||
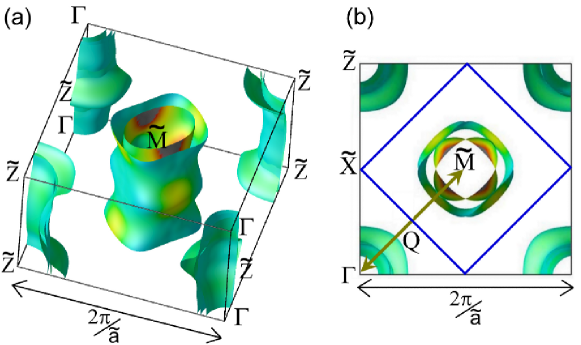
The anticipated electronic structure in this parent antiferromagnetic state as a consequence of the ordering wavevector is yielded by folding the non-magnetic Brillouin zone shown in Figure 5a along the magnetic wavevector , such that the point is folded onto the point. The unit cell in the basal plane is therefore doubled, yielding the antiferromagnetic unit cell shown in dark blue in figures 4a,b. The resulting Brillouin zone is reduced in size from the black square shown in figure 5a,b to the blue diamond shown in figure 5b. The reduction in size of the Brillouin zone results in the superposition of the hole pocket at , and the electron pocket at , causing a gapping of large sections of the original Fermi surface, and leaving behind small three-dimensional hole and electron pockets (shown in figure 6) [39]. Figure 6 shows the result of a local density approximation calculation of the antiferromagnetic state of SrFe2As2 in which magnetic ordering is included; a value of negative on-site Coulomb repulsion is used that suppresses the magnetic moment to the experimentally observed value of [45, 41]. The calculated antiferromagnetic Fermi surface (figure 6a,d) is seen to comprise small three dimensional Fermi surface pockets in contrast to the larger quasi-two dimensional Fermi surface sections expected in the nonmagnetic electronic structure (figure 5).
V.2 Experimental comparison with bandstructure
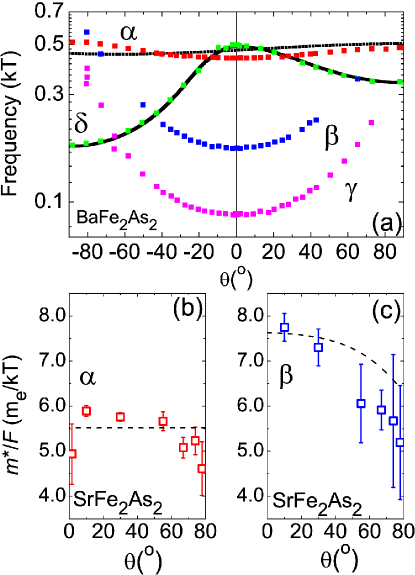
Table 1 shows the measured quantum oscillation frequencies and effective quasiparticle masses in the antiferromagnetic parent pnictide SrFe2As2 and BaFe2As2, along with the effective mass enhancement of each Fermi surface section, and fraction of the original two-Fe ion Brillouin zone area occupied by each Fermi surface section. The size and angular dependence of the measured quantum oscillation frequencies that correspond to the extremal orbits of the Fermi surface pockets are compared with expectations from the calculated antiferromagnetic bandstructure in figure 7. Figure 7a shows a comparison of the angular dependence of extremal orbits expected from the calculated band structure, with an angular dependence of the measured quantum oscillation frequencies in BaFe2As2 [43]. The observed frequencies extend over the entire angular range, and are weakly angle-dependent, indicating largely three-dimensional Fermi surface sections. Good agreement between experimental and calculated frequencies is seen for the and frequencies for a band shift of -44meV and +65meV respectively for the bands corresponding to the larger electron-like pocket and hole-like pocket shown in figure 6. Interestingly, this band shift corresponds to a calculated magnetic moment of 1.6 per Fe ion, which overestimates the experimentally measured magnetic moment of 0.9 per Fe ion, potentially indicating the relevance of fully magnetic models in describing the parent antiferromagnetic pnictide materials.
The identification of the and pocket is less unambiguous, given their extremely small size, as seen in figure 6. A more detailed study of these small Fermi surface pockets is presented in section V.3. Using the observed enhancement in effective mass compared to the calculated band mass for the Fermi surface pockets measured in SrFe2As2 and BaFe2As2 (table 1), the contribution to the Sommerfeld coefficient from the measured pockets is estimated to be 3.5 mJ/K2mol for SrFe2As22 and 5.0 mJ/K2mol for BaFe2As2, in good agreement with measured values of heat capacity [39, 41, 43]. The modest effective mass enhancement places these materials in a regime of intermediate correlation strength. Quantum oscillation measurements of the Fermi surface in the parent Fe2As2 family enables experimental identification of the reconstructed Fermi surface as corresponding to the calculated antiferromagnetic bandstructure in this material, reconstructed from the original bandstructure by an ordering wavevector .
V.3 Dirac Nodes
A more in-depth comparison is required to identify the topology of the smallest and pockets observed in the Fermi surface of antiferromagnetic SrFe2As2 and BaFe2As2. A theoretical analysis shows that the experimentally observed spin density wave gives rise to symmetry-enforced band degeneracy at high-symmetry points in the Brillouin zone, the experimentally observed spin density wave with ordering wavevector resulting in a nontrivial band topology. Even were nesting to be perfect, topological protection would preserve the Dirac nodes that result for such a band topology, thereby preventing full gapping of the Fermi surface by the spin density wave; a conclusion that has been shown to survive the introduction of strong interactions [62]. The location of Dirac nodes which are located close to the Fermi energy in the case of antiferromagnetic SrFe2As2 and BaFe2As2 [41, 44, 45] (shown in figure 6) yields small Dirac pockets. The geometry of the small closed Dirac pockets with pointed ends is not sufficient to distinguish these from ellipsoidal pockets; a true test of such a Dirac point can only be yielded by a comparison of the angular dependence of the associated frequency and effective cyclotron mass, in this case, for the and pockets. For a parabolic band, this ratio would remain constant; for a linear crossing, however, the angular-dependent ratio of the frequency and effective cyclotron mass is expected to deviate from a constant value. For a linear dispersion of the form where is the bilayer spacing for the body-centred-tetragonal crystal structure (12.3 Å), is the characteristic Dirac velocity, is the interlayer hopping parameter, , and is the chemical potential, a striking experimental signature is expected. As is increased, the orbits would begin to encompass regions of the Fermi surface close to the Dirac point (fig. 6 left inset), where velocities are high and masses are very light - leading to a reduction in orbitally averaged cyclotron masses, and consequently a rapid reduction in with angle compared to the expectation for a parabolic band [42, 44].
Figures 7b,c show the ratio of as a function of angle for both the pocket and the pocket in SrFe2As2. The ratio remains largely constant as a function of angle for the pocket, consistent with its parabolic band origin. However, the ratio dips steeply with angle in the case of the pocket, as would be expected for a pocket associated with linear band crossing at a Dirac point [44]. The linear dispersion characteristic of a Dirac cone is also directly observed via photoemission experiments [63]. The Fermi surface of the antiferromagnetic parent ‘122’ pnictide family is therefore seen to exhibit Dirac points as a consequence of the orbital character of the bands in this material [44, 45, 62].
VI Quantum oscillations in overdoped paramagnetic iron pnictides

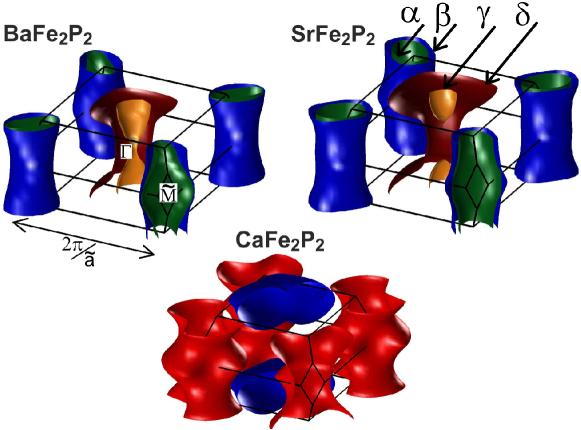
Quantum oscillations have been observed in the end Fe2P2 members of the superconducting ‘122’ pnictide family (fig. 2) [46, 47, 48]. Figure 8 shows quantum oscillations measured on SrFe2P2 [46]. The first noticeable aspect of these oscillations is that the measured frequencies are considerably higher than in the parent antiferromagnetic parent member of the series (fig. 3), indicating larger Fermi surface sections (measured frequencies and the size of the corresponding Fermi surface cross sectional area as a fraction of the original two-Fe ion Brillouin zone are shown in table LABEL:tableover). The Fourier transform in figure 8b shows the component frequencies in the measured quantum oscillations, the angular dependence of which is shown in figure 8c. A band structure calculation of the expected Fermi surface of SrFe2P2 consists of two concentric electron cylinders located at the Brillouin zone corners (i.e. the point), and two hole cylinders centred at the point (figure 9), which is very similar to that calculated for the nonmagnetic phase of SrFe2As2 (figure 5a). Some band structure calculations [64] and photoemission experiments [65] experiments indicate an additional third hole pocket located at the point, that is more three-dimensional in character.
Measured quantum oscillation frequencies and effective mass enhancements are shown in table LABEL:tableover for SrFe2P2 and BaFe2P2. These yield experimental results that correspond well with band structure calculations, with the largest frequency corresponding to a cross-sectional area as large as the size of the original two-Fe ion Brillouin zone. Figures 8c,d show the angular dependence of the experimentally measured quantum oscillation frequencies compared with the predictions for the calculated band structure in SrFe2P2. Good agreement is obtained on shifting electron bands and up by 59 and 49 meV respectively, and the hole band down by 110 meV [46] in the calculated band structure. Using the observed enhancement in effective mass compared to the calculated band mass for the Fermi surface pockets measured in SrFe2P2, the contribution to the Sommerfeld coefficient from the measured Fermi surface pockets is estimated to be 10.4(2) mJ/mol/K2, in good agreement with the value of 11.6(2) mJ/mol/K2 measured by heat capacity. The size of quasiparticle effective mass enhancement places these materials in a regime of intermediate correlation strength. The significant transformation in Fermi surface from nonmagnetic end members of the ‘122’ series to the antiferromagnetic parent members of this family of materials is discussed more in Section VII.2.
VI.1 Quasi-nesting of hole and electron cylinders
An important aspect of the Fermi surface geometry revealed by quantum oscillations in the Fe2P2 end members of the ‘122’ family is the significant axis dispersion (i.e. warping) of all the Fermi surface sections, rendering them more three dimensional instead of two dimensional. It is also obvious that while the Lindhard function (representing the bare spin susceptibility) is expected to have a maximum at , a perfect nesting condition is not satisfied by the pocket geometry. Nesting effects are far from ideal in either the unreconstructed band structure of the antiferromagnetic parent members (figure 5), or the measured Fermi surface of the end members of the pnictide family (figure 9), making it unlikely that these effects are principally responsible for antiferromagnetism.
| SrFe2P2 | BaFe2P2 | |||||||
|---|---|---|---|---|---|---|---|---|
| Fermi surface | ||||||||
| (hole) | 1.49(2) | 1.64 | ||||||
| (hole) | 1.6(1) | 2.30 | ||||||
| (hole) | 3.41(5) | 3.32 | ||||||
| (electron) | 1.92(2) | 1.65 | ||||||
| (electron) | 2.41(3) | 1.54 | ||||||
| (electron) | 1.75 | |||||||
| (electron) | 1.58 | |||||||
Quantum oscillation measurements have been performed on the other end members of the ‘122’ pnictide family: BaFe2P2, and CaFe2P2 [47, 48, 49]. Figure 9 shows the calculated Fermi surface geometry corresponding to quantum oscillations measured in each of these families of materials [46, 47, 48, 66]. On traversing the periodic table from the Ba members of the series, to the Sr and Ca members of the series, an interesting evolution is seen. The pocket sizes and geometries in SrFe2P2 and BaFe2P2 are fairly similar, with the chief difference being the better fulfilment of nesting criteria between inner hole () and outer electron () pockets in BaFe2P2. The Fermi surface sections in CaFe2P2, however, become particularly different, with the outer electron pockets becoming more warped, and the central warped concentric hole cylinders in BaFe2P2 and SrFe2P2 transforming into a single three dimensional surface in CaFe2P2 (figure 9). In fact, the electronic structure in CaFe2P2 corresponds to that of the collapsed tetragonal structure, where the ratio of -axis to -axis lattice constant is significantly reduced from the orthorhombic parent antiferromagnetic structure [33]. A potential relation of the increased quasi-three dimensionality in CaFe2P2 to the reduced optimal- in this families of materials (optimal K in BaFe2(As1-xPx)2 and SrFe2(As1-xPx)2, compared to optimal K in CaFe2(As1-xPx)2) is consequently indicated [35, 32, 33].
VII Cuprates and iron pnictides - electronic structure comparison
Importantly, quantum oscillations are a key tool in making a comparison between the normal state of the cuprate and pnictide superconductors. At first glance, the cuprate and pnictide phase diagrams appear similar, both manifesting an antiferromagnetic parent groundstate that evolves to a superconducting state with elevated superconducting temperatures on doping (figure 2). However, the metallic antiferromagnetic groundstate of the pnictide superconductors persists with doping, overlapping with the superconducting region over a significant portion of the phase diagram, up to optimal dopings. In contrast, the antiferromagnetic Mott insulating groundstate of the cuprates persists over a narrow range with doping, and is separated in doping from the onset of the superconducting dome. A key question pertains to the nature of the normal state of the cuprates in the underdoped region of superconductivity. Low frequency quantum oscillations were discovered after two decades in the underdoped region of the phase diagram in the cuprate superconductor YBa2Cu3O6+δ at hole dopings (i.e. ), corresponding to a Fermi surface of area of the original Brillouin zone [5, 8, 9, 11, 12, 13, 10]. Quantum oscillations have subsequently been observed in other underdoped cuprate superconductors, including YBa2Cu4O8 [6, 7] and Nd2-xCexCuO4 [67], revealing similarly small Fermi surface sections.
VII.1 Enhancement in Lindhard function in pnictides and cuprates
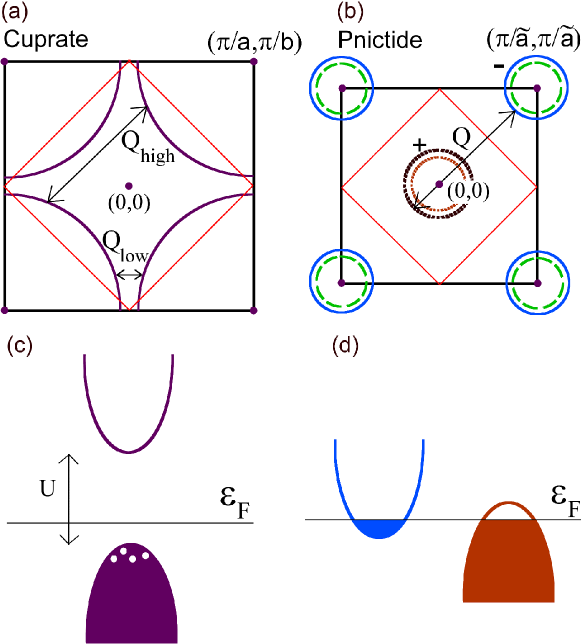
An interesting comparison can be drawn between the Fermi surface in the cuprates and the pnictides with possible relevance to the origin of superconductivity in these materials [68]. At first sight, the nonmagnetic Fermi surface in the cuprate materials appears very different from the pnictide materials. The pnictide family of materials belong to the class of compensated semimetals, with an electronic structure comprising both hole and electron pockets these are separated in momentum space, as seen in figures 5,9. In contrast, the cuprate materials are effectively single band in character. A significant Jahn-Teller distortion in the quasi-two dimensional cuprates removes the degeneracy of the two-fold orbital in copper, and leads to an effective single orbital model. The intra-orbital Coulomb interaction causes the half filled band to be split into a filled lower Hubbard and an empty upper Hubbard band (fig. 10c), yielding a Mott insulating ground state. On doping mobile carriers as shown in figure 10c, a single carrier band is yielded. The electronic structure on the overdoped hole-carrier side has been measured by angular magnetoresistance oscillations, quantum oscillations, and angle resolved photoemission, revealing a single hole surface centred at the point of the Brillouin zone (schematic shown in figure 10a) [69, 13]. A single hole band occupying of the original Brillouin zone has been observed by quantum oscillations on the overdoped side of the hole-doped cuprate superconductor Tl2Ba2CuO6+δ [69].
A notable commonality, however, is seen between the electronic structure of the cuprate and pnictide families on identifying the quasi-nesting wavevector associated with a peak in the Lindhard function in both these cases. In the case of the pnictide materials, a quasi-nesting wavevector connects the electron pockets at the location with the hole pockets at the location in the pnictides, manifesting itself as a peak in the Lindhard function [54, 55, 56, 57, 58]. The system then becomes unstable to an excitonic instability (i.e.) a combination of electrons and holes with relative momentum wavevector , experimentally found to be manifested as an antiferromagnetic spin density wave [70]. Indeed, this ordering wavevector at which the Lindhard function is maximised is responsible for Fermi surface reconstruction into the observed small Fermi surface sections in the parent members of the pnictide family.
In the case of the cuprates, an intraband wavevector connecting opposite sides of the single large band and associated with antiferromagnetic correlations is found to enhance the Lindhard function [71]. In this case, the Lindhard function is also enhanced at small wavevectors such as , which is associated with charge density wave type of order, and has been related to Fermi surface reconstruction into the small Fermi surface sections observed by quantum oscillations in the underdoped regime [13]. The wavevector associated with antiferromagnetic correlations at which the Lindhard function is enhanced in both pnictide and cuprate families of materials could contribute to the enhancement of superconducting temperatures in these and other unconventional superconductors [72, 21, 68]. A possible test of the relevance of antiferromagnetic correlations in contributing to elevated superconducting temperatures is in the case of multiband systems where the location of electron and hole pockets coincide in momentum space; here the contribution of antiferromagnetic correlations to superconductivity would be expected to be suppressed.
VII.2 Quantum critical point under superconducting dome
Models involving electronic mediation have been suggested to explain unconventional superconductivity in materials such as the cuprates and pnictides. In these models, an enhancement in electronic susceptibility, such as for example the density or magnetic susceptibility is anticipated to favour superconductivity [72]. While qualitative insight may be gained from the Lindhard function which represents the bare spin susceptibility, an experimentally determined electronic susceptibility is the best indication of where maximally enhanced superconductivity may be expected within such models. A magnetic instability manifested as a quantum critical point at zero temperature would yield an enhanced spin susceptibility. An attendant challenge, however, pertains to experimentally accessing the vicinity of a quantum critical point, given that a new phase such as superconductivity often conceals the notional quantum critical point. Quantum oscillations provide a good experimental probe in the vicinity of a quantum critical point, at which the effective quasiparticle mass would be expected to diverge.
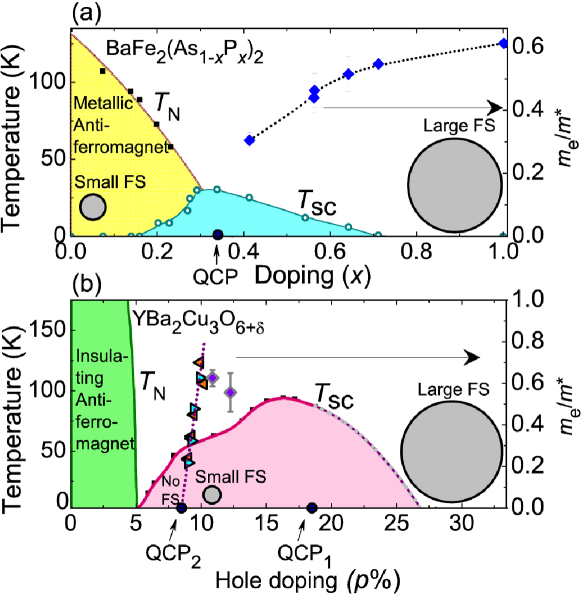
In the case of pnictide superconductors, superconductivity can be suppressed sufficiently by applied magnetic fields up to 65 T, such that quantum oscillations are observed in the doping range in the BaFe2(As1-xPx)2 family [73]. The doping range accessed by quantum oscillations extends very close to optimal doping and reaching dopings at which the superconducting temperatures are as high as K (). Intriguingly, an increase in effective mass, corresponding to a fall in Fermi velocity is observed in the region approaching optimal doping (shown in figure 11a). The Fermi surface geometry remains largely unchanged above optimal doping, corresponding to quasi-nested warped cylindrical electron and hole pockets at the and points of the Brillouin zone respectively, which reduce in size by from to [73]. A drastic change is, however, observed compared to the Fermi surface geometry in the undoped regime, in which the largest Fermi surface extremal area is approximately five times smaller than the largest Fermi surface extremal area for . The decrease in Fermi velocity between and in BaFe2(As1-xPx)2 is consistent with an ultimate collapse of Fermi velocity (proportional to the inverse effective quasiparticle mass) at a quantum critical point located at the doping where the antiferromagnetic phase boundary would end, were superconductivity to be absent. The collapse in Fermi velocity approaching optimal doping is consistent with a divergent magnetic susceptibility at an antiferromagnetic instability marking the notional quantum critical point underlying the superconducting maximum.
In the case of cuprate superconductors, a drastic change is observed between the Fermi surface extremal area in the overdoped regime and in the underdoped regime, where the extremal area is less than thirty times smaller than in the overdoped regime. However, the use of quantum oscillations to detect evidence for a divergent effective mass at optimal doping separating these two regimes has proved challenging given the robustness of superconductivity in this region of the phase diagram, and the high magnetic fields required to suppress superconductivity. Intriguingly, quantum oscillations measured up to 85 T observe a steep increase in effective cyclotron mass, corresponding to a collapse in Fermi velocity approaching a lower doping (hole doping (i.e. ) in YBa2Cu3O6+δ) in the vicinity of a plateau (local maxima) in the superconducting dome (figure 11b) [16]. In this case, the nature of the enhanced susceptibility associated with the quantum critical point signalled by the rapid collapse in Fermi velocity has not yet been precisely ascertained, but is likely associated with the onset of a spin density wave below this doping, and charge density wave above this doping [13].
In both these families of cuprate and pnictide superconductors, and in other families of unconventional superconductors [21], similar quantum critical points located at a magnetic or other form of instability underlying the superconducting dome maximum appear consistent with common mechanisms of unconventional superconductivity mediation [72]. Quantum oscillations that directly measure the effective quasiparticle mass are a crucial tool in revealing the divergent susceptibility signalling such a quantum critical point in diverse families of materials. A broader question pertains to whether such a potential quantum critical point underlying the superconducting dome is related to the observed enhancement in superconducting temperatures.
VIII Conclusion
The measurement of quantum oscillations in the pnictide family of superconductors has greatly advanced our understanding of these materials. A Fermi surface comprising quasi-two dimensional hole and electron cylinders at the and points of the two-Fe ion Brillouin zone respectively in the overdoped paramagnetic side of the phase diagram evolves to a Fermi surface comprising small three-dimensional sections in the antiferromagnetic parent pnictide material via a potential quantum critical point where the quasiparticle effective mass is enhanced. The quasi-nesting wavevector that connects sections of the Fermi surface, and the potential quantum critical point under the superconducting dome appear to be common features of the pnictide with the cuprate family of superconductors. While enhanced antiferromagnetic correlations appear both in pnictide and cuprate superconductors, an open question still pertains to their relation to elevated superconducting temperatures.
IX Acknowledgements
SES acknowledges support from the Royal Society and King’s College, University of Cambridge, and thanks A. V. Chubukov, M. D. Johannes, G. G. Lonzarich, and I. I. Mazin for useful discussions.
X Bibliography
References
- [1] R. Settai, H. Shishido, T. Kubo, S. Araki, T. C. Kobayashi, H. Harima, Y. Onuki, Drastic change of the electronic states at the quantum critical point in heavy fermions, J. Magn. Mag. Matls. 310, 541–547, (2007).
- [2] S. E. Sebastian, N. Harrison, C. D. Batista, S. A. Trugman, V. Fanelli, M. Jaime, T. P. Murphy, E. C. Palm, H. Harima, and T. Ebihara, Heavy holes as a precursor to superconductivity in antiferromagnetic CeIn3, Proc. Natl. Acad. Sci. 106, 7741–7744, (2009).
- [3] C. Bergemann, S. R. Julian, A. P. Mackenzie, S. NishiZaki and Y. Maeno, Detailed topography of the Fermi surface of Sr2RuO4, Phys. Rev. Lett. 84, 2662–2665, (2000).
- [4] J. Wosnitza, Fermi Surfaces of Low-Dimensional Organic Metals and Superconductors, Springer, New York, (1996).
- [5] N. Doiron-Leyraud, C. Proust, D. LeBoeuf, J. Levallois, J.-B. Bonnemaison, R. X. Liang, D. A. Bonn, W. N. Hardy, and L. Taillefer, Quantum oscillations and the Fermi surface in an underdoped high- superconductor Nature 447, 565–568, (2007).
- [6] E. A. Yelland, J. Singleton, C. H. Mielke, N. Harrison, F. F. Balakirev, B. Dabrowski, & J. R. Cooper, Quantum Oscillations in the Underdoped Cuprate YBa2Cu4O8 Phys. Rev. Lett. 100 047003, (2008)
- [7] A. F. Bangura, J. D. Fletcher, A. Carrington, J. Levallois, M. Nardone, B. Vignolle, P. J. Heard, N. Doiron-Leyraud, D. LeBoeuf, L. Taillefer, S. Adachi, C. Proust, N. E. Hussey, Small Fermi Surface Pockets in Underdoped High Temperature Superconductors: Observation of Shubnikov de Haas Oscillations in YBa2Cu4O8 Phys. Rev. Lett. 100 047004, (2008).
- [8] S. E. Sebastian, N. Harrison, C. H. Altarawneh, R. X. Liang, D. A. Bonn, W. N. Hardy, & G. G. Lonzarich, Fermi-liquid behavior in an underdoped high- superconductor Phys. Rev. B 81 140505, (2010).
- [9] S. E. Sebastian, N. Harrison, E. Palm, T. P. Murphy, C. H. Mielke, R. X. Liang, D. A. Bonn, W. N. Hardy, & G. G. Lonzarich, A multi-component Fermi surface in the vortex state of an underdoped high- superconductor Nature 454 200-203, (2008).
- [10] A. Audouard, C. Jaudet, D. Vignolles, R. X. Liang, D. A. Bonn, W. N. Hardy, L. Taillefer, & C. Proust, Multiple quantum oscillations in the de Haasvan Alphen spectra of the underdoped high-temperature superconductor YBa2Cu3O6.5, Phys. Rev. Lett. 103 157003, (2009).
- [11] B. J. Ramshaw, B. Vignolle, J. Day, R. X. Liang, W. N. Hardy, C. Proust, D. A. Bonn, Angle dependence of quantum oscillations in YBa2Cu3O6.59 shows free-spin behaviour of quasiparticles Nature Phys. 7 234-238, (2011).
- [12] S. E. Sebastian, N. Harrison, R. Liang, D. A. Bonn, W. N. Hardy, C. Mielke, & G. G. Lonzarich, Quantum oscillations from nodal bilayer magnetic breakdown in the underdoped high temperature superconductor YBa2Cu3O6+x Phys. Rev. Lett. 108 196403, (2012).
- [13] S. E. Sebastian, N. Harrison and G. G. Lonzarich, Towards resolution of the Fermi surface in underdoped high- superconductors Rep. Prog. Phys. in proof, (2012).
- [14] D. Shoenberg, Magnetic Oscillations in Metals (Cambridge: Cambridge University Press), (1984).
- [15] K. Yamaji, On the Angle Dependence of the Magnetoresistance in Quasi-Two-Dimensional Organic Superconductors, J. Phys. Soc. Jpn. 58 1520–1523, (1989).
- [16] S. E. Sebastian, N. Harrison, M. M. Altarawneh, C. H. Mielke, R. Liang, D. A. Bonn, W. N. Hardy, G. G. Lonzarich, Metal-Insulator quantum critical point beneath the high superconducting dome, Proc. Natl. Acad. Sci. 107 6175–6179, (2010).
- [17] P. Coleman, C. Pepin, Q. Si, and R. Ramazashvili, How do Fermi liquids get heavy and die? J. Phys.: Condens. Matter 13 R723–R738, (2001).
- [18] Y. Kamihara, H. Hiramatsu, M. Hirano, R. Kawamura, H. Yanagi, T. Kamiya and H. Hosono, Iron-based layered superconductor: LaOFeP, J. Am. Chem. Soc. 128 10012, (2006).
- [19] Y. Kamihara, T. Watanabe, M. Hirano and H. Hosono, Iron-based layered superconductor La[O1-xFx]FeAs () with Tc =26 K, J. Am. Chem. Soc. 130 3296–3297, (2008).
- [20] Z. Ren, W. Lu, J. Yang, W. Yi, X. Shen, Z. Li, G. Che, X. Dong, Li. Sun, F. Zhou, Z. Zhao, Superconductivity at 55 K in Iron-based F-doped Layered Quarternary Compound SmO1-xFxFeAs, Chin. Phys. Lett. 25, 2215, (2008).
- [21] M. R. Norman. The Challenge of Unconventional Superconductivity, Science 332, 196–200, (2011).
- [22] M. Rotter, M. Tegel, D. Johrendt, I. Schellenberg, W. Hermes and R. Pöttgen, Spin-density-wave anomaly at 140 K in the ternary iron arsenide BaFe2As2, Phys. Rev. B 78 020503, (2008).
- [23] C. Krellner, N. Caroca-Canales, A. Jesche, H. Rosner, A. Ormeci, and C. Geibel, Magnetic and structural transitions in layered iron arsenide systems: Fe2As2 versus FeAsO, Phys. Rev. B. 78 100504(R), (2008).
- [24] J. K. Dong, S. Y. Zhou, T. Y. Guan, H. Zhang, Y. F. Dai, X. Qiu, X. F. Wang, Y. He, X. H. Chen, and S. Y. Li, Quantum Criticality and Nodal Superconductivity in the FeAs-Based Superconductor KFe2As2, Phy. Rev. Lett., 104, 087005, (2010).
- [25] X. C. Wang, Q. Q. Liu, Y. X. Lv, W. G. Gao, L. X. Yang, R. C. Yu, F. Y. Li, and C. Q. Jin, The superconductivity at 18 K in LiFeAs system, Solid State Commun. 148, 538 (2008).
- [26] J. H. Tapp, Z. Tang, B. Lv, K. Sasmal, B. Lorenz, P. C. W. Chu, and A. M. Guloy, LiFeAs: An intrinsic FeAs-based superconductor with K, Phys. Rev. B 78, 060505 (2008).
- [27] M. J. Pitcher, D. R. Parker, P. Adamson, S. J. C. Herkelrath, A. T. Boothroyd, R. M. Ibberson, M. Brunelli, and S. J. Clarke, Structure and superconductivity of LiFeAs, Chem. Commun., 5918–5920, (2008).
- [28] F.-C. Hsu, J.-Y. Luo, K.-W. Yeh, T.-K. Chen, T.-W. Huang, P. M. Wu, Y.-C. Lee, Y.-L. Huang, Y.-Y. Chu, D.-C. Yan, et al., Superconductivity in the PbO-type structure -FeSe, Proc. Nat. Acad. Sci. (USA) 105, 14262, (2008).
- [29] C. de la Cruz, Q. Huang, J. W. Lynn, J. Y. Li, W. Ratcliff, II, J. L. Zaretsky, H. A.Mook, G. F. Chen, J. L. Luo, N. L. Wang, & P. Dai, Magnetic order close to superconductivity in the iron-based layered LaO1-xFxFeAs, Nature (London) 453, 899 (2008).
- [30] M. Rotter, M. Tegel, and D. Jorendt, Superconductivity at 38 K in the Iron Arsenide (Ba1-xKx)Fe2As2, Phys. Rev. Lett. 101, 107006, (2008).
- [31] S. Jiang, H. Xing, G. Xuan, C. Wang, Z. Ren, C. Feng, J. Dai, Z. Xu and G. Cao, Superconductivity up to 30 K in the vicinity of the quantum critical point in BaFe2(As1-xPx)2, J. Phys. Cond. Mat. 21 382203, (2009).
- [32] T. Kobayashi, S. Miyasaka, S Tajima, Single crystal growth and physical properties of SrFe2(As1-xPx)2, http://arxiv.org/abs/1112.3743v1, (2011).
- [33] S. Kasahara, T. Shibauchi, K. Hashimoto, Y. Nahai, H. Ikeda, T. Terashima, and Y. Matsuda, Abrupt recovery of Fermi-liquid transport by the -axis collapse in CaFe2(As1-xPx)2 single crystals, Phys. Rev. B 83 060505, (2011).
- [34] A. S. Sefat, R. Jin, M. A. McGuire, B. C. Sales, D. J. Singh and D. Mandrus, Superconductivity at 22 K in Co-doped BaFe2As2 Crystals, Phys. Rev. Lett. 101 117004, (2008).
- [35] S. Kasahara, T. Shibauchi, K. Hashimoto, K. Ikada, S. Tonegawa, R. Okazaki, H. Shishido, H. Ikeda, H. Takeya, K. Hirata, T. Terashima and Y. Matsuda, Evolution from non-Fermi to Fermi-liquid transport via isovalent doping in BaFe2(AsP)2 superconductors, Phys. Rev. B 81 184519, (2010).
- [36] P. L. Alireza, Y. T. C. Ko, J. Gillett, C. M. Petrone, J. M. Cole, G. G. Lonzarich and S. E. Sebastian, Superconductivity up to 29 K in SrFe2As2 and BaFe2As2 at high pressures, J. Phys. Cond. Mat. 21 012208, (2009).
- [37] Y. Mizuguchi, F. Tomioka, S. Tsuda, T. Yamaguchi, and Y. Takano, Superconductivity at 27 K in tetragonal FeSe under high pressure, Appl. Phys. Lett. 93, 152505, (2008).
- [38] R. Liang, D. A. Bonn, W. N. Hardy, Evaluation of CuO2 plane hole doping in YBa2Cu3O6+x single crystals, Phys. Rev. B 73, 180505(R), (2006).
- [39] S. E. Sebastian, J. Gillett, N. Harrison, P. H. C. Lau, D. J. Singh, C. H. Mielke and G. G. Lonzarich, Quantum oscillations in the parent magnetic phase of an iron arsenide high temperature superconductor J. Phys. Cond. Matt. 20 422203, (2008).
- [40] A. I. Coldea, J. D. Fletcher, A. Carrington, J. G. Analytis, A. F. Bangura, J. -H. Chu, A. S. Erickson, I. R. Fisher, N. E. Hussey, and R. D. McDonald, Fermi Surface of Superconducting LaFePO Determined from Quantum Oscillations, Phys. Rev. Lett. 101, 216402, (2008).
- [41] J. G. Analytis, R. D. Mcdonald, J. H. Chu, S. C. Riggs, A. F. Bangura, C. Kucharczyk, M. Johannes and I. R. Fisher, Quantum oscillations in the parent pnictide BaFe2As2: itinerant electrons in the reconstructed state, Phys. Rev. B 80 064507 (2009).
- [42] N. Harrison, R. D. Mcdonald, C. H. Mielke, E. D. Bauer, F. Ronning and J. D. Thompson, Quantum oscillations in antiferromagnetic CaFe2As2 on the brink of superconductivity, J. Phys.-Condens. Matter 21 322202, (2009).
- [43] T. Terashima, N. Kurita, M. Tomita, K. Kihou, C. H. Lee, Y. Tomioka, T. Ito, A. Iyo, H. Eisaki, T. Liang, M. Nakajima, S. Ishida, S. Uchida, H. Harima and S. Uji, Complete Fermi Surface in BaFe2As2 Observed via Shubnikov-de Haas Oscillation Measurements on Detwinned Single Crystals, Phys. Rev. Lett. 107 176402, (2011). In this work the frequency is suggested to correspond to the 2 harmonic.
- [44] M. Sutherland, D. J. Hills, B. S. Tan, M. M. Altarawneh, N. Harrison, J. Gillett, E. C. T. O Farrell, T. M. Benseman, I. Kokanovic, P. Syers, J. R. Cooper, and S E. Sebastian, Evidence for Dirac nodes from quantum oscillations in SrFe2As2, Phys. Rev. B 84 180506(R), (2011).
- [45] N. Harrison, S. E. Sebastian, Dirac nodal pockets in the antiferromagnetic parent phase of FeAs superconductors, Phys. Rev. B 80 224512, (2009).
- [46] J. G. Analytis, C. M. J. Andrew, A. I. Coldea, A. Mccollam, J. H. Chu, R. D. Mcdonald, I. R. Fisher and A. Carrington, Fermi surface of SrFe2P2 determined by the de Haasvan Alphen effect, Phys. Rev. Lett. 103 076401, (2009).
- [47] A. I. Coldea, C. M. J. Andrew, J. G. Analytis, R. D. McDonald, A. F. Bangura, J. H. Chu, I. R. Fisher and A. Carrington, Topological change of the Fermi surface in ternary iron pnictides with reduced c/a ratio: a de Haasvan Alphen study of CaFe2P2, Phys. Rev. Lett. 103 026404, (2009).
- [48] B. Arnold, S. Kasahara, A. Coldea, T. Terashima, Y. Matsuda, T. Shibauchi and A. Carrington, Nesting of electron and hole Fermi surfaces in nonsuperconducting BeFe2P2, Phys. Rev. B 83 220504, (2011).
- [49] J. G. Analytis, J.-H. Chu, R. D. McDonald, S. C. Riggs, and I. R. Fisher, Enhanced Fermi-Surface Nesting in Superconducting BaFe2(As1-xPx)2 Revealed by the de Haasvan Alphen Effect, Phys. Rev. Lett. 105 207004, (2010).
- [50] T. Terashima, M. Kimata, N. Kurita, H. Satsukawa, A. Harada, K. Hazama, M. Imai, A. Sato, K. Kihou, C. Lee, H. Kito, H. Eisaki, A. Iyo, T. Saito, H. Fukazawa, Y. Kohori, H. Harima, and S. Uji, Fermi Surface and Mass Enhancement in KFe2As2 from de Haasvan Alphen Effect Measurements, J. Phys. Soc. Jpn. 79, 053702, (2010).
- [51] C. Putzke, A. I. Coldea, I. Guillamon, D. Vignolles, A. McCollam, D. LeBoeuf, M. D. Watson, I. I. Mazin, S. Kasahara, T. Terashima, T. Shibauchi, Y. Matsuda, A. Carrington, A de Haasvan Alphen study of the Fermi surfaces of superconducting LiFeP and LiFeAs, Phys. Rev. Lett. 108, 047002, (2011).
- [52] A. I. Goldman, D. N. Argyriou, B. Ouladdiaf, T. Chatterji, A. Kreyssig, S. Nandi, N. Ni, S. L. Bud’ko, P. C. Canfield, and R. J. McQueeney, Lattice and magnetic instabilities in CaFe2As2: A single-crystal neutron diffraction study, Phys. Rev. B 78, 100506(R), (2008).
- [53] D. J. Singh and M. H. Du, Density Functional Study of LaFeAsO1-xFx: A Low Carrier Density Superconductor Near Itinerant Magnetism, Phys. Rev. Lett. 100, 237003, (2008).
- [54] I. I. Mazin, D. J. Singh, M. D. Johannes and M. H. Du, Unconventional superconductivity with a sign reversal in the order parameter of LaFeAsO1-x, Phys. Rev. Lett. 101, 057003, (2008).
- [55] K. Kuroki, S. Onari, R. Arita, H. Usui, Y. Tanaka, H. Kontani and H. Aoki, Unconventional superconductivity originating from disconnected Fermi surfaces in the iron-based oxypnictide, Phys. Rev. Lett. 101 087004, (2008).
- [56] A. V. Chubukov, D. V. Efremov and I. Eremin, Magnetism, superconductivity, and pairing symmetry in iron-based superconductors, Phys. Rev. B 78 134512, (2008).
- [57] V. Cvetkovic and Z. Tesanovic, Multiband magnetism and superconductivity in Fe-based compounds, EPL 85 37002, (2009).
- [58] I. I. Mazin and J. Schmalian, Pairing Symmetry and Pairing State in Ferropnictides: Theoretical Overview, Physica C 469 614–627, (2009).
- [59] Q. Huang, Y. Qiu, W. Bao, M. A. Green, J. W. Lynn, Y. C. Gasparovic, T. Wu, G. Wu, X. H. Chen, Neutron-Diffraction Measurements of Magnetic Order and a Structural Transition in the Parent BaFe2As2 Compound of FeAs-Based High-Temperature Superconductors, Phys. Rev. Lett. 101 257003, (2008).
- [60] J. Zhao, D. X. Yao, S. Li, T. Hong, Y. Chen, S. Chang, W. Ratcliff, J. W. Lynn, H. A. Mook, G. F. Chen, J. L. Luo, N. L. Wang, E. W. Carlson, J. Hu, P. Dai, Low energy spin waves and magnetic interactions in SrFe2As2, Phys. Rev. Lett. 101, 167203, (2008).
- [61] R. A. Ewings, T. G. Perring, J. Gillett, S. D. Das, S. E. Sebastian, A. E. Taylor, T. Guidi, and A. T. Boothroyd, Itinerant Spin Excitations in SrFe2As2 Measured by Inelastic Neutron Scattering, Phys. Rev. B 83 214519, (2011).
- [62] Y. Ran, F. Wang, H. Zhai, A. Vishwanath, D.-H. Lee, Nodal spin density wave and band topology of the FeAs-based materials, Phys. Rev. B 79 014505, (2009).
- [63] P. Richard, K. Nakayama, T. Sato, M. Neupane, Y.-M. Xu, J. H. Bowen, G. F. Chen, J. L. Luo, N. L. Wang, X. Dai, Z. Fang, H. Ding, and T. Takahashi, Observation of Dirac Cone Electronic Dispersion in BaFe2As2, Phys. Rev. Lett. 104 137001, (2010).
- [64] G. Xu, H. Zhang, X. Dai and Z. Fang, Electron-hole asymmetry and quantum critical point in hole-doped BaFe2As2, European Phys. Lett. 84 67015, (2008).
- [65] V. Brouet, M. Marsi, B. Mansart, A. Nicolaou, A. Taleb-Ibrahimi, P. Le Fèvre, F. Bertran, F. Rullier-Albenque, A. Forget, and D. Colson, Nesting between hole and electron pockets in Ba(Fe1-xCox)2As2 (=0-0.3) observed with angle-resolved photoemission, Phys. Rev. B 80 165115, (2009).
- [66] A. Carrington, Quantum oscillation studies of the Fermi surface of iron-pnictide superconductors, Rep. Prog. Phys. 74 124507, (2011).
- [67] T. Helm, M. V. Kartsovnik, M. Bartkowiak, N. Bittner, M. Lambacher, A. Erb, J. Wosnitza, and R. Gross, Evolution of the Fermi surface of the electron -doped high-temperature superconductor Nd2-xCexCuO4 revealed by Shubnikov-de Haas oscillations, Phys. Rev. Lett., 103, 157002, (2009).
- [68] D. N. Basov and A. V. Chubukov, Manifesto for a higher , Nature Phys. 7 272–276, (2011).
- [69] B. Vignolle, A. Carrington, R. A. Cooper, J. M. M. French, A. P. Mackenzie, C. Jaudet, D. Vignolles, C. Proust, N. E. Hussey. Quantum oscillations in an overdoped high- superconductor, Nature 455, 952–955, (2008).
- [70] B. I. Halperin and T. M. Rice, The Excitonic State at the Semiconductor-Semimetal Transition, in Solid State Physics, edited by F. Seitz, D. Turnbull, and H. Ehrenreich (Academic Press, N. Y.) 21 115, (1968).
- [71] P. Monthoux and G. G. Lonzarich, Magnetic interactions in a single-band model for the cuprates and ruthenates, Phys. Rev. B 71 054504, (2005).
- [72] P. Monthoux, D. Pines & G. G. Lonzarich, Superconductivity without phonons, Nature 450 20, (2007).
- [73] H. Shishido, A. F. Bangura, A. I. Coldea, S. Tonegawa, K. Hashimoto, S. Kasahara, P. M. C. Rourke, H. Ikeda, T. Terashima, R. Settai, Y. Onuki, D. Vignolles, C. Proust, B. Vignolle, A. Mccollam, Y. Matsuda, T. Shibauchi and A. Carrington, Evolution of the Fermi surface of BaFe2(As1-xPx) on entering the superconducting dome, Phys. Rev. Lett. 104 057008, (2010).
- [74] J. Singleton, C. de la Cruz, R. D. McDonald, S. Li, M. Altarawneh, P. Goddard, I. Franke, D. Rickel, C. H. Mielke, X. Yao, and P. Dai, Magnetic Quantum Oscillations in YBa2Cu3O6.61 and YBa2Cu3O6.69 in Fields of Up to 85 T: Patching the Hole in the Roof of the Superconducting Dome, Phys. Rev. Lett. 104 086403, (2010).