Effects of crossflow velocity and transmembrane pressure on microfiltration of oil-in-water emulsions
Abstract
This study addresses the issue of oil removal from water using hydrophilic porous membranes. The effective separation of oil-in-water dispersions involves high flux of water through the membrane and, at the same time, high rejection rate of the oil phase. The effects of transmembrane pressure and crossflow velocity on rejection of oil droplets and thin oil films by pores of different cross-section are investigated numerically by solving the Navier-Stokes equation. We found that in the absence of crossflow, the critical transmembrane pressure, which is required for the oil droplet entry into a circular pore of a given surface hydrophilicity, agrees well with analytical predictions based on the Young-Laplace equation. With increasing crossflow velocity, the shape of the oil droplet is strongly deformed near the pore entrance and the critical pressure of permeation increases. We determined numerically the phase diagram for the droplet rejection, permeation, and breakup depending of the transmembrane pressure and shear rate. Finally, an analytical expression for the critical pressure in terms of geometric parameters of the pore cross-section is validated via numerical simulations for a continuous oil film on elliptical and rectangular pores.
Keywords: Multiphase flows; Microfiltration; Oil-in-water emulsions; Volume of fluid method
I Introduction
With the recent advances in environmental and biological technologies, there has been increasing interest in characterization and modeling flows at the micron scales including flows in microchannels and nanochannels Squires05 ; Eijkel05 , multiphase flows through porous media Blunt01 ; Coutelieris12 , and droplet-based microfluidics Shui07 ; Teh08 . The industrial applications include oil extraction from porous media McAuliffe73 ; Kokal92 ; Sheorey01 , treatment of oily wastewater Mueller97 ; Cheryana98 ; Chang01 , and encapsulation of molecules, cells, and microorganisms Orive03 ; Atencia05 ; Zhang12 . In most of these processes, one or more phases are dispersed in a continuous phase in the form of emulsions, which are usually produced by shearing two immiscible phases against each other in the presence of surfactants Ficheux98 . In some cases, emulsions serve as means of transport of molecules, bio-reagents, and drugs, and ultimately provide the environment for enhanced reactions Atencia05 ; Kelly07 . Another technological application of emulsions is to improve the transportability or displacement of highly viscous liquids. For example, heavy crude oil is emulsified to form a less viscous mixture to facilitate its transportation Langevin04 ; Sanchez94 . In addition, oil-in-water emulsions are used to enhance recovery and increase sweep efficiency from crude oil reservoirs by blocking highly permeable paths and preventing channeling of the displacing fluid McAuliffe73 . Common methods for separation of emulsions include evaporation of the continuous phase Gryta99 , destruction (demulsification) Bibette99 , and membrane filtration Mueller97 .
Membrane microfiltration has proven to be an efficient way for separating oil-in-water emulsions Pan07 ; Gryta01 . In comparison with the conventional methods of filtration (gravity separators, centrifuges, etc.), membrane microfiltration has several distinct advantages including reduced space requirements, higher permeate quality, and lower operating costs Mueller97 . Despite its advantages, microfiltration efficiency can be greatly reduced because of membrane fouling at highly concentrated emulsions or long filtration times Song98 . Fouling is generally caused by the accumulation of the rejected phase on the surface of the membrane or inside the pore. There are four main mechanisms (blocking laws) for membrane fouling, i.e., standard blocking, complete blocking, intermediate blocking, and cake formation Hermia82 . Complete blocking is common for very dilute mixtures and during the initial stages of filtration when some pores are sealed by droplets and particles, thus reducing the permeate flux Heertjes57 ; Bowen95 . Accumulation of the rejected droplets on the membrane surface results in the formation of the so-called cake layer, which is sometimes referred to as the secondary membrane as it adds a hydraulic resistance to the microfiltration process Kuberkar00 ; Dufreche02 ; Tarabara04 . This mechanism is dominant at the final stages of filtration when the water flux depends mainly on the thickness of the cake layer.
The efficiency of the microfiltration process is determined by the properties of the membrane material and oil-in-water mixtures. For example, the permeate flux is highly dependent on the oil concentration, stability of the oil phase in water, and the size distribution of oil droplets Mueller97 ; Park01 . Moreover, the membrane properties such as membrane material, pore size and morphology, and membrane geometry affect the permeate flow resistance Mueller97 ; Ohya98 . It was shown that slotted (rectangular) pores resulted in higher flux rates compared to circular pores for similar operating conditions because of the lower fowling rate of the slotted-pore membranes Bromley02 . Another approach to reduce the fouling rate is to introduce crossflow above the membrane surface. This method, known as the “crossflow microfiltration”, reduces fouling by sweeping away the deposited drops and particles and, hence, decreases the thickness of the cake layer. Therefore, crossflow microfiltration systems tend to produce higher permeate fluxes for longer times compared to dead-end microfiltration systems Koltuniewicz95 ; Holdich98 . One of the aims of the present study is to investigate numerically the entry dynamics of oil droplets into a membrane pore in the presence of crossflow.
The dynamics of droplet breakup in steady shear flow is determined by the relative competition of the viscous stress, pressure, and interfacial tension Stone94 . In general, the breakup process is initiated by the droplet deformation, which is linearly proportional to the rate of shear Grace82 . When the critical deformation is reached, the droplet assumes an unstable configuration and undergoes a transient elongation before it breaks up Stone94 . It was also shown that the geometric confinement as well as the viscosity ratio of the dispersed and continuous phases influence droplet breakup Vananroye06 . In recent years, the problem of droplet deformation and breakup has been extensively studied numerically using Lattice Boltzmann Xi99 ; Graaf06 ; Fakhari10 , boundary integral Li97 ; Janssen07 , and Volume of Fluid (VOF) Li00 ; Dietsche09 ; Gueyffier99 methods. The VOF method used in the present study has proven to be a powerful and efficient interface tracking algorithm that is both conceptually simple and relatively accurate Gopala08 . Due to the conservative discretization of the governing equations in the VOF method, the mass of each fluid is accurately conserved Li00 ; Pilliod04 . Furthermore, the ability of the VOF method to automatically capture local and global changes of the interface topology, e.g., coalescence and breakup of droplets, has made it attractive for various multiphase flow applications Gopala08 .
During the last decade, a number of studies have investigated the process of droplet formation using cross-flowing streams in T-shaped junctions Xu05 ; Husny06 ; Graaf06 ; Gupta09 . In these microfluidic systems, two immiscible liquids are driven through separate channels until their streams meet at a junction, where the dispersed liquid extends into the continuous stream, resulting in periodic formation of equal-sized droplets Christopher07 . Regardless of the specific channel geometry and wettability of the channel walls, breakup of the emerging droplet in a cross-flowing stream is determined by the viscous drag when the droplet remains unconfined by the microchannel Christopher07 . For unconfined T-junctions, it was demonstrated experimentally that the droplet size strongly depends of the crossflow rate of the continuous phase and only weakly on the flow rate of the dispersed phase Xu05 ; Husny06 . It was also shown that, for given value of continuous phase flow rate, the size of oil droplets decreases with increasing viscosity ratio of the oil and water Husny06 .
In this paper, numerical simulations based on the Volume of Fluid method are performed to study the influence of transmembrane pressure and crossflow velocity on the entry dynamics of thin oil films and droplets into pores of various cross-sections. We find that the formula derived in Ref. Nazzal96 for the critical pressure of permeation of an oil droplet into a circular pore agrees well with the results of numerical simulations. The numerical analysis is then extended to thin oil films covering pores with elliptical and rectangular cross-section in the absence of crossflow. In the presence of crossflow, we obtain numerically the phase diagram for the droplet rejection, permeation, and breakup as a function of the transmembrane pressure and shear rate, and study the details of the processes in three different regions of the phase diagram. These results are relevant to microfiltration of dilute oil-in-water emulsions at early stages before the formation of the cake layer.
The rest of the paper is organized as follows. The details of numerical simulations are described in the next section. The analytical predictions based on the Young-Laplace equation are reviewed in Sec. III.1 and verified numerically for an oil droplet on a circular pore in Sec. III.2. The critical pressure of permeation for pores with elliptical and rectangular cross-section is reported in Sec. III.3. The results for the oil droplet dynamics near circular pores in the presence of crossflow are presented in Sec. III.4. The conclusions are given in the last section.
II Details of numerical simulations
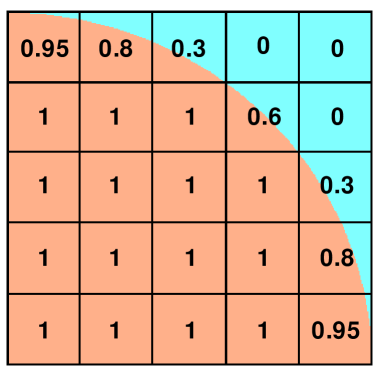
Numerical simulations were carried out using the commercial software FLUENT fluent . In order to control the transmembrane pressure and the crossflow velocity, a user-defined function was written and compiled along with the main solver. The Volume of Fluid method was used to solve the multiphase flow problem Hirt81 . For a two-phase fluid, this method is based on the fact that the two phases form an impenetrable interface, i.e., each cell is filled with either one of the phases (denoting a specific phase zone) or a combination of two phases (denoting the interface). This is achieved by introducing a variable , known as the “volume fraction”, which is defined as the ratio of the volume of fluid in the cell and the total cell volume; and it varies between and Saha09 ; Hsu04 . An example of how the volume fraction varies near the interface is illustrated schematically in Fig. 1.
The interface is tracked by solving the transport equation for the volume fraction as follows:
| (1) |
where V is the velocity vector. Equation (1) states that the substantial derivative of the volume fraction is zero, and, therefore, the interface is convected by the velocity fields at the interface. After solving Eq. (1), the material properties are computed by considering the fraction of each component in the cell; e.g., the density is given by
| (2) |
where is the volume-fraction-averaged density.
One momentum equation is solved and the velocity field is shared between two phases as follows:
| (3) |
where g is the vector of gravitational acceleration, and F is the source term. In multiphase flow applications, the source term is the surface tension force per unit volume and it is non-zero only at the interface. Using the divergence theorem, the surface tension force is defined as the volume force in a cell as follows:
| (4) |
where is the surface tension between two phases and is the mean curvature of the interface in the cell. This force is related to the pressure jump across the interface (determined by the Young-Laplace equation) and it acts in the direction normal to the interface. The surface tension term tends to smooth out regions with large interface curvature Gerlach06 . If the interface is in contact with the wall, the normal vector (), which defines the orientation of the interface in the cell adjacent to the wall, is determined by the contact angle. The effect of static contact angle is taken into account by imposing the interface unit normal for a point (a cell in the Finite Volume method), , on the wall containing the interface as follows:
| (5) |
where is the unit vector normal to the wall, is a vector on the wall and normal to the contact line, and is the static contact angle Brackbill92 .
A SIMPLE algorithm was used for the pressure-velocity decoupling. The momentum equation was discretized using a second order upwind scheme. To reconstruct the interface and, consequently, solve the volume fraction transport equation, a PLIC (Piecewise Linear Interface Reconstruction) method was used Rider98 . The pressure equation is discretized using a staggered mesh with central differencing. In FLUENT, the interfacial tension is modeled using the well-known model of Continuum Surface Force (CSF) of Brackbill et al. Brackbill92 . Using CSF, the surface tension volume force Eq. (4) is added as a source term to the momentum equation and the curvature is computed in terms of the vector normal to the interface n via:
| (6) |
Interfacial effects in multiphase flows are described by the Young-Laplace equation, which relates the pressure jump across the interface to its mean curvature and the surface tension coefficient. For flows at the micron length scales, the viscous effects are dominant and the inertial effects are typically negligible. The capillary number is a measure of how viscous shear stresses are compared to the interfacial stresses and it is defined , where is the characteristic velocity, is the fluid viscosity, and is the surface tension coefficient.
In the present study, the numerical simulations are performed to investigate a separation process of two commonly used liquids, i.e., kerosene and water. The density of kerosene is and the viscosity ratio of kerosene and water at standard conditions is . It is assumed that the water is deionized; and, thus, the surface tension coefficient is used throughout the study Cumming00 . Furthermore, we consider hydrophilic surfaces (for example polyvinyl-pyrrolidone Cumming00 ) with contact angles of kerosene in water greater than .
In our simulations, the mesh was generated in GAMBIT using the Cooper mesh scheme. This method works by sweeping the node patterns of specified source faces through the whole volume and the resultant mesh consists of an array of tetrahedral grids. For the results reported in the current study, we used about cells along the pore diameter. To test the grid-resolution dependence, we considered finer meshes that contained , , and cells along the pore diameter. In the absence of crossflow, the simulations were performed for an oil droplet () on a circular pore () at two transmembrane pressures ( and bar) slightly above and below the exact value of the permeation pressure bar predicted by the Young-Laplace analysis. In all cases, the droplet would either penetrate into the pore or reside at the pore entrance for at least . Furthermore, it was previously shown that the velocity of the contact line in the VOF method is inversely proportional to the logarithm of the mesh size Renardy01 , and, therefore, it is expected that the droplet velocity in the shear flow will depend on the grid resolution. However, in the present study, the oil droplet becomes temporarily pinned at the pore entrance by the transmembrane pressure, and thus the contact line velocity becomes much smaller than the flow velocity in the channel. Nevertheless, we have performed numerical simulations in the permeation, rejection, and breakup regions of the phase diagram with times finer meshes and found that our results remain unchanged.
III Results
III.1 The Young-Laplace analysis for circular pores
Effective separation of oil-in-water emulsions is controlled by several key parameters such as the membrane pore size, surface energy, size of oil droplets, surface tension, and pressure difference across the membrane. If the transmembrane pressure is relatively high, then oil droplets will most likely penetrate the membrane surface resulting in low rejection rates of the oil phase. On the other hand, low transmembrane pressures tend to limit flux of water through the membrane. Hence, the optimum operating conditions strongly depend on the critical transmembrane pressure required for an oil droplet entry into a membrane pore.
When the transmembrane pressure across a hydrophilic membrane exceeds a certain critical value, the oil phase will penetrate the membrane. Thus, for high separation efficiency, the transmembrane pressure should be maintained at a value below , which for a continuous oil film on the membrane surface with circular pores is given by
| (7) |
where is the surface tension coefficient between oil and water, is the contact angle of the interface of an oil droplet on a membrane surface immersed in water, and is the membrane pore radius Nazzal96 . The critical pressure in Eq. (7) is determined by the Young-Laplace pressure due to the curvature of the oil-water interface inside the pore.
If instead of a thin oil film, a droplet of oil is placed at the entrance of the membrane pore, the formula for the critical pressure, Eq. (7), has to be corrected by a factor that depends on the ratio to include the effect of the oil-water interface curvature above the membrane surface. It was previously shown Cumming00 ; Nazzal96 that the pressure required to force an entry of an oil droplet of radius into a circular pore is given by
| (8) |
In the limit , the curvature of the droplet above the pore vanishes, and thus this formula corresponds to a continuous oil film on the membrane surface, and Eq. (8) converges to Eq. (7). Contrary to the case of the thin film, the critical pressure for an oil droplet with is negative, and the droplet will penetrate into the pore in the absence of the applied pressure gradient. We also comment that no such expression exists for the case when crossflow is present and the hydrodynamic drag force is exerted on the droplet parallel to the membrane surface.
In what follows, we investigate the dynamics of an oil droplet and thin film entry into pores with various cross-sections. The critical pressures [Eq. (7) and Eq. (8)] are compared with the results of numerical simulations in order to validate the numerical scheme. The numerical analysis is then extended to pores with rectangular and elliptical cross-sections. Finally, the effect of shear flow on the droplet entry is considered and a phase diagram of the transmembrane pressure versus shear rate is determined numerically.
III.2 An oil droplet on a circular pore in the absence of crossflow
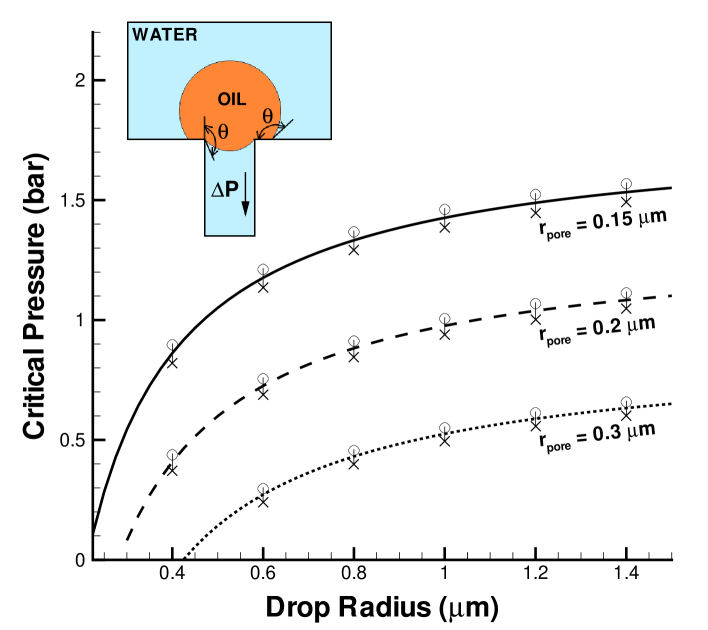
We first present the numerical results for the critical pressure required to force an entry of an oil droplet into a cylindrical pore. In the numerical scheme, the oil droplet is initially immersed in water above the membrane surface in the absence of flow. The transmembrane pressure is then gradually increased to a predetermined value. As the simulation continues, the droplet approaches the membrane surface and resides at the pore entrance. Depending on the applied pressure difference across the membrane, the droplet will either remain at the pore entrance or penetrate into the pore. We comment that when the applied pressure is close to the critical pressure, the dynamics of an oil droplet entry into the pore is significantly slowed down because the net driving force on the droplet is reduced.
The critical pressure as a function of the droplet radius is plotted in Fig. 2 using Eq. (8) for three values of the pore radius. The error bars in Fig. 2 indicate the upper and lower values of the transmembrane pressure when the oil droplet either enters the pore or remains at the pore entrance during the time interval of about . We find an excellent agreement between the results of numerical simulations and analytical predictions of Eq. (8), which provides a validation of the numerical method. Furthermore, as shown in Fig. 2, the critical pressure increases with increasing droplet radius or decreasing pore radius. As the droplet radius increases, the critical pressure approaches an asymptotic value predicted by Eq. (7) for a thin oil film (not shown).
III.3 Critical pressure for pores with arbitrary cross-section
We next investigate the influence of pore cross-sectional shape on the critical transmembrane pressure using simple physical arguments and numerical simulations. According to the Young-Laplace equation, the pressure jump across an interface between two immiscible fluids is related to its mean curvature and the surface tension as follows:
| (9) |
where is the mean curvature of the interface computed by averaging two principle curvatures. In the absence of gravity, the mean curvature of an arbitrary surface is given by
| (10) |
It follows from Eq. (9) that an interface, which is subject to a prescribed pressure jump and constant surface tension coefficient, has a constant mean curvature. Therefore, if the gravity is negligible, the fluid-fluid interface forms a section of the so-called Delaunay surface Hill11 ; Eells87 .
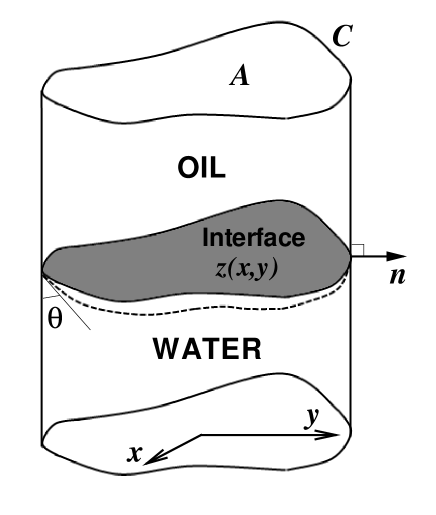
As shown in Fig. 3, if the oil-water interface is bounded by the walls of a pore of arbitrary cross-section, the constant contact angle at the pore surface imposes a boundary condition for Eq. (10) in the form
| (11) |
where n is the outward unit vector normal to the pore surface Finn99 .
Integrating Eq. (10) over an arbitrary cross-section with a smooth boundary and using the divergence theorem, we obtain
| (12) |
where and are the perimeter and cross-sectional area respectively. Taking the integral on the right hand side over the perimeter gives the following relation for the mean curvature of the oil-water interface Concus90
| (13) |
According to Eq. (13), the mean curvature of an interface bounded by a pore of arbitrary cross-section can be related to the geometric properties of the boundary. Remember that Eq. (9) relates the mean curvature to the surface tension and the pressure jump. In the case of an oil film on a pore with an arbitrary cross-section, the critical applied pressure is equal to the pressure jump at the interface. Therefore, combining Eqs. (9) and (13), we obtain the critical permeation pressure for the oil film to enter into a pore of arbitrary cross-section
| (14) |
This equation can also be derived from the force balance between the applied pressure and the Laplace pressure due to the curvature of the oil-water interface inside the pore.
It should be noted that the boundary value problem Eq. (10) does not always have a solution for a stable interface with a constant mean curvature and a constant contact angle Concus74 . In other words, there is a limitation on the values of the contact angle that correspond to the attached interface with a constant mean curvature. For example, if the contact angle (computed from the oil phase) is larger than the critical value, then Eq. (10) subject to the boundary condition Eq. (11) does not have a stable solution. As a result, the interface cannot remain attached to the bounding surface with a prescribed contact angle and, at the same time, maintain a constant mean curvature required by the Laplace equation. The critical contact angle is determined by the largest curvature of the cross-sectional shape for smooth boundaries and by the smallest wedge angle for boundaries with sharp corners Brady04 .
In what follows, we consider two special cases of rectangular and elliptical pores and compare predictions of Eq. (14) with the results of numerical simulations. The problem is illustrated schematically in the inset of Fig. 4. The oil film covers the pore entrance of a hydrophilic membrane subject to a pressure gradient (the transmembrane pressure). Since the Bond number is small, , the effect of the gravitational force can be neglected.
III.3.1 Thin oil film on the membrane surface with a rectangular pore
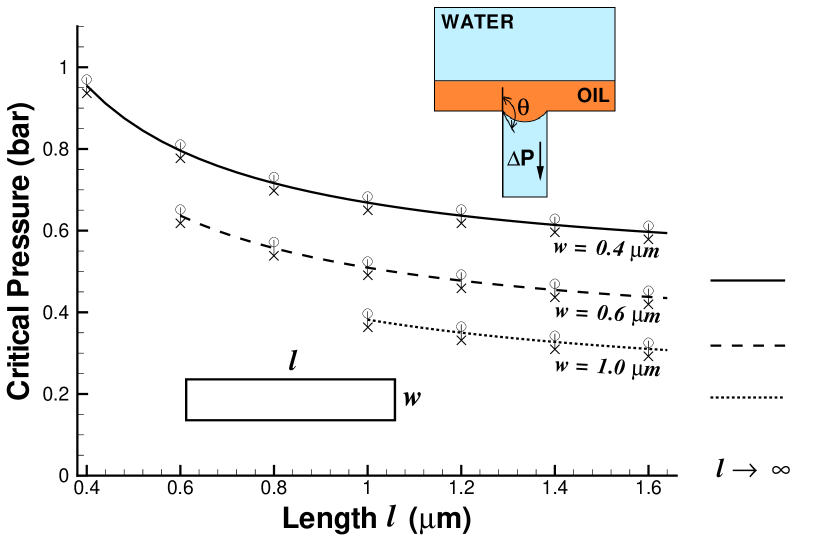
In this subsection, we investigate the dynamics of an oil film entry into a rectangular pore, which is sometimes referred to as a “slotted pore” Ullah12 . The rectangular shape of a slotted pore is characterized by the width (the shorter side) and the length (the longer side). Using and , the corresponding critical pressure is obtained from Eq. (14) as follows:
| (15) |
where and are the width and length of the pore cross-section Concus90 ; Ichikawa04 ; Cho07 . In the limit when , Eq. (15) reduces to , which is the critical pressure on an oil film entering into an infinitely long rectangular pore. In this case, one of the curvatures of the interface is zero and the other curvature is proportional to the width of the pore, and thus the shape of the interface is a part of a cylinder with the radius .
The results of numerical simulations and predictions of Eq. (15) are shown in Fig. 4 for several aspect ratios. As expected, square pores have the highest critical pressure due to the largest perimeter-to-area ratio. The critical pressure decreases with increasing aspect ratio. These results demonstrate that there is an excellent agreement between the numerical results and analytical predictions based on the Young-Laplace equation. It is important to note that when the applied pressure is close to the critical pressure, the net force on the interface is small, and, therefore, very long simulation time is required to capture the motion of the interface. The symbols in Fig. 4 indicate the rejection and permeation pressures that were resolved numerically without excessive computational effort. Interestingly, each curve in Fig. 4 is well described by the function , which is shifted upward by a constant (indicated by the horizontal lines in Fig. 4).
It was previously shown that for a rectangular cross-section of arbitrary aspect ratio, Eq. (10) has a solution with a constant curvature for a non-wetting fluid () when the the contact angle Wong92 ; Brady04 ; Ajaev06 . In the case of a square pore, the interface is part of a sphere with the radius Feng11 ; Finn99 . For other aspect ratios, the interface surface has a constant mean curvature , but it is no longer spherical Concus90 .
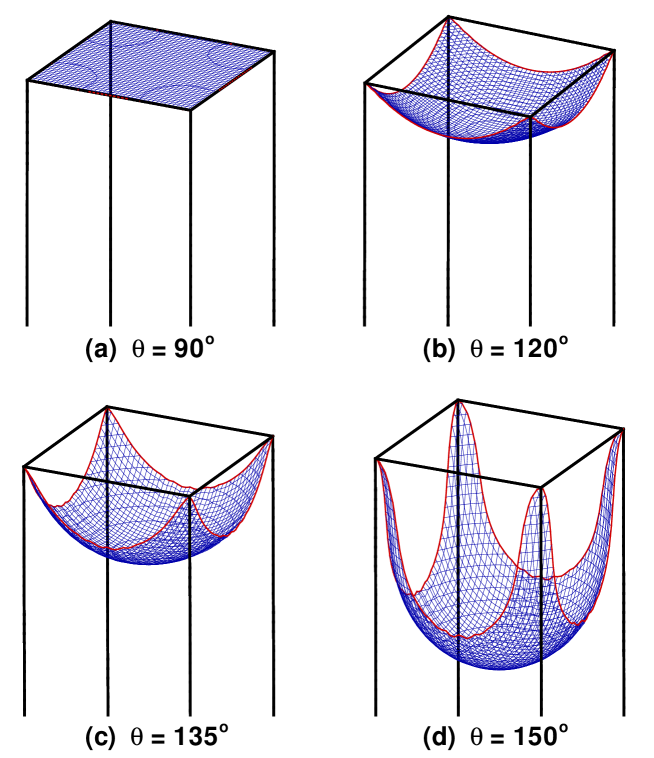
Figure 5 shows snapshots of the oil-water interface inside the square pore obtained from our numerical simulations. The transmembrane pressure is set to a value computed from Eq. (15) for the contact angles , and . As observed in Fig. 5, the concave shape of the interface strongly depends on the contact angle. When , the interface enters the pore with zero curvature and, according to Eq. (15), with zero pressure gradient. For contact angles between and , the interface bends in the center and penetrates into the pore before it starts to move near the corners. For , the distance between the interface location in the center and at the corners will theoretically be infinity because the interface becomes pinned at the corners while the inner part penetrates into the pore Collicott04 .
III.3.2 Thin oil film on the membrane surface with an elliptical pore
The critical permeation pressure for an oil film covering a pore with an elliptical cross-section can be estimated from Eq. (14) and the geometric properties of an ellipse. However, there is no exact expression for the perimeter of an ellipse. In our study, we use one of the most accurate and compact approximations that predicts the perimeter of an ellipse with an error of Berndt85
| (16) |
where and are the major and minor radii of the ellipse and . Using Eq. (16) and the expression for the ellipse area , the critical pressure is given by
| (17) |
Clearly, in the case of a circular pore, , Eq. (17) is reduced to Eq. (7).
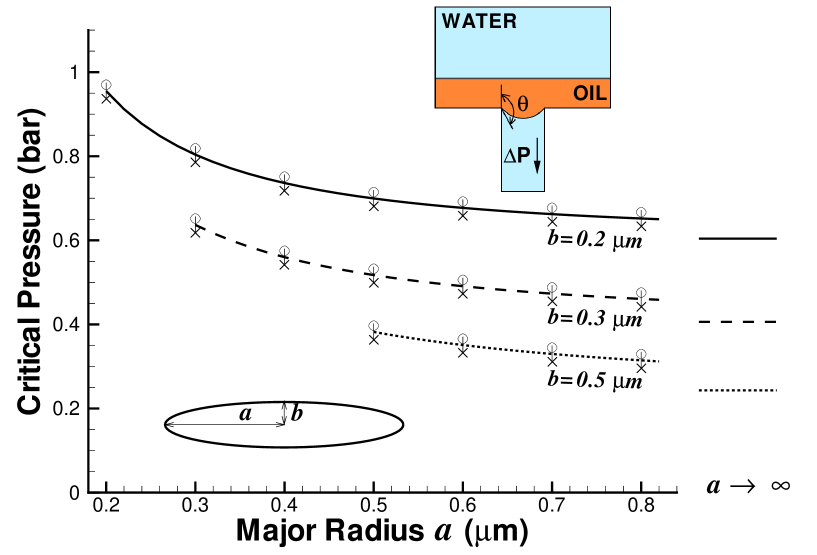
The results of numerical simulations and predictions of Eq. (17) are summarized in Fig. 6 for different aspect ratios. Similar to the case of the rectangular pore, the symbols indicate pressures of rejection and permeation that were resolved during the simulation time interval of about . It can be observed that the critical pressure decreases with increasing ellipse aspect ratio, and the numerical results agree very well with predictions of Eq. (17). We also comment that when , each curve in Fig. 6 asymptotes to , which is higher than the value estimated for an infinitely long rectangular pore (see section III.3.1). This difference arises because an infinitely long ellipse and an infinitely long rectangle of equal width have the same perimeter but different areas.
If the aspect ratio of an elliptical pore is less than , then the boundary value problem given by Eq. (10) has a solution for any contact angle Albright77 . However, when , there is a critical contact angle above which Eq. (10) has no solution Albright77 . For , the critical contact angle is , and it decreases with increasing aspect ratio. The largest aspect ratio considered in the present study is for which the critical contact angle is Albright77 . Therefore, the contact angle of used in our simulations generated an interface with a constant mean curvature described by Eq. (13). We comment that the oil-water interface inside the elliptical pore is not spherical because the boundary condition Eq. (11) is not satisfied at the intersection of a sphere and a cylinder with an elliptical cross-section. Similar to the rectangular cross-section, we found that at the critical pressure given by Eq. (17), the contact line is pinned at the antipodal points of the highest curvature of the ellipse, , while the rest of the interface penetrates into the pore.
III.4 Sheared droplet on the membrane surface with a circular pore
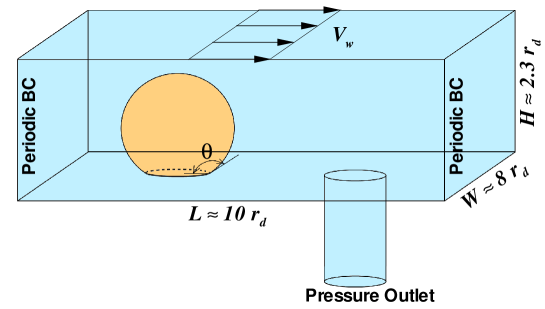
We next examine the combined effect of the transmembrane pressure and crossflow velocity on the entry dynamics of an oil droplet into a circular pore. The computational setup is illustrated schematically in Fig. 7. The shear flow is induced by translating the upper wall with a constant velocity. In our simulations, the effective shear rate is defined as the ratio of the upper wall velocity to the channel height. The relevant dimensionless numbers, the capillary and Reynolds numbers, are estimated to be and . The width of the channel is chosen to be about times larger than the droplet radius in order to minimize finite size effects in the lateral direction. Initially, the droplet is released upstream to insure that the flow reaches a steady state before the droplet approaches the pore. At the same time, the transmembrane pressure is set to a prescribed value, and the simulation continues until the droplet either reaches the outlet, penetrates into the pore, or breaks up.
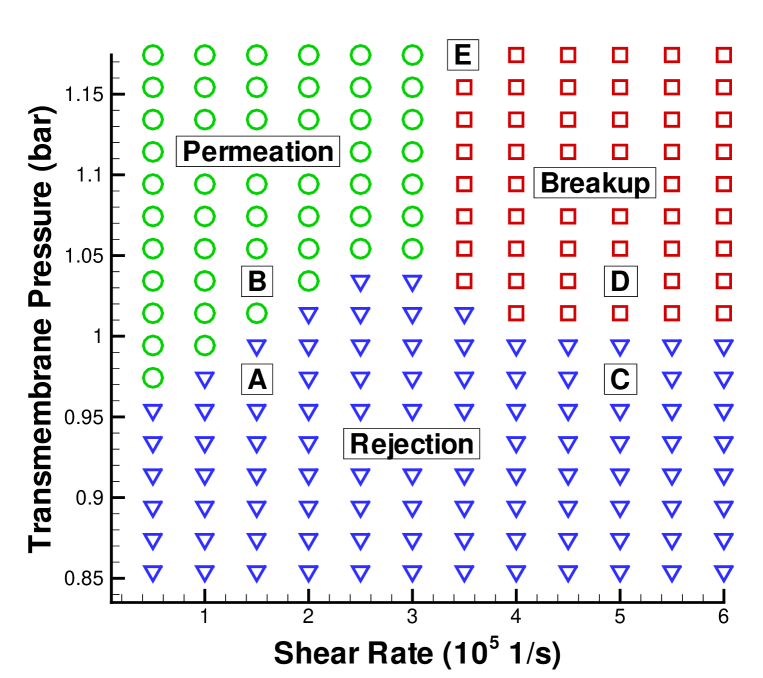
The main results of this study are summarized in Fig. 8, which shows the phase diagram for the droplet rejection, permeation, and breakup depending on the transmembrane pressure and shear rate. The corresponding snapshots of the droplet for five different cases (denoted by the capital letters A, B, C, D, and E) are presented in Fig. 9. Below, we discuss the details of the processes in the three different regions of the phase diagram and provide an estimate of the leakage volume during the droplet breakup.
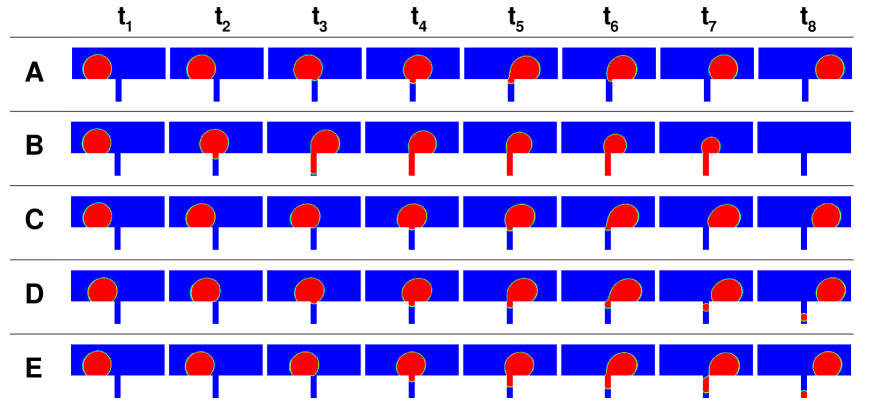
In the permeation region shown in Fig. 8, the transmembrane pressure is larger than the steamwise drag force, and the oil droplet penetrates into the pore. A series of snapshots at point B in Fig. 9 demonstrate the details of the permeation process. As observed in Fig. 9 (B), at first, the droplet partially penetrates into the pore and becomes strongly deformed in the shear flow. However, the droplet does not breakup because its size above the pore decreases as the droplet penetrates into the pore, and the viscous shear stress acts on a progressively smaller surface area.
With increasing shear rate, the effect of viscous forces becomes more important, resulting in strong deformation of the droplet shape near the pore entrance. We find that at sufficiently large transmembrane pressures and , the oil droplet breaks up. In this case, the larger droplet is washed off downstream and the smaller droplet enters the pore, and, as a result, the membrane leaks.
Depending on the values of the transmembrane pressure and shear rate, two different breakup regimes were observed. The first regime is bounded by the minimum breakup pressure, which is found from Fig. 8 to be . Above this pressure, a small fragment is detached and penetrates into the pore while the main droplet is carried away by the shear flow. During this process, the droplet has a limited time to deform, and, therefore, the breakup occurs only locally without significant deformation, as shown in Fig. 9 (D).
The breakup process at higher transmembrane pressures occurs in a qualitatively different way [see Fig. 9 (E)]. As the droplet approaches the pore, it momentarily slows down and remains at the pore entrance during the “residence time”. In this case, the effects of the drag and the transmembrane pressure are relatively large and comparable with each other. As a result, the shape of the droplet is significantly deformed by the shear flow and a thin bridge is formed between two parts of the stretched droplet. This thinning is known as necking and it usually indicates the initial stage of the breakup process Xu08 ; Zwan09 . For a short time interval, the thin neck holds the two parts of the droplet together. At the final stage of breakup, the neck gets thinner and thinner near the the edge of the pore, and at some point, it becomes unstable and the droplet breaks.
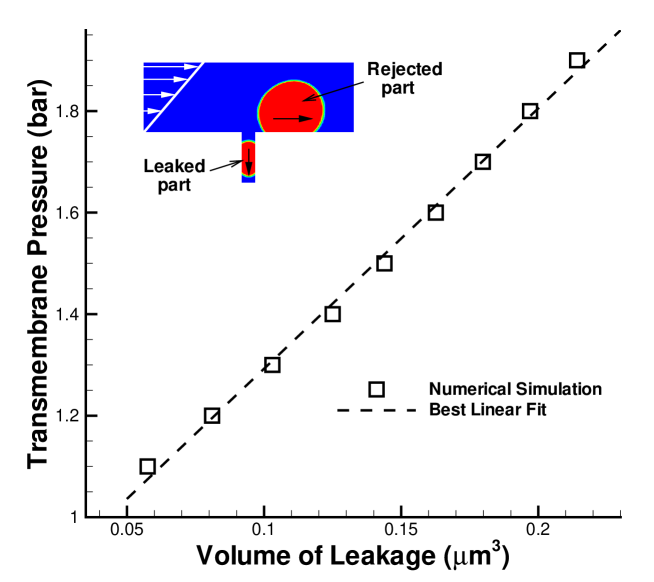
Visual inspection of the snapshots of the droplet near the pore entrance revealed that, at a given shear rate in the breakup regime in Fig. 8, the residence time is roughly independent of the transmembrane pressure. Therefore, it is expected that during the breakup process, the volume of leaked droplets is proportional to the applied pressure. Figure 10 shows the leakage volume as a function of the transmembrane pressure when . Indeed, the leakage volume is almost linearly proportional to the applied pressure, indicating that the flow inside the pore is described by the Hagen-Poiseuille equation.
The lower part of the phase diagram in Fig. 8 indicates operating conditions when the oil droplet is rejected by the membrane and washed off by the shear flow. An example of the rejection process at low shear rates is presented in Fig. 9 (A). Although the droplet partially penetrates into the pore, the flow generates a force on the droplet surface, which pulls the droplet away from the pore, resulting in the droplet rejection. As shown in Fig. 9 (C), the residence time at higher shear rates is reduced, and the droplet is carried away by the flow without penetrating into the pore.
The threshold of permeation is determined by the competition between the drag force and the transmembrane pressure. Naturally, with increasing shear rate, the drag force increases; and, therefore, it is not surprising that the boundary curve separating the permeation and rejection regions in Fig. 8 increases with shear rate. However, it is difficult to estimate the exact dependence of the drag force on the droplet because its shape becomes strongly deformed in the shear flow. We also comment that, in the range of shear rates reported in Fig. 8, the lift force is about an order of magnitude smaller than the drag force Xu05 .
The critical shear rate that marks the boundary between the permeation and breakup regions in Fig. 8 can be estimated using simple force balance arguments. In the absence of gravity, the sheared droplet is subject to forces of surface tension, Laplace pressure, drag, and lift. Neglecting the lift force and following the analysis in Ref. Xu05 , the torque balance around the edge of the pore for the droplet configuration depicted in Fig. 9 (E ) can be written as follows:
| (18) |
where and are the diameter and cross-sectional area of the thinnest stable neck, is the surface tension force around the perimeter of the neck, and and are the pressures inside the droplet and in the channel, respectively. The Stokes drag force on the spherical droplet, , is estimated for the viscosity ratio and the average flow velocity Husny06 . In our simulations, the typical diameter of the thinnest stable neck is [see Fig. 9 (E )]. Using , , and in Eq. (18), the critical shear rate is roughly estimated to be , which is in good agreement with the value obtained numerically in Fig. 8.
The permeation, rejection, and breakup regions identified in the phase diagram in Fig. 8 can be useful for the optimal design and operation of crossflow microfiltration systems. It is apparent that the permeation region should be avoided for filtration purposes. The optimal performance of the microfiltration system with maximum rejection is achieved in the upper part of the rejection region where the large transmembrane pressure results in high flux of water while the oil phase is completely rejected. However, the separation efficiency can be increased at higher transmembrane pressures in the breakup region, where the higher flux of water is accompanied by some oil leakage.
IV Conclusions
In this paper, the numerical simulations were carried out to investigate the influence of the transmembrane pressure and crossflow velocity on the entry dynamics of thin oil films and oil droplets into pores of different cross-section. We considered hydrophilic membrane surfaces with contact angles of oil in water greater than . The numerical method was validated against the analytical solution for the critical pressure of permeation of an oil droplet into a circular pore in the absence of crossflow. Furthermore, we found that the results of numerical simulations of thin oil films on elliptical or rectangular pores agree well with the theoretical prediction for the critical pressure expressed in terms of geometric parameters of the pore cross-section. Also, examples of curved oil-water interfaces inside elliptical and rectangular pores were discussed for different aspect ratios and contact angles.
In the presence of crossflow above the membrane surface, we have determined numerically the phase diagram for the droplet rejection, permeation, and breakup as a function of the transmembrane pressure and shear rate. A detailed analysis of the droplet dynamics near the pore entrance was performed in the three different regions of the phase diagram. We found that in the permeation region, the transmembrane pressure is larger than the steamwise drag, and the oil droplet penetrates into the circular pore. With increasing crossflow velocity, the shape of the droplet becomes strongly deformed near the pore entrance; and, at sufficiently high transmembrane pressures and shear rates, the droplet breaks up into two fragments, one of which penetrates into the pore. It was also shown that during the breakup process, the residence time of the oil droplet at the pore entrance is roughly independent of the transmembrane pressure, and the volume of the leaked fragment is nearly proportional to the applied pressure. Finally, the numerical value of the critical shear rate that separates the permeation and breakup regions is in good agreement with an estimate based on the force balance arguments.
Acknowledgments
Financial support from the Michigan State University Foundation Strategic Partnership Grant 71-1624 is gratefully acknowledged. The authors would like to thank V. V. Tarabara for introducing the problem and insightful discussions. Computational work in support of this research was performed at Michigan State University’s High Performance Computing Facility.
References
- (1) T.M. Squires, S.R. Quake, Rev. Mod. Phys. 77 (2005) 977.
- (2) J.C.T. Eijkel, A. van den Berg, Microfluid. Nanofluid. 1 (2005) 249.
- (3) M.J. Blunt, Curr. Opinion Colloid Interface Sci. 6 (2001) 197.
- (4) F.A. Coutelieris, J.M.P.Q. Delgado, Transport Processes in Porous Media, Springer, 2012.
- (5) L. Shui, J.C.T. Eijkel, A. van den Berg, Adv. Colloid Interface Sci. 133 (2007) 35.
- (6) S.-Y. Teh, R. Lin, L.-H. Hung, A.P. Lee, Lab Chip 8 (2008) 198.
- (7) T. Sheorey, K. Muralidhar, P.P. Mukherjee, Int. J. Therm. Sci. 40 (2001) 981.
- (8) S.L. Kokal, B.B. Maini, R. Woo, Adv. Chem. 231 (1992) 220.
- (9) C.D. McAuliffe, J. Petrol. Technol. 25 (1973) 721.
- (10) J. Mueller, Y. Cen, R.H. Davis, J. Membr. Sci. 129 (1997) 221.
- (11) M. Cheryan, N. Rajagopalan, J. Membr. Sci. 151 (1998) 13.
- (12) I.-S. Chang, C.-M. Chung, S.-H. Han, Desalination 133 (2001) 225.
- (13) G. Orive, R.M. Hernandez, A.R. Gascon, R. Calafiore, T.M.S. Chang, P. De Vos, G. Hortelano, D. Hunkeler, I. Lacik, A.M.J. Shapiro, J.L. Pedraz, Nature Medicine 9 (2003) 104.
- (14) J. Atencia, D.J. Beebe, Nature 437 (2005) 648.
- (15) J. Zhang, R.J. Coulston, S.T. Jones, J. Geng, O.A. Scherman, C. Abell, Science 335 (2012) 690.
- (16) M.-F. Ficheux, L. Bonakdar, F. Leal-Calderon, J. Bibette, Langmuir 14 (1998) 2702.
- (17) B.T. Kelly, J.-C. Baret, V. Taly, A.D. Griffiths, Chem. Commun. 18 (2007) 1778.
- (18) D. Langevin, S. Poteau, I. Henaut, J.F. Argillier, Oil Gas Sci. Tech. 59 (2004) 511.
- (19) L.E. Sanchez, J.L. Zakin, Ind. Eng. Chem. Res. 33 (1994) 3256.
- (20) M. Gryta, K. Karakulski, Desalination 121 (1999) 23.
- (21) J. Bibette, F.L. Calderon, P. Poulin, Rep. Prog. Phys. 62 (1999) 969.
- (22) Y. Pan, W. Wang, T. Wang, P. Yao, Sep. Purif. Technol. 57 (2007) 388.
- (23) M. Gryta, K. Karakulski, A.W. Morawski, Water Res. 35 (2001) 3665.
- (24) L. Song, J. Membr. Sci. 139 (1998) 183.
- (25) J. Hermia, Trans. Inst. Chem. Eng. 60 (1982) 183.
- (26) P.M. Heertjes, Chem. Eng. Sci. 6 (1957) 190.
- (27) W.R. Bowen, J.I. Calvo, A. Hernandez, J. Membr. Sci. 101 (1995) 153.
- (28) V.T. Kuberkar, R.H. Davis, J. Membr. Sci. 168 (2000) 243.
- (29) J. Dufreche, M. Prat, P. Schmitz, Deslination 145 (2002) 129.
- (30) V.V. Tarabara, I. Koyuncu, M.R. Wiesner, J. Membr. Sci. 241 (2004) 65.
- (31) S.-H. Park, T. Yamaguchi, S. Nakao, Chem. Eng. Sci. 56 (2001) 3539.
- (32) H. Ohya, J.J. Kim, A. Chinen, M. Aihara, S.I. Semenova, Y. Negishi, O. Mori, M. Yasuda, J. Membr. Sci. 145 (1998) 1.
- (33) A.J. Bromley, R.G. Holdich, I.W. Cumming, J. Membr. Sci. 196 (2002) 27.
- (34) A.B. Koltuniewicz, R.W. Field, T.C. Arnot, J. Membr. Sci. 102 (1995) 193.
- (35) R.G. Holdich, I.W. Cumming, I.D. Smith, J. Membr. Sci. 143 (1998) 263.
- (36) H.A. Stone, Annu. Rev. Fluid Mech. 26 (1994) 65.
- (37) H.P. Grace, Chem. Eng. Commun. 14 (1982) 225.
- (38) A. Vananroye, P. Van Puyvelde, P. Moldenaers, Langmuir 22 (2006) 3972.
- (39) H. Xi, C. Duncan, Phys. Rev. E 59 (1999) 3022.
- (40) S. van der Graaf, T. Nisisako, C.G.P.H. Schroen, R.G.M. van der Sman, R.M. Boom, Langmuir 22 (2006) 4144.
- (41) A. Fakhari, M.H. Rahimian, Int. J. Numer. Meth. Fluids 64 (2010) 827.
- (42) X. Li, C. Pozrikidis, J. Fluid Mech. 341 (1997) 165.
- (43) P.J.A. Janssen, P.D. Anderson, Phys. Fluids 19 (2007) 043602.
- (44) J. Li, Y.Y. Renardy, M. Renardy, Phys. Fluids 12 (2000) 269.
- (45) L.J. Dietsche, A.C. Neubauer, Chem. Eng. Sci. 64 (2009) 4543.
- (46) D. Gueyffier, J. Li, A. Nadim, R. Scardovelli, S. Zaleski, J. Comput. Phys. 152 (1999) 423.
- (47) V.R. Gopala, B.G.M. van Wachem, Chem. Eng. J. 141 (2008) 204.
- (48) J.E. Pilliod., E.G. Puckett, J. Comput. Phys. 199 (2004) 465.
- (49) J.H. Xu, G.S. Luo, G.G. Chen, J.D. Wang, J. Membr. Sci. 266 (2005) 121.
- (50) J. Husny, J.J. Cooper-White, J. Non-Newton. Fluid Mech. 137 (2006) 121.
- (51) A. Gupta, S.M. Sohel Murshed, R. Kumar, Appl. Phys. Lett. 94 (2009) 164107.
- (52) C.F. Christopher, S.L. Anna, J. Phys. D: Appl. Phys. 40 (2007) R319.
- (53) F.F. Nazzal, M.R. Wiesner, Water Environ. Res. 68 (1996) 1187.
- (54) Fluent, Inc., 2003. FLUENT 6.1 User s Guide.
- (55) C.W. Hirt, B.D. Nichols, J. Comput. Phys. 39 (1981) 201.
- (56) N. Hsu, N. Ashgriz, J. Colloid Interface Sci. 270 (2004) 146.
- (57) A.A. Saha, S.K. Mitra, J. Colloid Interface Sci. 339 (2009) 461.
- (58) D. Gerlach, G. Tomar, G. Biswas, F. Durst, Int. J. Heat Mass Transfer 49 (2006) 740.
- (59) J. U. Brackbill, D. B. Kothe, C. Zemach, J. Comp. Phys. 100 (1992) 335.
- (60) W. J. Rider and D. B. Kothe, J. Comp. Phys. 141 (1998) 112.
- (61) I.W. Cumming, R.G. Holdich, I.D. Smith, J. Membr. Sci. 169 (2000) 147.
- (62) M. Renardy, Y. Renardy, J. Li, J. Comput. Phys. 171 (2001) 243.
- (63) J. Eells, Math. Intell. 9 (1987) 53.
- (64) A. I. Hill, C. Pozrikidis, J. Colloid Interface Sci. 356 (2011) 763.
- (65) R. Finn, Capillary surface interfaces. Not. Am. Math. Soc. 46 (1999) 770.
- (66) P. Concus, R. Finn, Microgravity Sci. Technol. 3 (1990) 87.
- (67) P. Concus, R. Finn, Acta Math. 132 (1974) 177.
- (68) V. Brady, P. Concus, R. Finn, Microgravity Sci. Technol. 15 (2004) 31.
- (69) A. Ullah, R. G. Holdich, M. Naeem, V. M. Starov, J. Membr. Sci. 401-402 (2012) 118.
- (70) N. Ichikawa, K. Hosokawa, R. Maeda, J. Colloid Interface Sci. 280 (2004) 155.
- (71) H. Cho, H.Y. Kim, J.Y. Kang, T.S. Kim, J. Colloid Interface Sci. 306 (2007) 379.
- (72) H. Wong, S. Morris, C.J. Radke, J. Colloid Interface Sci. 148 (1992) 317.
- (73) V.S. Ajaev, G.M. Homsy, Annu. Rev. Fluid Mech. 38 (2006) 277.
- (74) J. Feng, J.P. Rothstein, J. Colloid Interface Sci. 354 (2011) 386.
- (75) S.H. Collicott, M.M. Weislogel, AIAA 42 (2004) 289.
- (76) B.C. Berndt, Ramanujan’s Notebooks, Springer Verlag, 1985.
- (77) N. Albright, Report LBL-6137 (1977).
- (78) J.H. Xu, S.W. Li, J. Tan, G.S. Luo, Microfluid. Nanofluid. 5 (2008) 711.
- (79) E. van der Zwan, R. van der Sman, K. Schroen, R. Boom, J. Colloid Interface Sci. 335 (2009) 112.