SOFIA/FORCAST and Spitzer/IRAC Imaging of the Ultra Compact H II Region W3(OH) and Associated Protostars in W3
Abstract
We present infrared observations of the ultra-compact H II region W3(OH) made by the FORCAST instrument aboard SOFIA and by Spitzer/IRAC. We contribute new wavelength data to the spectral energy distribution, which constrains the optical depth, grain size distribution, and temperature gradient of the dusty shell surrounding the H II region. We model the dust component as a spherical shell containing an inner cavity with radius AU, irradiated by a central star of type O9 and temperature K. The total luminosity of this system is . An observed excess of m emission in the SED can be explained by our viewing a cavity opening or clumpiness in the shell structure whereby radiation from the warm interior of the shell can escape. We claim to detect the nearby water maser source W3 (H2O) at 31.4 and m using beam deconvolution of the FORCAST images. We constrain the flux densities of this object at m. Additionally, we present in situ observations of four young stellar and protostellar objects in the SOFIA field, presumably associated with the W3 molecular cloud. Results from the model SED fitting tool of Robitaille et al. (2006; 2007) suggest that two objects (2MASS J02270352+6152357 and 2MASS J02270824+6152281) are intermediate-luminosity () protostars; one object (2MASS J02270887+6152344) is either a high-mass protostar with luminosity L⊙ or a less massive young star with a substantial circumstellar disk but depleted envelope; and one object (2MASS J02270743+6152281) is an intermediate-luminosity () protostar nearing the end of its envelope accretion phase or a young star surrounded by a circumstellar disk with no appreciable circumstellar envelope.
1 INTRODUCTION
Ultra-compact H II regions can be found throughout the galaxy surrounding newly formed massive stars just completing the accretion stage and entering their main sequence lifetimes. UCHs are small ( pc), hot ( K), and massive (), and emit (Churchwell 2002). These regions of ionized gas are surrounded by molecular and dust clouds, out to as far as ten times the radius of the UCHs themselves (Conti et al. 2007). This causes attenuation of much of the emitted luminosity, as it is absorbed and reradiated in the infrared.
W3(OH) is one of the largest and best studied UCH II regions known in the Galaxy. It is at a distance of approximately 2.04 kpc in the Perseus arm (Hachisuka). Like most UCH II regions, is surrounded by its natal dust and molecular gas envelope as well as a larger giant molecular cloud encompassing W3(OH) and W3(H2O), W3 Main, and AFGL 333; these are all regions of potentially triggered star formation, based on their positions on the dense outskirts of a much less dense cavity in the W3 GMC (Ruch et al. 2007; Moore et al. 2007). Further review of star formation in the W3 GMC is presented by Megeath et al. (2008).
Line emission from the molecular gas surrounding W3(OH) has been mapped at submillimeter and radio wavelengths in the transitions of OH and H2O (Mader, Johnston & Moran 1978), HCN (Turner & Welch 1984), NH3 (Wilson, Bieging & Downes 1978; Zeng et al. 1984; Tieftrunk et al. 1998), CH3OH (Menten et al. 1992), C18O (Wink et al. 1994), and C17O (Wyrowski et al. 1997). This molecular emission is found out to a diameter region. These studies have particularly focused on further characterizing the molecular gas and the OH and methanol masers within and around W3(OH), as well as the hot core/water maser region W3(H2O) approximately 6” to the east. In continuum emission, however, the dust cocoon surrounding the UCH II region comes into primary focus.
The dust component to the UCH II W3(OH) was detected by Wynn-Williams, Becklin, & Neugebauer (1972) at m; the dust component is optically thick in the near- and mid-infrared. chini86 studied the cold dust at wavelengths of 350 m and 1.3 mm. Using a spherically symmetric radiative transfer model, they concluded that the inner cavity ( cm) of the UCH II region is depleted of dust, rather than having dust density that increases approaching the central star. A large amount of visual extinction (A) in a thick outer shell was required to explain the decline in emission at m. Utilizing airborne data, Campbell et al. (1989) showed that the dust cocoon is optically thick in the far-infrared and developed a more detailed model containing an H II region and a cavity. Surrounding the cavity is a dusty region with a free-fall density distribution and a temperature gradient through the dust cloud. More recently, Stecklum et al. (2002) presented high spatial resolution, ground-based 10 and 20 m images of W3(OH). From these data, the model for the dust shell was further developed and contained a Gaussian density distribution with an inner cavity of radius 2270 AU and stellar luminosity of .
In this work, we present new, high spatial resolution observations of the W3(OH) region in the wavelength range m obtained with the FORCAST instrument (Herter et al. 2012) on SOFIA (Young et al. 2012) and with the Infrared Array Camera (IRAC; Fazio et al. 2004) on the Spitzer Space Telescope (Werner et al. 2004). These wavelengths are critical for determining the spectral energy distribution (SED) of the W3(OH) dust cocoon and thus for making a measurement of its total luminosity. We combine our data with 2MASS (Skrutskie et al. 2006) fluxes and other data published in the literature to construct SEDs for the W3(OH) dust component. We model the dust component as a dusty shell around the H II region and compute the emergent flux using radiative transfer code. In addition, we present in situ observations of four stellar and protostellar objects in the SOFIA/FORCAST field. We fit the SEDs of these objects to those of high- and intermediate-mass protostars containing dusty circumstellar envelopes and circumstellar disks. We discuss the physical properties of all these objects.
2 OBSERVATIONS
2.1 SOFIA/FORCAST Observations
Observations were conducted on December 8, 2010 aboard the Stratospheric Observatory for Infrared Astronomy (SOFIA), using the Cornell-built Faint Object Infrared Camera for the SOFIA Telescope (FORCAST) (Adams et al. 2010). FORCAST uses a Si:As BIB detector array at wavelengths m and a Si:Sb BIB array at m. The detector has a pixel scale (rectified) over a total field of view of . Four filters were utilized for these observations, with central wavelengths (and bandpasses) at 19.7 (5.5), 24.2 (2.9), 31.4 (5.7), and 37.1 (3.3) m. The dichroic beamsplitter was used to obtain the wavelength pairs 19.7/37.1 and 24.2/31.4 m. Asymmetrical chopping with respect to the optical axis was applied in order to avoid telescope coma in the on-source beam. The chop throw was and was designed to chop off nearby nebulosity. A 5-point dither pattern in C2NC2 mode (Herter et al. 2012) was implemented to remove bad pixels during post-processing. Integration times were 30 sec at every dither position which yielded a total of 150 sec in each filter configuration. The data were pipeline processed with the reduction algorithms described in Herter et al. (2012). A global solution to the calibration from the SOFIA Early Science phase was applied to the images (Herter et al. 2012). We discuss flux extraction of sources in §3. Finally, we applied color corrections to the extracted fluxes as computed by an instrument model with model atmosphere (Herter et al. 2012).
2.2 Spitzer/IRAC Observations
We used data obtained with IRAC on Spitzer. The data were taken from observations that were obtained in high dynamic range (HDR) mode, whereby two images are taken in succession at 0.4s and 10.4s integration times. The brightest objects in the field, including W3(OH) were saturated in the longer frames, so we used the 0.4s exposure time frames to construct the mosaic that was used for the bright source photometry. The following AORIDs were used: 5050624, 19305728, 20590592, 38744064, 38757632, 38763776, 38769408, 38770944, 38790656, and 38801408. We utilized the Basic Calibrated Data (BCD) version S18.5 products from the Spitzer Science Center (SSC) standard data pipeline. For the 3.6 and 4.5 m bands, data from the cryogenic and warm mission were combined. For the 5.8 and 8.0 m BCDs, bright source artifacts such as “banding” (Hora et al. 2004) were removed using the IMCLEAN image processing routines11footnotemark: 166footnotetext: http://irsa.ipac.caltech.edu/data/SPITZER/docs/dataanalysistools/tools/contributed/irac/imclean/. The images were mosaiced with IRACproc (Schuster, Marengo, & Patten 2006) which uses a version of the mopex mosaicing software (Makovoz & Khan 2005) developed at the SSC. The final mosaic was made with a pixel scale of /pixel.
3 RESULTS
3.1 Imagery and SOFIA/FORCAST detections
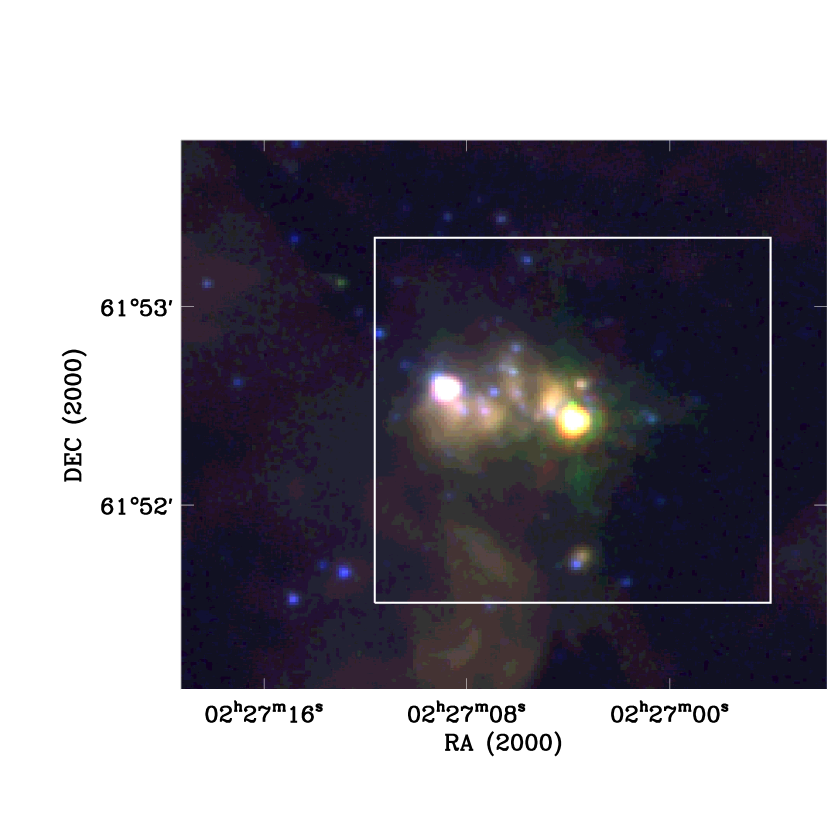
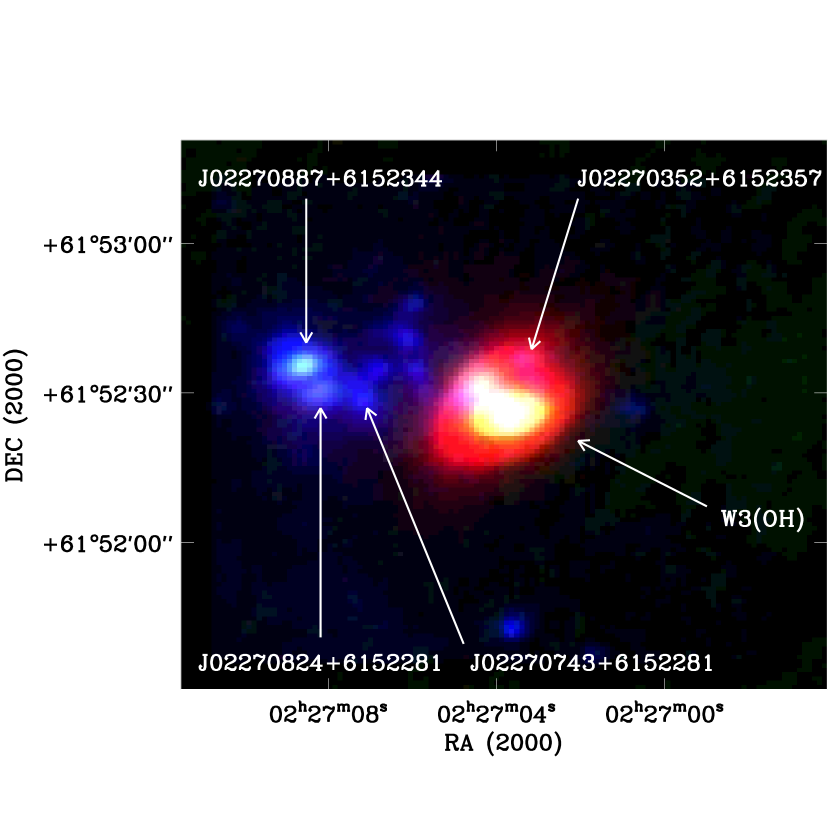
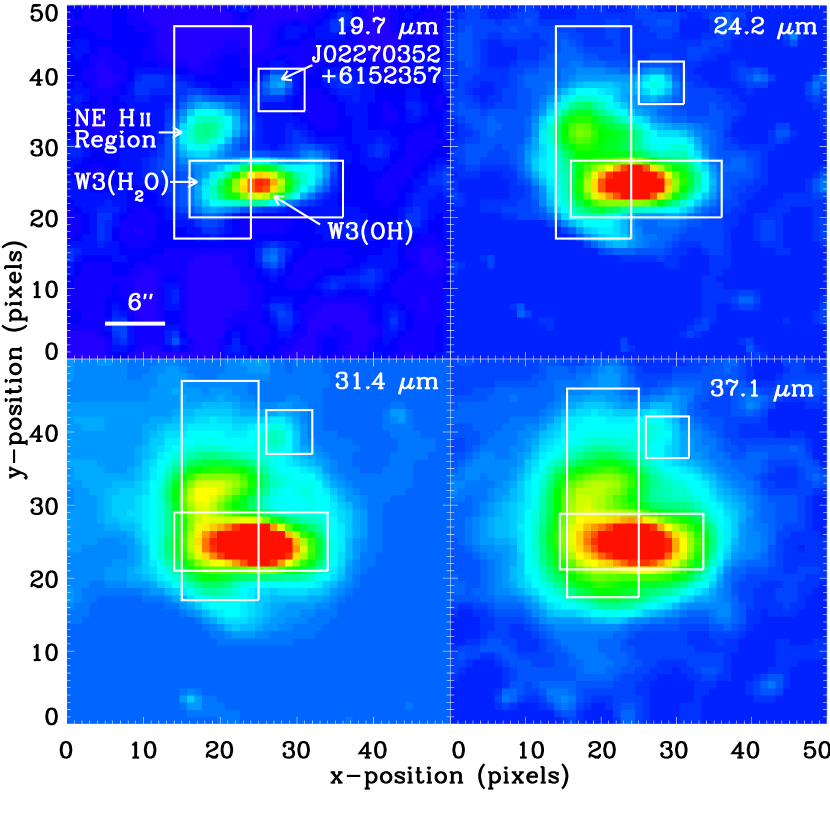
Reduced, multi-wavelength IRAC and FORCAST images are shown in Figs. 1 and 2. The measured image quality in the FORCAST images was consistent with the overall image quality achieved by SOFIA during the Early Science period (Herter et al. 2012). W3(OH) is spatially resolved in the FORCAST images. Within W3(OH), the dual peaks in flux correspond to a bright cometary Southwestern H II region and a dimmer, more eliptically-shaped Northeastern H II region (Stecklum et al. 2002).
We detect four mid-infrared point sources in the SOFIA field. These sources are designated in the 2MASS catalog as J02270352+6152357, J02270743+6152281, J02270824+6152281, and J02270887+6152344. There are also m counterparts to these sources in the band image of Tieftrunk et al. (1998). However, there is a set of rich clusters of low mass stars in this region, so confusion with neighboring sources precludes our making an accurate measurement of their m fluxes. In Fig. 2, we label the sources with their corresponding designations. All four sources were detected by SOFIA/FORCAST at 19.7, 24.2, and 31.5 m; J02270352+6152357, J02270824+6152281, and J02270887+6152344 were also detected at 37.1 m. In addition, all four sources were detected in the Spitzer images at wavelengths of 3.6, 4.5, 5.8, and 8.0 m; however, the 8.0 m detection for J02270743+6152281 suffers from contamination by relatively bright nebulosity extending from below the source. The fluxes for J02270743+6152281, J02270824+6152281, and J02270887+6152344 were extracted from FORCAST images by fitting Gaussian functions to flux line profiles and from Spitzer images by aperture photometry. The corresponding flux densities are given in Table 1. Flux extraction for J02270352+6152357 is discussed in §3.2.
3.2 Deconvolved FORCAST images
We performed beam deconvolution on each of the FORCAST images in order to search for the hot core W3(H2O) and to measure the size of W3(OH). The images were deconvolved using the maximum likelihood method (Richardson 1972; Lucy 1974). Like all deconvolution methods, knowledge of the point-spread function (PSF) of an unresolved source is needed at each wavelength. The delivered PSF can change due to different wind loads on the secondary mirror and differences in the telescope flexure as a function of telescope position. To mitigate these effects on ground-based telescopes, high S/N observations of mid-infrared bright stars are usually taken immediately before and/or after each science target observation and as close to the science target as possible ( away) so as to get the best PSF calibration for use in the deconvolution procedure. However, in our case, finding a PSF star that is bright enough at wavelengths out to 40 m that fulfills these requirements is nearly impossible and thus was not attempted. Standard star images taken throughout our flight similarly did not have sufficient S/N for use as a PSF calibrator at the longer wavelengths. Therefore, we used these standard stars observations to determine an average FWHM for each wavelength for the flight. Then artificially generated PSFs (using an Airy pattern calculated from the wavelength, telescope diameter, and central obscuration diameter) were constructed and convolved with a Gaussian to achieve PSFs with FWHMs that equaled the measured average FWHMs of the standard stars. These idealized PSFs were then used in the deconvolution procedure. These deconvolved images compare favorably to simple unsharp masking of the original images, and hence all of the substructures revealed in the deconvolved images are believed to be real with high confidence. Final image resolutions are about a factor of two better than the natural resolutions for each image.
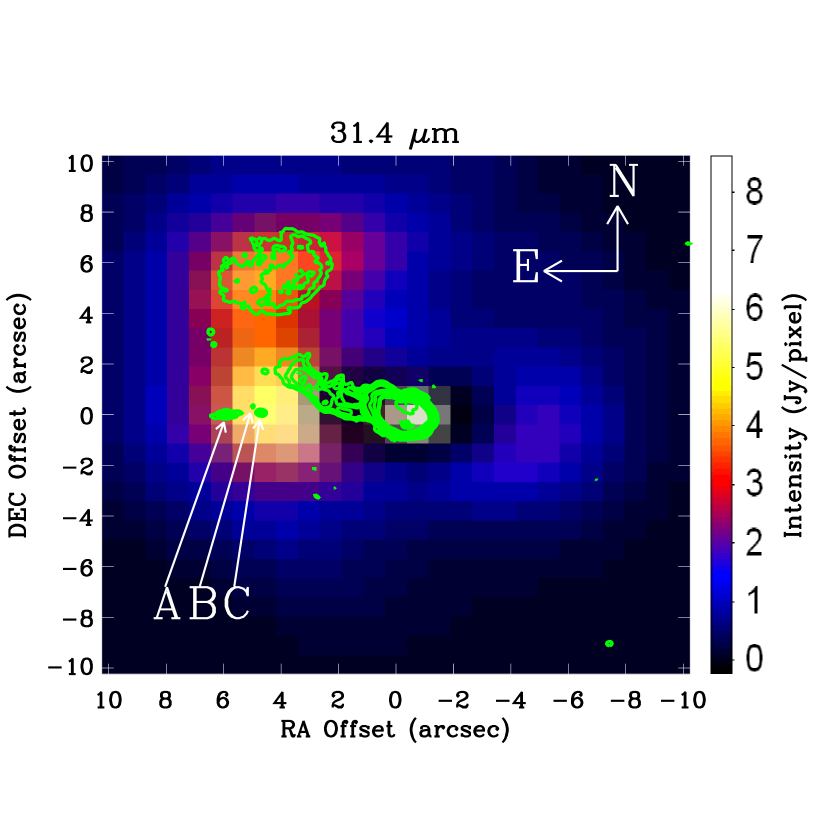
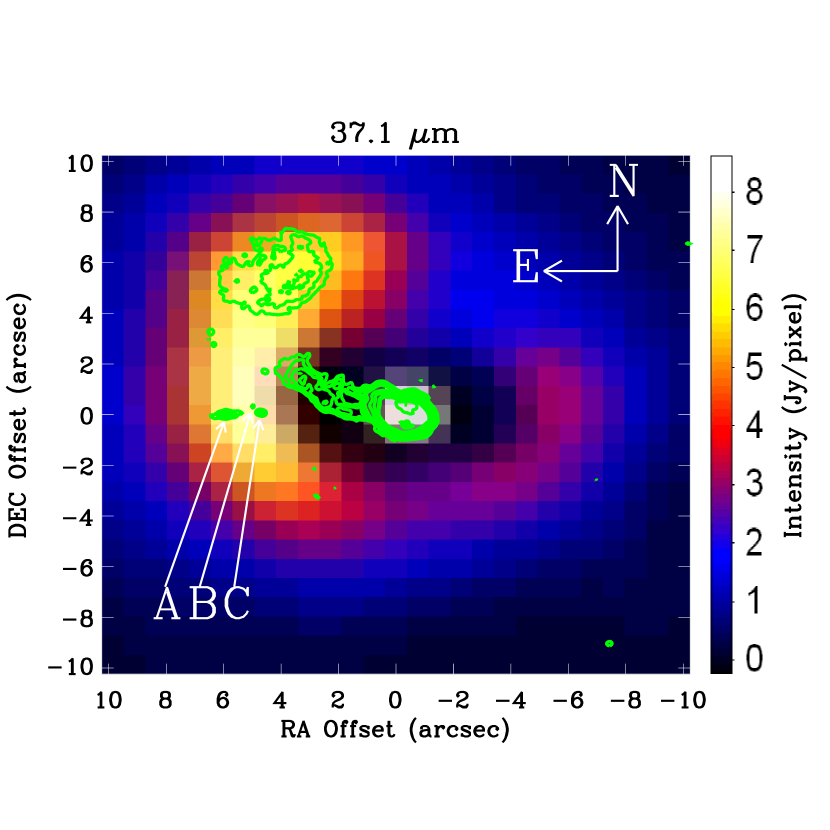
We claim to detect unresolved emission from the hot core W3(H2O) at 31.4 and m. Figs. 3 and 4 show the region near W3(H2O) in the deconvolved images at 31.4 and 37.1 m, respectively. In each case, the central core of W3(OH) has been fit to a 2-dimensional Gaussian function and subtracted from the respective image. Figs. 3 and 4 also contain 8.4 GHz VLA observations from (Wilner, Reid & Menten 1999). The radio continuum image shows a cometary component extending in the Northeast direction from the peak of W3(OH). The radio image also shows emission from the Northeast H II region (Stecklum et al. 2002) above the cometary component. In the 8.4 GHz continuum, the W3(H2O) clumps A, B, and C (Wyrowski et al. 1999) are resolved. Figs. 3 and 4 show residual emission at 31.4 and 37.1 m in the vicinity of W3(H2O). Moreover, the position of this residual emission shifts in wavelength from close to W3(H2O) C at 31.4 m towards W3(H2O) A at 37.1 m.
Flux extraction for W3(OH), W3(H2O), the Northeast H II region, and 2MASS J02270352+6152357 was performed using the deconvolved images. The resolved diameter of W3(OH) in the deconvolved images (Fig. 5) is approximately 40 pixels, corresponding to AU. We used a 15-pixel aperture radius to extract the flux density at 19.7 m and 20-pixel aperture radii to extract the flux densities at 24.2, 31.4, and 37.1 m; we then subtracted the flux densities measured for the Northeastern H II region and 2MASS J02270352+6152357 (discussed next). The resulting integrated flux densities for W3(OH) are listed in Table 1.
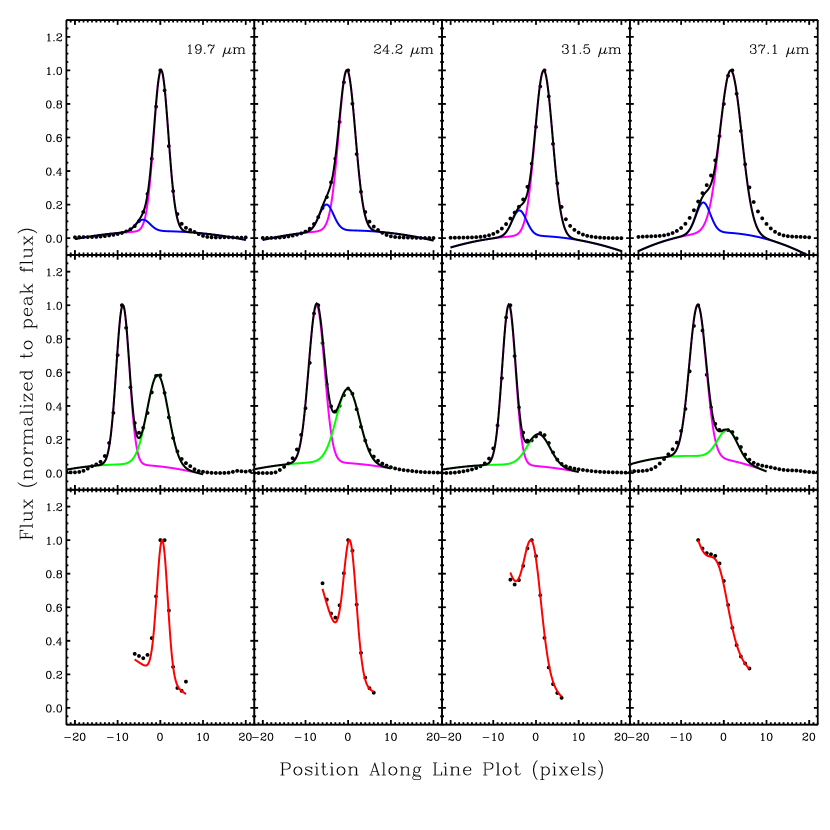
Fig. 5 shows boxed regions where the flux profiles for W3(OH) and W3(H2O) were extracted (integrated vertically) and fit to Gaussian functions (Fig. 6). Each of the profiles shows a secondary peak coincident with the location of W3(H2O). The area under the profile fit to W3(H2O) yields its flux. The extracted flux densities for W3(H2O) are also listed in Table 1. We discuss our detection of this source further in §4.2. The flux densities for W3(OH) measured in this fashion agree to within of the flux density measured from large aperture photometry, which is listed in Table 1.
Fig. 5 also shows the regions selected for line profiles of the Northeastern H II region (integrated horizontally) and 2MASS J02270352+6152357 (integrated vertically). The latter source is flagged in the 2MASS catalog as confused with neighboring objects; thus we do not consider its m flux. The line profiles for these 1-dimensional integrations are shown in Fig. 6 and their flux densities, determined by Gaussian line fits, are listed in Table 1.
4 DISCUSSION
4.1 W3 (OH)
In Fig. 7 , we show the SED for W3 (OH) with additional data taken from the literature: 2MASS (2.2 m), Stecklum et al. (2002) (8.8, 12.7, and 17.8 m), MSX (m, Egan et al. 1999), IRAS (60 and 100 m), and Chini, Krügel & Kreysa (1986) (1.3 mm). The IRAS flux densities were taken as upper limits due to contamination from nearby sources.
We model the dust component as an optically thick, dusty shell around the H II region, irradiated at the inner boundary by the central star with surface temperature K. The emergent SED of the model was computed using the DUSTY radiative transfer code22footnotemark: 277footnotetext: Ivezic, Z., Nenkova, M., and Elitzur, M. 1996, University of Kentucky, http://www.pa.uky.edu/m̃oshe/dusty/. The density distribution of this model (; ) is based on a free-fall density profile (e.g. Hartmann 2009). We chose the composition of the dust to be 53% silicates and 47% graphite grains (Draine & Lee 1984). We consider a grain size distribution , whereby (Mathis, Rumpl, & Nordsieck 1977; hereafter MRN), and with a minimum grain size of 0.001 m and a maximum grain size of 0.25 m (MRN; Sellgren 1984). We set the temperature of the inner edge of the shell at 400 K for this model. This is substantially cooler than the dust sublimation temperature ( K), indicating the presence of a large cavity depleted of dust and consistent with previous work (Chini, Krügel & Kreysa 1986; Stecklum et al. 2002). The total luminosity of this model is . The SED of this model is shown in Fig. 7 as the dotted line and the relevant model parameters are listed in Table 2.
Although they both use an optically thick, free-fall density shell in the IR, this model differs quantitatively from the model presented in Stecklum et al. (2002). The central star is of later O-type and cooler surface temperature. The inner dust shell radius is nearly four times smaller and the outer radius nearly twice as compact as in Stecklum et al. These parameters are necessary in order to explain the mid-IR emission in the range m. This work finds that the total luminosity is slightly lower than previous estimates.
Note this model cannot account for the excess emission at m. One explanation for this emission is clumpiness in the dust cloud, or a cavity opening, which allows short wavelength radiation from warm dust to leak through holes in the cloud. We model radiation from the warmer interior of the shell as a single-temperature (425 K) blackbody component. The plausibility of this model is evident in Fig. 7, whereby an excellent fit to the data is aChieved with a temperature consistent with that of the interior of the dust shell. There may also be a scattered light component at these wavelengths, but we do not model such a component since its geometry is relatively unconstrained.
An alternate explanation for the excess at m is a relatively high abundance of very small grains compared with large grains. In order to fit the data at m, we would need to consider a model with a modified MRN grain size distribution (). However, in the ionized region, small grains can become super-heated and destroyed. The emission would come from a relatively high abundance of small grains in the infalling shell; such grains would need to be primordial. Given the jets that are seen in molecular emission, it is most likely that the excess short wavelength radiation originates in a cavity opening. The prediction one can make from this explanation is the presence of continuum emission in the amporphous silicate absorption band at 9.7 m, which decreases the depth of the absorption feature. Mid-IR spectroscopy in the m window could be used to test this prediction.
4.2 W3(H2O)
In the radio continuum, the hot core W3(H2O) consists of 3 clumps designated as A, B, and C (Wyrowski et al. 1999; Wilner, Reid & Menten 1999). An early claim to a detection of W3(H2O) in the infrared came from Keto et al. (1992) who presented ground-based observations at m showing emission at the location of W3(H2O) C, which lies approximately East of W3(OH). No emission was seen from sources A and B, which lie approximately East of W3(OH). However, this observation was not substantiated by Stecklum et al. (2002) who did not detect any emission from these sources at m, despite their spatially resolving W3(OH). In the FORCAST data, the separation of the peaks in the double-peaked line profile (Fig. 6) yields the separation between W3(H2O) and W3(OH), which we find to be at 37.1 m and at 31.4 m. Components A and C form a massive protobinary system (Minh & Chen 2007). Based on the gas chemistry of these sources, Minh & Chen (2007) suggest that component A may be more deeply embedded and younger than component C within yr. This would be consistent with our results that show a wavelength dependence for the m emission. However, it should be noted that this dependence on wavelength may also result from combined temperature and optical depth gradients.
4.3 Protostars and Young Stars with Disks in the SOFIA Field
We construct SEDs for the four point sources in the FORCAST field and compare them with model SEDs of protostellar and young stellar objects using the online SED fitting tool of Robitaille et al. (2006; 2007). The SEDs and those of the best-fit models are shown in Fig. 8. We provide comments on each object in §4.3.1 – §4.3.4.
4.3.1 2MASS J02270352+6152357
The best fitting model for J02270352+6152357 corresponds to a protostellar object with a mass of 3.96 M⊙ and luminosity of 236 L⊙. The model indicates that this object is young and cool, with an age of just under 5000 years and a temperature in the low 4000s of Kelvins. It is undergoing active envelope accretion from a massive envelope (11.7 M⊙) onto a low-mass disk (). The self-consistency of the top ten models with this best-fitting model suggest that this object is indeed a young, intermediate-luminosity protostar.
4.3.2 2MASS J02270743+6152281
The SED fitting tool produced two families of best-fit models for J02270743+6152281, with the first family headed by the best-fitting SED and the second by the second-best fit. The families differ in the object’s stage of envelope accretion and disk formation, with one family representing an object still actively undergoing envelope accretion and the other corresponding to a more highly-developed disk with a depleted envelope.
The best fitting (total ) model, representing the first family of models within the top ten best fits, indicates that this object is a protostellar object with a mass of 5.69 M⊙ and a luminosity of 768 L⊙, surrounded by a relatively substantial envelope (0.153 M⊙) and a smaller disk ( M⊙). This model has a low but nonzero rate of envelope accretion, and suggests an age of yr, with an internal temperature of 16,500 K. These parameters point to an intermediate-luminosity protostar nearing the end of its envelope accretion phase.
The second-best fit (total ), and correspondingly the second family of fits, represents an object with a fully formed disk and a completely depleted envelope no longer accreting material onto the disk. This model protostar has an intermediate mass somewhat higher than the alternative family, of 9.17 M⊙. Its envelope is negligible ( M⊙), and its disk has a mass of M⊙. It suggests an age of just over yr and a temperature of 24,500 K. Given the protostellar mass and these parameters, this family of models likely corresponds to a young star with a circumstellar disk.
The two families of models differ primarily in the presence or absence of an amorphous silicate absorption feature at 9.7 m, which is typically seen in an envelope-dominated SED. Highly sensitive mid-infrared spectroscopy could be used to resolve the degeneracy between these two families of models.
4.3.3 2MASS J02270824+6152281
Model fitting for J02270824+6152281 presents a convergent set of parameters. The best fit model corresponds to a 6.11 M⊙ protostar with a luminosity of 432 L⊙. This model suggests the object is a young protostar (approximately 8000 years) with a temperature of around 4000 K. The object is embedded in a large 35.1 M⊙ envelope with a disk of mass M⊙, indicating that this object is likely experiencing ongoing disk formation. The relatively high envelope accretion rate displayed by this model ( M⊙ yr-1) supports this conclusion. The models predict substantial far-IR emission arising from the envelope, meaning followup observations in the far-IR range could confirm our assessment.
4.3.4 2MASS J02270887+6152344
For J02270887+6152344, the data again result in two possible families of models, representing either an intermediate- to high-mass protostellar object with a large envelope or an older intermediate-mass young star with a clearly defined disk and minimal envelope. The top three fits all corresponded to the former of these models, indicating its greater likelihood for accuracy.
The best-fitting (total ) model for this source represents a 10.5 M⊙ protostar surrounded by a natal dust envelope containing 240 M⊙ of material and a negligible disk. The model object has a luminosity of 3000 L⊙. An age of approximately 2000 yr and a temperature in the 4000s of Kelvins indicate that the object is protostellar in nature.
The second group of well-fitting models is represented by the fourth-best fitting (total ) model. This model corresponds to a young star of mass 9.8 M⊙, with a depleted envelope (mass approximately M⊙, indicating that the envelope has nearly entirely accreted onto the disk). This model possesses an age of over years and an internal temperature of 25,400 K, indicating a more advanced stage in development than the first family of models presented.
These families of models diverge at far-infrared wavelengths. With only present data, we therefore cannot rule out either the higher-mass, younger protostellar object or the intermediate-mass, more evolved young star. Further observations of this object at far-IR and/or submillimeter wavelengths are required to resolve the degeneracy in the model parameters.
5 CONCLUSIONS
We present SOFIA/FORCAST and Spitzer/IRAC observations of the UCH II region W3(OH) in the wavelength range m. These data, combined with other published data, have been used to constrain the optical depth, grain size distribution, and temperature gradient in the dusty shell surrounding the H II region. The total luminosity of W3(OH) is , indicating that the central star is an O9 star with surface temperature K. A clumpy dust distribution or cavity opening revealing warm interior grains is necessary to explain excess emission at m.
We detect the hot core W3(H2O) at 31.4 and m, and constrain its flux density at m using deconvolved FORCAST images.
In addition, SEDs have been constructed for four young stellar or protostellar objects which lie in the SOFIA/FORCAST field. The model SED fitting tool of Robitaille et al. (2006) was used to determine the nature of these objects. 2MASS J02270352+6152357 is an intermediate-luminosity protostar undergoing envelope accretion; 2MASS J02270824+6152281 is most likely a very young intermediate-mass protostar with a large natal envelope; 2MASS J02270887+6152344 is a high-luminosity object which is either a protostar with ongoing envelope accretion onto a young disk or a young star with a circumstellar disk and a depleted envelope; and 2MASS J02270743+6152281 could be an intermediate-luminosity protostar or potentially a young star with a developed disk and an almost entirely depleted envelope. Further observations in the mid-IR, far-IR and/or submillimeter range(s) are required to definitively characterize 2MASS J02270887+6152344 and 2MASS J02270743+6152281.
Facilities: 2MASS, Spitzer Space Telescope, SOFIA, IRAS
References
- Adams et al. (2010) Adams, J. D., Herter, T. L., Gull, G. E., Schoenwald, J., Henderson, C. P., Keller, L. D., De Buizer, J. M., Stacey, G. J., & Nikola, T. 2010, Proc. SPIE, 7735, 62
- Allen (2000) Allen, C. W. 2000, Allen’s Astrophysical Quantities, Fourth Edition, Ed. Cox, A. N., (New York: Springer-Verlag)
- Beuther, SChilke & Menten (2002) Beuther, H., SChilke, P., & Menten K. M. 2002, ApJ, 566, 945
- Campbell et al. (1989) Campbell, M. F., Lester, D. F., Harvey, P. M., & Joy, M. 1989, ApJ, 345, 298
- Chini, Krügel & Kreysa (1986) Chini, R., Krügel, E., & Kreysa, E. 1986, A&A, 167, 315
- Churchwell (2002) Churchwell, E. 2002, ARA&A, 40, 27
- Conti et al. (2007) Conti, P., Rho, J., Furness, J., & Crowther, P. 2007, Proceedings of the International Astronomical Union, 3, 285
- Draine & Lee (1984) Draine, B. T. & Lee, H. M. 1984, ApJ, 285, 89
- Dreher & Welch (1981) Dreher, J. W. & Welch, W. J. 1981, ApJ, 245, 857
- Egan et al. (1999) Egan M.P., Price S.D., Moshir M.M., Cohen M., Tedesco E., Murdock T.L., Zweil A., Burdick S., Bonito N., Gugliotti G.M., Duszlak, J. 1999, Air Force Laboratory Technical Report No. AFRL-VS-TR-1999-1522
- Fazio et al. (2004) Fazio, G. et al. 2004, ApJS, 154, 10
- Genzel et al. (1978) Genzel, R., Downes, D., Moran, J. M., Johnston, K. J., Spencer, J. H., Walker, R. C., HasChick, A., Matveenko, L. I., Kogan, L. R., & Kostenko, V. I. 1978, A&A, 66, 13
- Greenberg & Lee (1996) Greenberg, J. M. & Lee, A. 1996, A&A, 309, 258
- HaChisuka et al. (2006) HaChisuka, K., Brunthaler, A., Menten, K. M., Reid, M. J., Imai, H., Hagiwara, Y., Miyoshi, M., HoriuChi, S., & Sasao, T. 2006, ApJ, 645, 337
- Hartmann (2009) Hartmann, L. 2009, Accretion Processes in Astrophsics, Second Edition (Cambridge: Cambridge University Press)
- Herter et al. (2012) Herter, T. L., Adams, J. D., De Buizer, J. M., Gull, G. E., Schoenwald, J., Henderson, C. P., Keller, L. D., Nikola, T., Stacey, G., & Vacca, W. D. 2012, ApJ, 749L, 18
- Hildebrande (1983) Hildebrande, R. H. 1983, Royal Astronomical Society Quarterly Journal, 24, 267
- Hora et al. (2004) Hora, J. L. et al. 2004, Proc. SPIE, 5487, 77
- Keto et al. (1992) Keto, E., Proctor, D., Ball, R., Arens, J., and Jernigan, G. 1992, ApJ, 401, L113
- Lada et al. (1978) Lada, C., Elmegreen, B., Cong, H., & Thaddeus, P. 1978, ApJ, 226, L39
- Lucy (1974) Lucy, L. B. 1974, AJ, 79, 745
- Mader, Johnston & Moran (1978) Mader, G. L., Johnston, K. J., & Moran, J. M. 1978, ApJ, 224, 115
- Makovoz & Khan (2005) Makovoz, D., & Khan, I. 2005, in ASP Conf. Ser. 132, Astronomical Data Analysis Software and Systems VI, eds. P. L. Shopbell, M. C. Britton, & R. Ebert (San Francisco: ASP).
- Mathis, Rumpl, & Nordsieck (1977) Mathis J. S., Rumpl W., & Nordsieck K. H. 1977, ApJ, 217, 425
- Megeath et al. (2008) Megeath, S. T., Townsley, L. K., Oey, M. S., & Tieftrunk, A. R. 2008, Handbook of Star Forming Regions, Vol. 1, ed. Reipurth, B., 4, 264
- Menten et al. (1992) Menten, K. M., Reid, M. J., Pratap, P., Moran, J. M., & Wilson, T. L. 1992, ApJ, 401, L39
- Minh & Chen (2007) Minh, Y. C. & Chen, H.-R. 2007, IAUS, 237, ed. B. G. Elmegreen and J. Palous (Cambridge: Cambridge University Press), pp. 448-448
- Moore et al. (2007) Moore, T. J. T., Bretherton, D. E., Fujiyoshi, T., Ridge, N. A., Allsopp, J., Hoare, M. G., Lumsden, S. L., & Richer, J. S. 2007, Monthly Notices of the Royal Astronomical Society, 379:2, 663
- Reid et al. (1980) Reid, M., HasChick, A., Burke, B., Moran, J., Johnson, K., & Swenson, G. 1980, ApJ, 239, 89
- Richardson (1972) Richardson, W. H. 1972, JOSA, 62, 55
- Robitaille et al. (2006) Robitaille, T. P., Whitney, B. A., Indebetouw, R., Wood, K., & Denzmore, P. 2006, ApJS, 167, 256
- Robitaille et al. (2007) Robitaille, T. P., Whitney, B. A., Indebetouw, R., & Wood, K. 2007, ApJS, 169, 328
- Ruch et al. (2007) Ruch, G., Jones, T., Woodward, C., Polomski, E., & Gehrz, R. 2007, ApJ, 654, 338
- Schuster, Marengo, & Patten (2006) Schuster, M., Marengo, M., & Patten, B. 2006, Proc. SPIE, 6270, 74
- Sellgren (1984) Sellgren, K. 1984, ApJ, 277, 623
- Skrutskie et al. (2006) Skrutskie, M. F., Cutri, R. M., Stiening, R., Weinberg, M. D., Schneider, S., Carpenter, J. M., Beichman, C., Capps, R., Chester, T., Elias, J., Huchra, J., Liebert, J., Lonsdale, C., Monet, D. G., Price, S., Seitzer, P., Jarrett, T., Kirkpatrick, J. D., Gizis, J. E., Howard, E., Evans, T., Fowler, J., Fullmer, L., Hurt, R., Light, R., Kopan, E. L., Marsh, K. A., McCallon, H. L., Tam, R., Van Dyk, S., & Wheelock, S. 2006, AJ, 131, 1163
- Stecklum et al. (2002) Stecklum, B., Brandl, B., Henning, T., Pascucci, I., Hayward, T. L., & Wilson, J. C. 2002, A&A, 392, 1025
- Thronson & Harper (1979) Thronson, H. A. & Harper, D. A. 1979, ApJ, 230, 133
- Tieftrunk et al. (1998) Tieftrunk, A. R., Megeath, S. T., Wilson, T. L., & Rayner, J. T. 1998, A&A, 336, 991
- Turner & Welch (1984) Turner, J. L. & Welch, W. J. 1984, ApJ, 287, L81
- Ward-Thompson & Whitworth (2011) Ward-Thompson & D., Whitworth, A. P. 2011, An Introduction to Star Formation, Cambridge University Press
- Werner et al. (2004) Werner, M. et al. 2004, ApJS, 154, 1
- Wilner, Reid & Menten (1999) Wilner, D. J., Reid, M. J., & Menten, K. M. 1999, ApJ, 513, 775
- Wilson, Bieging & Downes (1978) Wilson, T. L., Bieging, J., & Downes, D. 1978, A&A, 63, 1
- Wink et al. (1994) Wink, J. E., Duvert, G., Guilloteau, S., Gusten, R., Walmsley, C. M., & Wilson, T. L. 1994, A&A, 281, 505
- Wynn-Williams, Becklin, & Neugebauer (1972) Wynn-Williams, C. G., Becklin, E. E., & Neugebauer, G. 1972, MNRAS, 160, 1
- Wyrowski et al. (1997) Wyrowski, F., Hofner, P., SChilke, P., Walmsley, C., Wilner, D., & Wink, J. 1997, A&A, 320, L17
- Wyrowski et al. (1999) Wyrowski, F., SChilke, P., Walmsley, C. M., & Menten, K. M. 1999, ApJ, 514, L43
- Young et al. (2012) Young, E. T., Becklin, E. E., De Buizer, J. M., Herter, T. L., Güsten, R., Dunham, E. W., Sankrit, R., Andersson, B-G, Backman, D., Burgdorf, M., Casey, S. C., Erikson, E. F., Gehrz, R. D., Harper, D. A., Helton, L. A., Horner, S. D., Howard, C. D., Klein, R., Krabbe, A., Marcum, P. M., McLean, I. S., Meyer, A. W., Miles, J. W., Reach, W. T., Rho, J., Richter, M. J., Roellig, T. L.,Roeser, H-P, Sandell, G., Savage, M. L., Smith, E. C., Shuping, R. Y., Temi, P., Vacca, W. D., Vaillancourt, J. E., Wolf, J., and Zinnecker, H 2012, ApJ, 749L, 17
- Zeng et al. (1984) Zeng, Q., Hermsen, W., Wilson, T. L., & Batria, W. 1984, A&A, 140, 169


| J02270352+6152357 | W3(OH) | Northeastern H II | W3(H2O) | J02270743+6152281 | J02270824+6152281 | J02270887+6152344 | |
|---|---|---|---|---|---|---|---|
| RA (2000) | 02 27 03.52 | 02 27 03.83 | 02:27:07.43 | 02:27:08.24 | 02:27:08.87 | ||
| DEC (2000) | +61 52 35.7 | +61 52 24.8 | +61:52:28.1 | +61:52:28.1 | +61:52:34.4 | ||
| Parameter | Value |
|---|---|
| 31145 K | |
| 576 AU | |
| 29942 AU | |
| 400 K | |
| 26 K | |
| Composition fraction, silicates | 53% |
| Composition fraction, graphite | 47% |
| 1.5 | |
| 3.5 | |
| 2.8 |