Ab initio study of the two-dimensional metallic state at the surface of SrTiO3: importance of oxygen vacancies
Abstract
Motivated by recent angle-resolved photoemission spectroscopy (ARPES) observations of a highly metallic two-dimensional electron gas (2DEG) at the (001) vacuum-cleaved surface of SrTiO3 and the subsequent discussion on the possible role of oxygen vacancies for the appearance of such a state Santander-2011-nature , we analyze by means of density functional theory (DFT) the electronic structure of various oxygen-deficient SrTiO3 surface slabs. We find a significant surface reconstruction after introducing oxygen vacancies and we show that the charges resulting from surface-localized oxygen vacancies –independently of the oxygen concentration– redistribute in the surface region and deplete rapidly within a few layers from the surface suggesting the formation of a 2DEG. We discuss the underlying model emerging from such observations.
I Introduction
In recent years, SrTiO3 (STO), which is a wide band-gap semiconductor (3.2 eV), has been commonly used as a substrate for the epitaxial growth of oxide heterostructures with other perovskite compounds such as the band insulator LaAlO3 (LAO) or the Mott insulator LaVO3. In 2004 Ohtomo and Hwang Ohtomo-2004-nature detected a two-dimensional electron gas (2DEG) state at the interface of a LAO/STO heterostructure. A polar catastrophe was suggested to be the cause for this state. Numerous experimental and theoretical studies have been carried out on this unusual metallic state since then Ohtomo-2004-nature ; Huijben-2006-nmat ; Nakagawa-2005-nmat ; Thiel-2006-science ; Eckstein-2007-nmat ; Reyren-2007-science ; Popovic-2008-prl ; Basletic-2008-nmat ; Cen-2009-science ; Janicka-2009-prl ; Li-2011-science ; Arras-2012-prb ; Zhong_2012 and fascinating features like superconductivity and coexistence with ferromagnetism have been attributed to this 2DEG. More recently, Santander-Syro et al. Santander-2011-nature and Meevasana et al. Meevasana-2011-nmat found that it is not necessary to have an interface with a polar interface with other materials in order to obtain a 2DEG at the STO surface. By simply fracturing bulk STO and using angle-resolved photoemission spectroscopy, these authors studied a vacuum cleaved STO (100) surface and found high carrier densities at the bare surface. While the authors’ findings opened a new scheme in oxide electronics, the precise nature of the 2DEG has remained elusive. Oxygen vacancies as n-type dopants and also as a by-product of the cleaving process were suggested to be related with the 2DEG Santander-2011-nature . In fact, in a recent work by Pavlenko et al. Pavlenko-2012-arXiv , it was found that oxygen vacancies at titanate interfaces are responsible for a two-dimensional magnetic state and a strong orbital reconstruction.
In view of the previous discussion, we performed density functional theory calculations for a number of SrTiO3 slabs with various concentrations of oxygen vacancies and analyzed the origin of the unusual metallic state appearing at the surface of the slabs. The paper is organized as follows. In the next section we present the computational details of our calculations. Section 3 is dedicated to the discussion of the electronic structure for various slabs and oxygen doping concentrations and finally in section 4 we summarize our findings and relate them with the experimental observations.
II Computational details
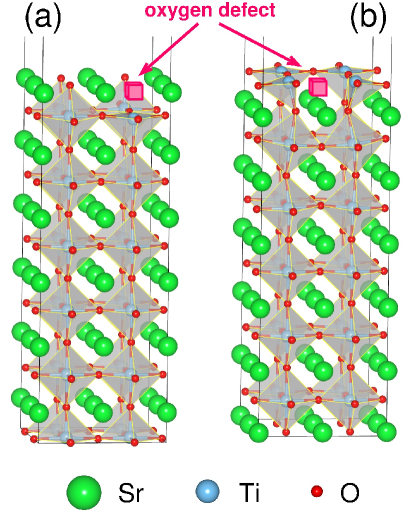
We have considered stoichiometric STO slabs on a (001) surface. Cleaving bulk STO in the [001] direction can lead either to SrO or to TiO2 surface terminations. Guisinger et al. Guisinger-2009-acsnano used cross-sectional scanning tunneling microscopy on in situ fractured SrTiO3 and observed atomically smooth terraces consisting of alternating surface terminations of TiO2 domains and SrO domains. Therefore, both kinds of slabs with SrO and TiO2 termination have been included in our study. The periodic slabs are separated by a vacuum layer of 20 Å. In our calculations, we use the experimental lattice constant 3.905 Å from the bulk SrTiO3 with a cubic structure. Nassau-1988-jcg The oxygen vacancy is introduced as a defect by removing one oxygen atom from the surface. Fig. 1 gives an example slab illustrated by a supercell with (a) SrO and (b) TiO2 termination. Here and in the following, we abbreviate the more precise “stoichiometric slab with oxygen defect in the SrO surface layer” by “SrO terminated slab”.
In order to clarify the electronic properties of surfaces with oxygen defects, we have performed calculations both for perfect and for oxygen deficient surfaces. Supercells with sizes , , , and were designed to represent different oxygen vacancy doping concentrations SrTiO3-x with , 0.0625, 0.0417, and 0.0278, respectively. Note that the authors of Ref. Santander-2011-nature, reported very small oxygen deficiency. We therefore restricted ourselves to concentrations . The considered models are also expected to help understand the distribution of the extra electrons introduced by the oxygen vacancy along the in-plane () and out-of-plane () directions.
The calculations were performed in the framework of density functional theory (DFT). Structure relaxations were done by considering the Born-Oppenheimer procedure as implemented in the Vienna ab initio simulation package (VASP) Kresse-1993-prb ; Kresse-1996-cms . The wave functions were represented using the projector augmented wave (PAW) method Blochl-1994-prb ; Kresse-1999-prb and we considered the LDA+U functional Liechtenstein-1995-prb with U = 5 and J = 0.64 eV for the Ti states Okamoto-2006-prl in all our relaxations. A plane wave cutoff of 500 eV was used. The Brillouin zone was sampled with a -mesh of: for the slab, for the slab, for the , and a for the slab. As a small surface oxygen defect concentration is not expected to change the bulk lattice constant, we relaxed only all internal coordinates of the slab but not the lattice parameters. Based on the optimized structure, the electronic properties were calculated using the all-electron full potential local orbital (FPLO) Koepernik-fplo1 method and we employed both the generalized gradient approximation (GGA) Perdew-1996-prl as well as the GGA+U approximation as exchange-correlation functionals within DFT.
III Electronic structure
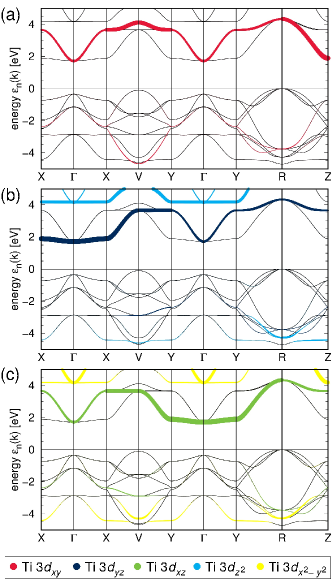
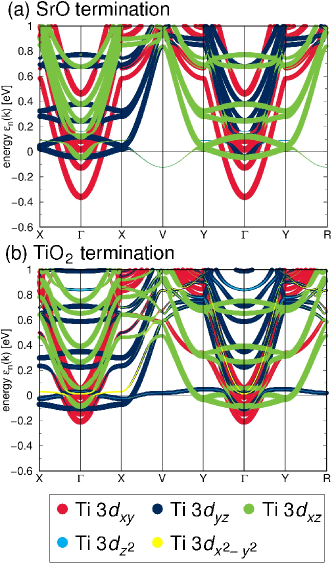
Bulk STO is a band insulator. In Fig. 2 we show the GGA calculated band structure of bulk STO with Ti band weights. The crystal field of the O octahedron surrounding Ti splits the Ti bands into energetically lower and higher states. We observe that the lowest unoccupied conduction band consists of three empty Ti bands which are degenerate at the point. At low temperatures ( K) STO undergoes a structural phase transition to a tetragonally distorted structure Cowley1996 and this degeneracy of the bands is lifted. Fig. 2 shows the Ti band character analyzed in the cartesian coordinate system, with an emphasis on the and paths that will become important once we break the perfect cubic symmetry by introducing a surface. Along the path, the band structure consists of a weakly dispersive heavy-mass Ti band and a pair of degenerate strongly dispersive light-mass Ti and Ti bands; along , electrons in the Ti band are heavy while those in degenerate and Ti are light.
In the following we will present a comparative analysis of various STO slabs and discuss the changes in the electronic properties observed when considering (i) undoped versus doped STO (ii) unrelaxed versus relaxed STO slab structures (iii) GGA versus GGA+U calculations, (iv) SrO-terminated versus TiO2-terminated slabs and (v) different oxygen-vacancy concentrations.
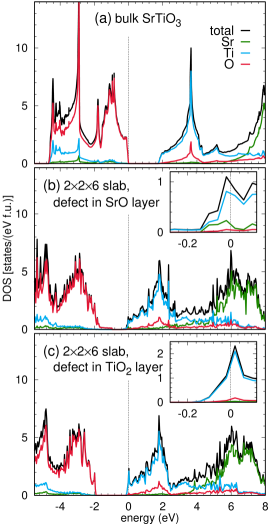
In Fig. 3 (a) we present the GGA calculated density of states (DOS) for bulk STO with no oxygen vacancies compared to relaxed SrO and TiO2 terminated slabs (Figs. 3 (b) and (c)) with an oxygen-vacancy concentration of . We observe that the extra electrons coming from the oxygen vacancy occupy the bottom of the conduction band with mostly Ti character, and a metallic state is obtained (compare Fig. 3 (a) with Fig. 3 (b) and (c)). One should mention here that the (relaxed) STO slabs without oxygen deficiencies show, as in the case of bulk STO, a band insulating state. Muthu_2011
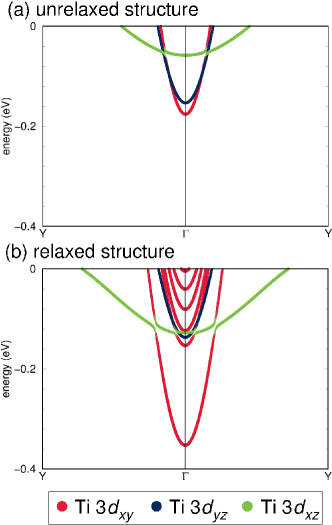
Essential for a reliable description of these systems is the structural relaxation of the slab geometry. In Fig. 4 we show Ti orbital-resolved band structures near the Fermi level for unrelaxed and relaxed geometries of the slab with an oxygen-vacancy concentration of for a TiO2 terminated surface. We observe a significant surface reconstruction after structure relaxation. While relaxation has little effect on the band, the splitting between and is considerable after relaxation, and the band becomes slightly less heavy ( (relaxed) against (unrelaxed)). This is in contrast to previous calculations that were performed without relaxing the structure Santander-2011-nature .
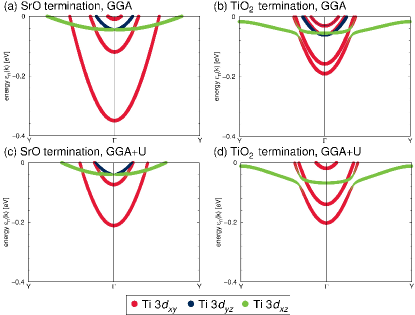
In order to analyze the importance of correlation effects (at least at the mean-field level as implemented in GGA+U) in the oxygen-deficient slabs, we show in Fig. 5 the band structure for SrO and TiO2-terminated slabs with an oxygen-vacancy concentration of near the Fermi level region along the path both within GGA and the GGA+U approach with eV and eV. Apart from a narrowing of the bandwidth in the GGA+U calculations with respect to the GGA results (compare Figs. 5 (c) and (d) with Figs. 5 (a) and (b) respectively) the main features of the metallic state are not influenced. We will concentrate in the following on GGA calculations in order to save some computational effort but also in order to sidestep an unnecessary arbitrariness arising from the choice of and values.
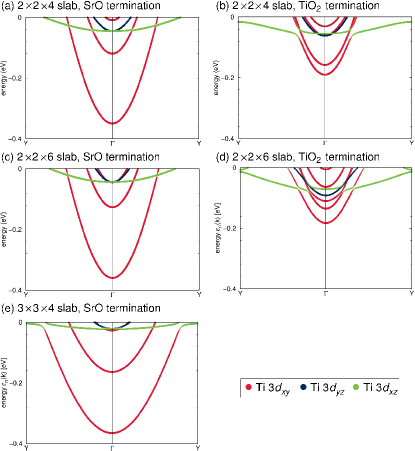
Next, we analyze the differences in electronic behavior of oxygen-deficient SrO-terminated slabs and TiO2-terminated slabs. In Fig 6 (a) and (b) we present the band structure for a relaxed slab with an oxygen-vacancy concentration of for the two terminations. Since the slab breaks some symmetries present in the bulk, the electronic structure splits into a ladder of subbands caused by the Ti atoms becoming non-equivalent. For both terminations, the Ti bands that were unoccupied conduction bands in the bulk (see Fig. 2), are now partially filled with the extra electrons gained from the oxygen vacancies, as mentioned above. The lowest sub-bands come from in-plane Ti states largely localized on the surface TiO2 layer (TiO2 termination) or on the layer right below the surface layer (SrO termination). The slab termination affects to some extent the band splitting in the bands at . For the same oxygen-vacancy doping, TiO2 terminated slabs lead to the occupation of more Ti bands than the SrO terminated slabs; this is simply due to the number of TiO2 layers significantly affected by the defect which is three in case of TiO2 termination versus two in case of SrO termination. In fact, a closer look at the slab structures reveals that the oxygen-vacancy environment in TiO2-terminated slabs is more distorted than in SrO-terminated slabs. This trend can also be observed at different oxygen-vacancy concentrations in Figs. 7 (a)-(e) where the band structure is shown for relaxed , and slabs (, and respectively) for both SrO and TiO2 terminated surfaces. Note that the slabs are computationally very demanding so that we restricted the analysis to the SrO termination. Also, while it appears that the Ti parabolas are wider for the slab (Fig. 7 (e)) compared to the and slabs (Fig. 7 (a)-(d)), this is only an effect of the different Brillouin zones; while the point is at a distance of Å-1 from the point in the supercells, it is at a distance of Å-1 for the supercell.
Comparing these band structures to ARPES observations Santander-2011-nature ; Meevasana-2011-nmat , we find good agreement. While Meevasana et al. see only the light Ti bands Meevasana-2011-nmat , Santander-Syro et al. detect also the shallow heavy bands deriving from Ti Santander-2011-nature .
We have also investigated the role of the higher lying states Pavlenko-2012-arXiv after introducing oxygen vacancies and observe that in contrast to the LAO/STO system, when an oxygen defect is introduced on the bare STO surface, the states of the Ti atoms neighboring the oxygen vacancy are hardly affected.
III.1 Two-dimensional electron gas
Aiura et al.Aiura-2002-surfs studied the behavior of the metallic state of lightly electron-doped bulk SrTiO3 with angle-integrated ultraviolet photoemission spectroscopy (UPS) and angle-resolved photoemission spectroscopy. They observed a metallic state with a sharp Fermi cut-off in the bulk band gap by doping electron carriers. By slight oxygen exposure, the UPS spectra showed a rapid decrease in the spectral intensity of the metallic state followed by a sudden energy shift of the valence band. Therefore, these spectral features in the bulk system are believed to be related to the oxygen deficiency. The difference between the metallic state for electron-doped bulk STO and electron-doped STO surfaces is the localization of the itinerant electrons on the surface in the latter case, as we find in our calculations.
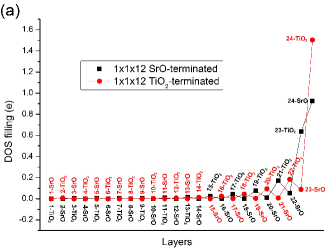
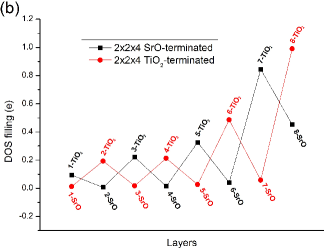
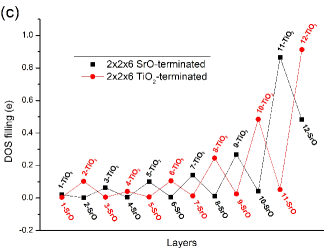
In the following we analyze the confinement of the electronic charge in the oxygen-deficient slabs. Figure 8 displays the layer-decomposed electron filling of the gap states close to the Fermi level for (), () and () slabs with both SrO and TiO2 termination as a funtion of depth. The layers are numbered from the bottom of the slab and the oxygen vacancy has been introduced on the top layer.
Analyzing Fig. 8 (a), we observe that the number of electrons doped into the system due to the oxygen defect decreases from the surface to the bottom of the slab, and there is a dramatic drop after two layers for SrO termination and after only one layer for TiO2 termination. This indicates that indeed a two-dimensional electron gas (2DEG) forms at the surface. The charge resulting from surface-localized oxygen vacancies forms a narrow distribution that is peaked at the surface and represents a narrow 2DEG in the 3D crystal. The charge distribution of Fig. 8 (a) agrees well with the approximate solution of the Poisson equation which was used in Ref. Meevasana-2011-nmat, to characterize the observed 2DEG. The number of electrons effectively drops to zero after ten layers (if we count TiO2 and SrO layers separately), which means that the system recovers its bulk properties within 5 unit cells below the surface. With the exception of the top layer in the SrO terminated slabs, excess electrons accumulate mostly on TiO2 layers. Nevertheless, the slab has an excessively large oxygen-defect density at the surface with respect to the reported experimental oxygen deficiency Santander-2011-nature . Even though the slab is thick enough to see the depth effect, the generated top layer has one oxygen vacany per one Sr atom (SrO surface termination) and per one TiO strip (TiO2 surface termination). This slab was considered here for comparison to the calculations performed in Ref. Santander-2011-nature, .
In Fig. 8 (b), we show the corresponding layer-decomposed electron filling of the gap states for a slab. A similar size slab has also been employed as a typical model in several previous works. Cai-2006-jcp ; Lin-2009-prb ; Luo-2004-prb ; Heifets-2001-prb We can see that the main features are similar to the slab case, but the bottom layer still shows some electron doping. This indicates that this slab is too thin to study the carriers in the system if the criterion that a part of the slab should show bulk STO carrier densities is considered. Fig. 8 (c) shows a similar plot for a slab but in this case bulk properties are recovered at the bottom of the slab.
For all considered slabs, the number of doping electrons in the gap states are close to 2.0 independent of the size of the slab and type of termination. Except for the extreme case of the slab, the second TiO2 layer in the SrO surface termination not only contributes maximally to the electron distribution but also accumulates a similar number of electrons as the 1st TiO2 layer on the TiO2 surface termination slabs, while the 2nd SrO layer in the TiO2 surface termination slabs has almost no doping electrons. This confirms that titanium oxide layers play a crucial role for the conductivity in these systems.
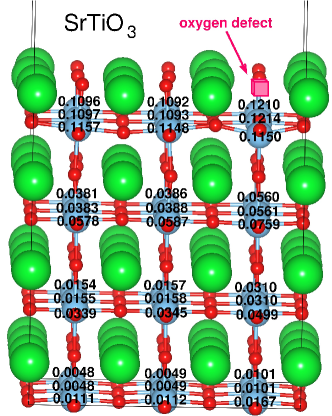
In Fig. 9 we show the Ti charge occupation for the SrO-terminated slab (). We observe that the Ti atoms directly below and diagonally adjacent to the O defect position carry a maximal excess charge of 0.12 electrons. The other Ti sites in this layer carry a rather similar excess charge of 0.11 electrons, making the electron doping in this layer almost homogeneous. The next TiO2 layer below shows excess charges between 0.04 and 0.08 electrons, the third TiO2 between 0.02 and 0.05 electrons. This charge distribution in the Ti shells indicates that a description of possible correlation effects – which is beyond the scope of the present work – would require the consideration of site dependent selfenergies.
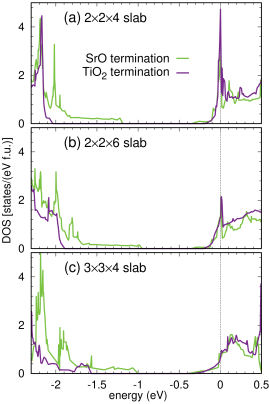
A strong instability towards ferromagnetism has been recently discussed Pavlenko-2012-arXiv in the context of oxygen-deficient titanate interfaces. The density of states (DOS) for our , , and slabs for both surface terminations (Fig. 10) shows a sharp peak at caused by the surface TiO2 layer (TiO2 termination) or the TiO2 layer below the SrO layer (SrO termination). This indicates – according to the Stoner criterion – a strong instability towards ferromagnetism also in the case of a surface 2DEG. Our data shows that by decreasing the doping level, i.e. increasing the slab size, the leading edge of the valence band shifts to higher energy, and the intensity of the sharp peak near the Fermi level decreases respectively.
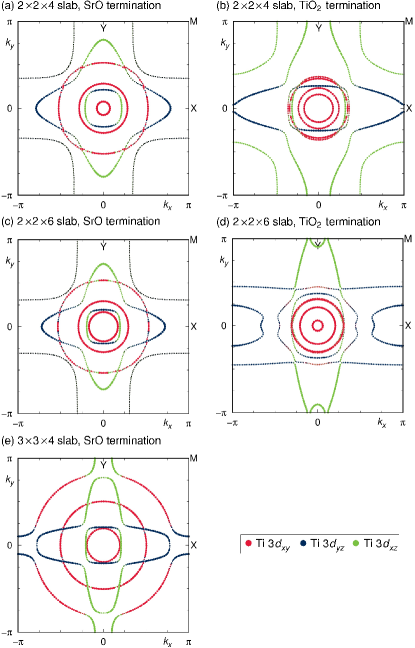
In Fig. 11 we present the calculated Fermi surface for the considered slabs with both SrO and TiO2 terminations. The figures show that the Ti states have strongly elliptical Fermi surfaces and high effective mass along compared to low effective mass along , and analogously for Ti with the properties along and exchanged. Meanwhile, Ti states have a circular Fermi surface and light effective mass along and . Note that in the calculations, an oxygen defect in the SrO surface layer preserves the rotational symmetry while a defect in the TiO2 surface layer breaks it; this is why Figs. 11 (b) and (d) are not the same after rotating by 90∘ and exchanging by . In reality, surface oxygen defects would be expected to be randomly distributed rather than forming a regular lattice as in the calculation. The circular Ti derived Fermi surfaces compare well to the ARPES measurements of Meevasana et al. Meevasana-2011-nmat and Santander-Syro et al. Santander-2011-nature . Santander-Syro et al. also extract signatures of the elliptical Ti Fermi surface pockets Santander-2011-nature as found in our calculations. The elliptical Fermi surface pockets have also been observed by Chang et al. Chang2010 in TiO2 terminated STO single crystals where oxygen vacancies were introduced by annealing in ultra high vaccuum.
Finally, we present in Table 1 the effective orbital-resolved electronic masses for the various slabs calculated from
| (1) |
where is the Planck constant and is the -resolved band energy. We find very good agreement with the experimental observations for the light effective masses () Santander-2011-nature ; Meevasana-2011-nmat . The heavy effective masses are more difficult to determine experimentally and are in the range Santander-2011-nature ; our values of are in reasonable agreement with Ref. Santander-2011-nature, and in very good agreement with the value measured in Ref. Chang2010, .
| (STO3-x) | 0.0833 | 0.0625 | 0.0417 | 0.0278 | |
|---|---|---|---|---|---|
| (, SrO) | 0.46 | 0.43 | 0.43 | 0.43 | |
| (, TiO2) | 0.42 | 0.40 | 0.47 | ||
| (, SrO) | 8.6 | 8.3 | 7.5 | 9.0 | |
| (, TiO2) | 7.9 | 9.3 | 8.7 |
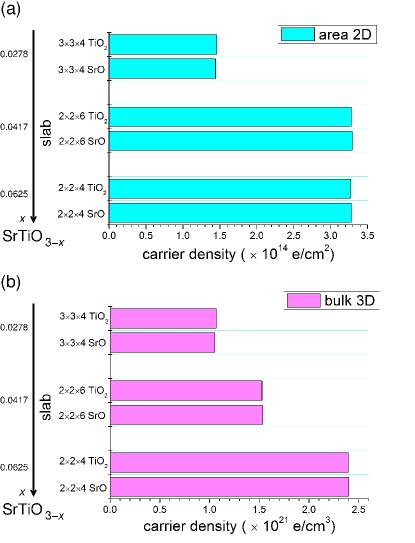
In Fig. 12 we compare the carrier density of our slabs in terms of number of carriers per unit cell area versus number of carriers per unit cell volume. Our two-dimensional carrier density compares well with the experimental data ( cm-2) Santander-2011-nature ; Meevasana-2011-nmat . We also observe that the number of carriers per area doesn’t scale with the oxygen vacancy concentration as it happens for the bulk electron doping . This result strongly indicates that the observed metallic state doesn’t correspond to bulk electron doping and the 2DEG on the surface is stable independent of oxygen-vacancy concentration and bulk doping density.
IV Summary
By employing density functional theory we have studied the electronic properties of various oxygen-deficient STO surface slabs SrTiO3-x for with special emphasis on the role of (i) slab structure relaxation, (ii) electron correlation at the mean-field level, (iii) surface termination and (iv) oxygen-vacancy concentration. We detect a significant surface reconstruction after including oxygen vacancies and we observe the formation of a metallic state only after introduction of oxygen vacancies. The charge carriers – independently of the oxygen concentration – are strongly localized at the surface and deplete rapidly within a few layers from the surface, which is an indication of the formation of a two-dimensional electron gas. Our calculated Fermi surfaces, effective masses and two-dimensional carrier densities show very good agreement with experiment.
The presented calculations show that the presence of oxygen vacancies is essential for the formation of a 2DEG at the surface of STO and set a basis for further detailed investigations on oxygen-deficient surfaces and interfaces beyond density functional theory.
V Acknowledgements
The authors would like to thank Ralph Claessen, Michael Sing and Thilo Kopp for useful discussions and gratefully acknowledge financial support by the Deutsche Forschungsgemeinschaft (DFG) through grant FOR 1346, the Beilstein-Institut, Frankfurt/Main, Germany, within the research collaboration NanoBiC as well as by the Alliance Program of the Helmholtz Association (HA216/EMMI). The generous allotment of computer time by CSC-Frankfurt and LOEWE-CSC is gratefully acknowledged.
Appendix A Additional electronic structure analysis
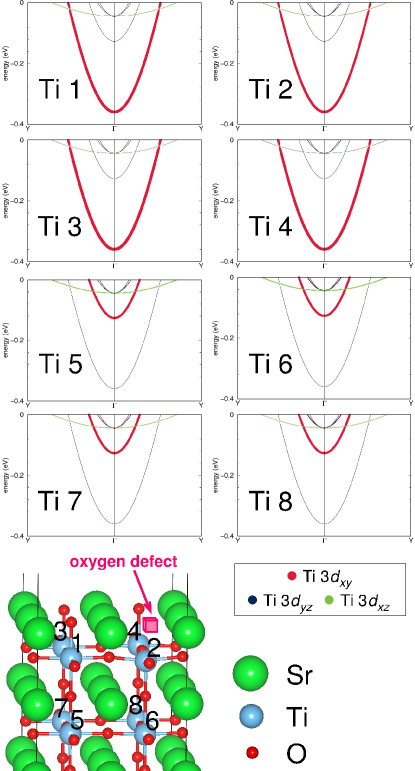
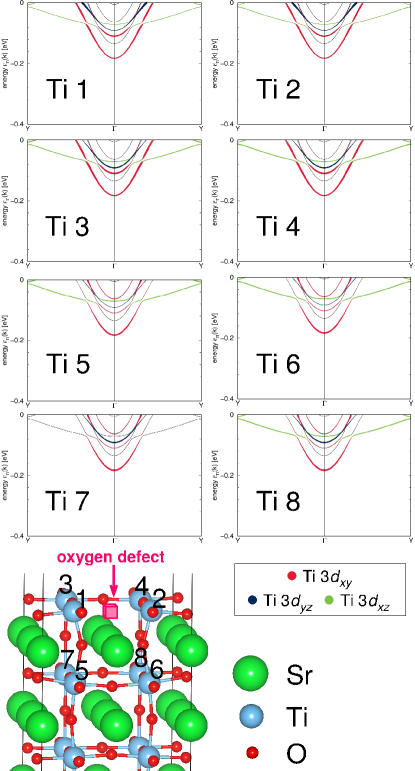
We have investigated the contribution to the band structure of the Ti atoms in the surface layers containing the oxygen vacancy. In Figures 13 and 14, we show this analysis for slabs with SrO and TiO2 termination, respectively. For the SrO terminated slab, the four Ti atoms closest to the surface (Ti 1-Ti 4) almost equally contribute to the lowest Ti band. In the second TiO2 layer, contributions from Ti 5-Ti 8 are again very similar, but this time they are responsible for the second lowest Ti band and to some extent contribute to the Ti and bands. For the TiO2 terminated slab (see Fig. 14), the fact that the defect breaks the rotational symmetry in the surface TiO2 layer is clearly visible: Ti 1 and Ti 2, which are adjacent to the oxygen defect, show similar contributions to the band structure; these contributions are different from Ti 3 and Ti 4, which didn’t lose a bond due to the formation of the defect. Overall, in the TiO2 termination case, the occupied bands are less easily assigned to subsequent TiO2 layers than in the case of SrO termination.
References
- (1) A. F. Santander-Syro, O. Copie, T. Kondo, F. Fortuna, S. Pailhès, R. Weht, X. G. Qiu, F. Bertran, A. Nicolaou, A. Taleb-Ibrahimi, P. Le Fèvre, G. Herranz, M. Bibes, N. Reyren, Y. Apertet, P. Lecoeur, A. Barthélémy, and M. J. Rozenberg, Nature (London) 469, 189 (2011).
- (2) A. Ohtomo and H. Y. Hwang, Nature (London) 427, 423 (2004).
- (3) J. N. Eckstein, Nat. Mater. 6, 473 (2007).
- (4) N. Reyren, S. Thiel, A. D. Caviglia, L. Fitting Kourkoutis, G. Hammerl, C. Richter, C. W. Schneider, T. Kopp, A.-S. Rüetschi, D. Jaccard, M. Gabay, D. A. Muller, J.-M. Triscone, and J. Mannhart, Science 317, 1196 (2007).
- (5) Z. S. Popović, S. Satpathy, and R. M. Martin, Phys. Rev. Lett. 101, 256801 (2008).
- (6) M. Basletic, J.-L. Maurice, C. Carrétéro, G. Herranz1, O. Copie, M. Bibes, É. Jacquet, K. Bouzehouane, S. Fusil, A. Barthélémy, Nat. Mater. 7, 621 (2008).
- (7) C. Cen, S. Thiel, J. Mannhart, and J. Levy, Science 323, 1026 (2009).
- (8) K. Janicka, J. P. Velev, and E. Y. Tsymbal, Phys. Rev. Lett. 102, 106803 (2009).
- (9) L. Li, C. Richter, S. Paetel, T. Kopp, J. Mannhart, and R. C. Ashoori, Science 332, 825 (2011).
- (10) R. Arras, V. G. Ruiz, W. E. Pickett, and R. Pentcheva, Phys. Rev. B 85, 125404 (2012).
- (11) Z. Zhong, P. Wissgott, K. Held, and G. Sangiovanni, Europhys. Lett. 99, 37011 (2012).
- (12) M. Huijben, G. Rijnders, D. H. A. Blank, S. Bals, S. van Aert, J. Verbeeck, G. van Tendeloo, A. Brinkman, and H. Hilgenkamp, Nat. Mater. 5, 556 (2006).
- (13) N. Nakagawa, H. Y. Hwang, and D. A. Muller, Nat. Mater. 5, 204 (2006).
- (14) S. Thiel, G. Hammerl, A. Schmehl, C. W. Schneider, and J. Mannhart, Science 313, 1942 (2006).
- (15) W. Meevasana, P. D. C. King, R. H. He, S-K. Mo, M. Hashimoto, A. Tamai, P. Songsiriritthigul, F. Baumberger, and Z-X. Shen, Nat. Mater. 10, 114 (2011).
- (16) N. Pavlenko, T. Kopp, E. Y. Tsymbal, J. Mannhart, G. A. Sawatzky, arXiv:1204.4711v1.
- (17) N. P. Guisinger, T. S. Santos, J. R. Guest, T-Y. Chien, A. Bhattacharya, J. W. Freeland, and M. Bode, ACS Nano 3, 4132 (2009).
- (18) K. Nassau and A. E. Miller, J. Cryst. Growth 91, 373 (1988).
- (19) G. Kresse and J. Hafner, Phys. Rev. B 47, 558 (1993).
- (20) G. Kresse and J. Furthmüller, Comput. Mater. Sci. 6, 15 (1996).
- (21) P. E. Blöchl, Phys. Rev. B 50, 17953 (1994).
- (22) G. Kresse and D. Joubert, Phys. Rev. B 59, 1758 (1999).
- (23) A. I. Liechtenstein, V. I. Anisimov, and J. Zaanen, Phys. Rev. B 52, R5467 (1995).
- (24) S. Okamoto, A. J. Millis, and N. A. Spaldin, Phys. Rev. Lett. 97, 056802 (2006).
- (25) K. Koepernik and H. Eschrig, Phys. Rev. B 59, 1743 (1999), http://www.FPLO.de.
- (26) J. P. Perdew, K. Burke, and M. Ernzerhof, Phys. Rev. Lett. 77, 3865 (1996).
- (27) R. A. Cowley, Phil. Trans. R. Soc. A 354, 2799 (1996).
- (28) see for instance K. Muthukumar, I. Opahle, J. Shen, H.O. Jeschke, and R. Valentí, Phys. Rev. B 84, 205442 (2011) for a detailed comparison of the electronic properties of bulk versus slab geometries in the context of SiO2.
- (29) Y. Aiura, I. Hase, H. Bando, T. Yasue, T. Saitoh, and D. S. Dessau, Surf. Sci. 515, 61 (2002).
- (30) M. Cai, Y. Zhang, G. Yang, Z. Yin, M. Zhang, W. Hu, and Y. Wang, J. Chem. Phys. 124, 174701 (2006).
- (31) F. Lin, S. Wang, F. Zheng, G. Zhou, J. Wu, B.-L. Gu, and W. Duan, Phys. Rev. B 79, 035311 (2009).
- (32) E. Heifets, R. I. Eglitis, E. A. Kotomin, J. Maier, and G. Borstel, Phys. Rev. B 64, 235417 (2001).
- (33) W. Luo, W. Duan, S. G. Louie, and M. L. Cohen, Phys. Rev. B 70, 214109 (2004).
- (34) Y. J. Chang, A. Bostwick, Y. S. Kim, K. Horn and E. Rotenberg, Phys. Rev. B 81, 235109 (2010).