Coexisting pseudo-gap and superconducting gap in the high- superconductor La2-xSrxCuO4
Abstract
Relationship between the superconducting gap and the pseudogap has been the subject of controversies. In order to clarify this issue, we have studied the superconducting gap and pseudogap of the high- superconductor La2-xSrxCuO4 (=0.10, 14) by angle-resolved photoemission spectroscopy (ARPES). Through the analysis of the ARPES spectra above and below , we have identified a superconducting coherence peak even in the anti-nodal region on top of the pseudogap of a larger energy scale. The superconducting peak energy nearly follows the pure -wave form. The -wave order parameter [defined by ] for =0.10 and 0.14 are nearly the same, 12-14 meV, leading to strong coupling . The present result indicates that the pseudogap and the superconducting gap are distinct phenomena and can be described by the “two-gap” scenario.
pacs:
74.25.Jb, 71.18.+y, 74.70.-b, 79.60.-iIn the studies of the high- cuprates, it has been a long-standing issue whether the pseudogap is related to the superconductivity or a phenomenon distinct from the superconductivity. Preformed Cooper pairs lacking phase coherence Emery and Kivelson (1998) or superconducting fluctuations Engelbrecht et al. (1998) have been proposed as a possible origin of the pseudogap. Alternatively, the pseudogap is attributed to a competing order such as spin density wave, charge density wave, loop current Simon and Varma (2002) etc. In measurements which are sensitive to the superconducting gap around the node such as Andreev reflection, penetration depth, and Raman scattering, the gap decreases with underdoping Deustcher (1999); Panagopoulos et al. (1998); Opel et al. (2000); Tacon et al. (2006) in contrast to the pseudo-gap which increases with underdoping, suggesting a different origin of the antinodal gap from the superconducting gap. Furthermore, recent ARPES studies have indicated the presence of two distinct energy scales as well as distinct momentum and temperature dependences of the gaps in the nodal and anti-nodal regions Tanaka et al. (2006); Lee et al. (2007); Kondo et al. (2007); Terashima et al. (2007); Hashimoto et al. (2007). In a previous paper Yoshida et al. (2009), we have pointed out that the pseudo-gap shows a relatively material-independent universal behavior: the pseudo-gap size is almost the same at the same doping level while the superconducting gap is proportional to , suggesting different origins for the superconducting gap and the pseudo-gap. On the other hand, a simple -wave-like gap has been also reported in some ARPES studies Meng et al. (2009); Shi et al. (2009). In such a single-gap picture, the pseudogap is interpreted as a signature of preformed Cooper pairs. Thus, the discrepancy between the experimental studies has remained.
In the analysis of the STM spectra of single-layer cuprate Bi2Sr2CuO6+δ (Bi2201), distinct behaviors of the superconducting gap and the pseudogap have been clearly demonstrated Boyer et al. (2007). Even if the superconducting peak is not clearly observed in underdoped samples, the superconducting coherence peak has been identified by dividing the spectra in the superconducting state by the normal-state data. Also, similar analysis has been done for the ARPES spectra of Bi2201 in the anti-nodal region and a superconducting peak has been identified Ma et al. (2008). These results suggest that the pseudogap and the superconducting gap have distinct origins and the superconducting gap is created on top of the electronic states with relatively broad spectral features with low density of states due to the pseudogap opening. As for the single-layer cuprates La2-xSrxCuO4 (LSCO), a clear superconducting peak has been identified in the off-nodal region, however, such a clear peak has not been identified in the anti-node region Terashima et al. (2007). In order to examine the coexistence of the superconducting gap and the pseudogap aforementioned, we have performed an ARPES study of LSCO (=0.14, 0.10) and analyzed the spectral line shapes to extract the signature of the superconducting peak.
High-quality single crystals of LSCO (=0.10, 0.14, 0.15) were grown by the traveling- solvent floating-zone method. The critical temperatures of ’s the = 0.10, 0.14, and 0.15 samples were 28, 32 and 39 K, respectively. The ARPES measurements were carried out using synchrotron radiation at beamline 5-4 of Stanford Synchrotron Radiation Light Source (SSRL) and also using a UV laser at the Institute of Solid State Physics (ISSP), the University of Tokyo. We used incident photons with energies of 22 eV at SSRL and 6.994 eV at ISSP. SCIENTA R4000 spectrometers were used in the angle mode. The total energy resolution was about 7 meV at SSRL and 2.8 meV at ISSP. The samples were cleaved in situ and measurements were performed at 11 K or 4 K () and 40 K ().
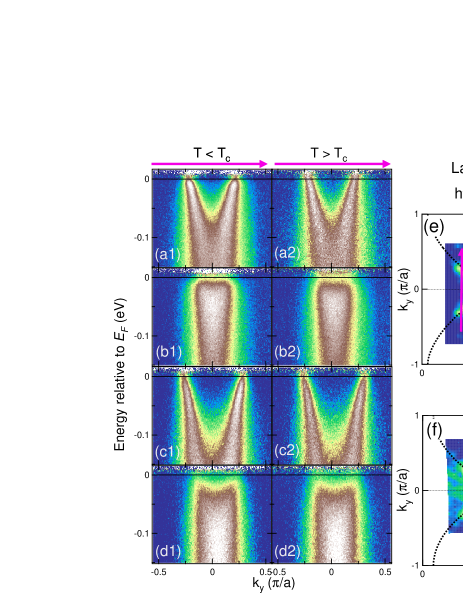
Figure 1 shows ARPES spectra of LSCO with =0.14 and 0.10 taken at = 11K () and = 40K (). The spectra have been divided by a convoluted Fermi-Dirac function. One can clearly see that the superconducting gap for the =0.14 sample in the off-nodal region opens below [panel (a1)] and closes above [panel (a2)]. The spectra for the =0.10 sample also shows a similar trend but the gap opens even above as shown in panel (c2), suggestive of a pseudogap opening. In the anti-node region, in contrast, spectral weight near is strongly suppressed even above [(b2) and (d2)], indicating a pseudogap behavior. The difference between the spectra below and above is not apparent. From these data, we derive the energy of the superconducting peak as described below.
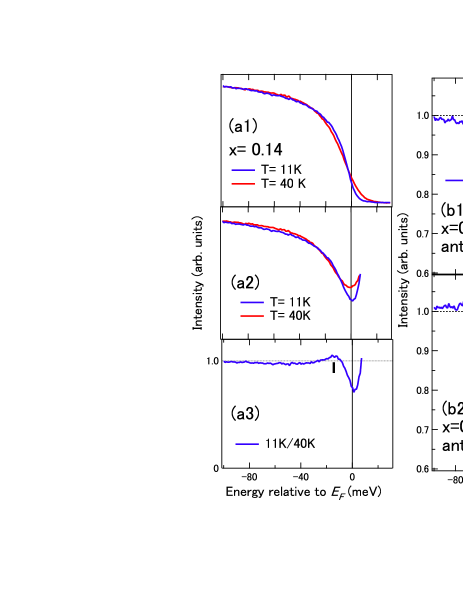
In order to identify fine structures associated with the superconducting transition, we have applied a similar analysis to that employed in the previous STM Boyer et al. (2007) and ARPES studies Ding et al. (2001) as described in Figs. 2 (a1) -(a3). First, integrated spectrum along cut b in Fig. 1[panel (a1)] is divided by Fermi-Dirac function convoluted by the energy resolution [panel (a2)]. Then, the spectrum below is divided by that above [panel (a3)]. As a result, we have obtained a peak-gap structure near even in the anti-nodal region where the pseudo-gap dominates the spectra, indicating superconducting peak and gap. In the same manner, the various cuts shown in Fig. 1 have been analyzed and the results are shown in Fig. 2 (b1)-(c2). Note that the obtained spectra is analogous to the tunneling spectra of -wave superconductors McMillan and Rowell (1965) because the superconducting order parameter is approximately constant around on a single cut.
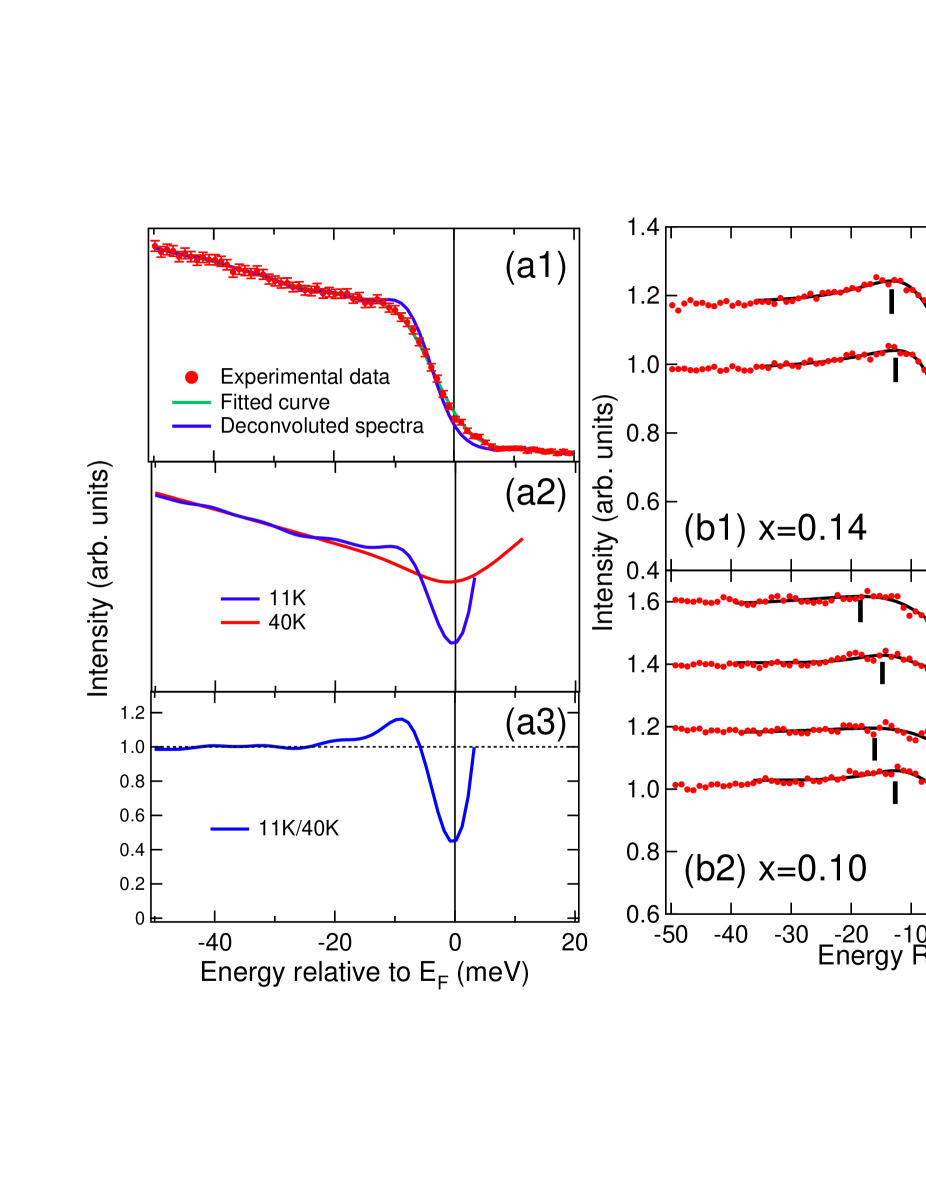
Strictly speaking, the division by a convoluted Fermi-Dirac function is an approximate method to determine the gap size and one cannot exclude spurious effect due to the finite energy resolution. In order to determine the superconducting gap energy more precisely, we performed deconvolution to remove the experimental energy resolution from the cut-integrated spectra using the maximum entropy method (MEM) [Fig. 3(a1)]. Then, the spectra were divided by the Fermi-Dirac function [Fig. 3(a2)]. Finally, the spectra below were divided by those above [Fig. 3(a3)]. In Fig. 3, we compare the processed spectra with [panels (b1) and (b2)] and without deconvolution [panels (c1) and (c2)]. Also, we have shown processed spectra (without deconvolution) for =0.15 near the node taken by the laser ARPES with a high resolution of meV [Fig. 3(d)]. The peak energies are plotted as a function of the -wave parameter in panel (e) and compared with the previous result of =0.15 which shows ”two-gap” behavior Yoshida et al. (2009). Note that the peak positions of the deconvoluted spectra are closer to by 5meV than those without deconvolution, nearly follows the pure -wave from the nodal to the anti-nodal regions Yoshida et al. (2009). Furthermore, the gap sizes in the off-nodal region for both the =0.14 and 0.10 samples are almost the same. The observed -wave-like gap in the anti-node region 12-14 meV gives a strong coupling ratio , similar to the previous Bi2201 result Ma et al. (2008).
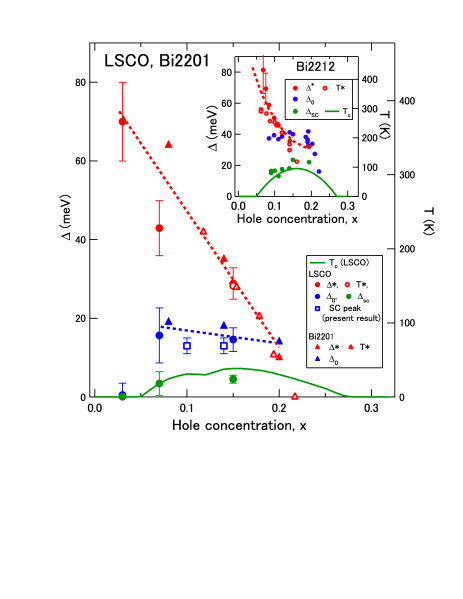
Here, we shall discuss differences in the ”two-gap” behavior between the single-layer and bi-layer cuprates. In the single-layer cuprates such as LSCO and Bi2201, the co-existence of the pseudogap and the superconducting peak in the anti-nodal direction has been revealed by the ARPES Ding et al. (2001) and STM studies Kurosawa et al. (2010) including the present result. However, in the case of Bi2212 Tanaka et al. (2006); Lee et al. (2007), such two energy scales have not been resolved in the anti-nodal spectra. Only a single-peak structure appears below in the optimally-doped and under-doped regions. The different behaviors between the single- and double-layer cuprates can be understood as follows: When the pseudogap has a different origin from the superconducting gap, the superconducting peak is created on the pseudogap feature of the broad incoherent spectral weight. In the single-layer cuprates, which have relatively low ’s, the energy scale of the superconducting gap is smaller than that of the pseudogap and the is lower than the pseudogap temperature in the optimally-doped and the underdoped region as shown in Fig.4(a). Therefore, the superconducting gap appears below within the pseudogap which is created below , resulting in the two energy scales in the spectral weight distribution. On the other hand, in the bi-layer cuprates Bi2212, which have a relatively high comparable to , both energy scales are comparable and and are also comparable in the optimally doped region [Fig.4(b)]. Because the pseudogap has a comparable energy scale with the superconducting gap and opens at nearly the same temperatures, the two gaps cannot be clearly resolved. Thus, the superconducting peak may show only a weak deviation from the pure -wave in Bi2212 Tanaka et al. (2006); Lee et al. (2007), unlike the strong deviation with two-energy scales in the single-layer cuprates Yoshida et al. (2009); Terashima et al. (2007); Kondo et al. (2007).
The present study has revealed that the superconducting gap has nearly pure -wave form and exists even in the anti-node direction in the optimally-doped to underdoped region. A phenomenological model for the two gap state proposed by Yang, Rice and Zhang (YRZ) well accords with the present coexistence of the superconducting and the pseudogap Yang et al. (2006). While YRZ assumes a RVB gap as the anti-nodal gap, there are several possible candidates for the origin of the pseudogap. Calculations assuming an order parameter different from the superconductivity such as valence bond glass Niestemski and Wang (2009) and spin-density wave (SDW) state Das et al. (2008) have predicted that the superconducting gap persists beyond the end of the Fermi arc all the way to the antinode. In accordance with the present observation. Particularly, in the SDW-based calculation Das et al. (2008), a hump-like pseudogap and a sharp superconducting peak in the anti-node direction as seen in the present result have been reproduced. A temperature dependent ARPES study reveals particle-hole asymmetry of the anti-node gap, most likely due to the density-wave gap formation Hashimoto et al. (2010). This observation would be related to the charge ordered state observed in STM Hanaguri et al. (2004) or stripe formation Tranquada et al. (1995). From a STM result of the charge order Kurosawa et al. (2010), the pseudogap in the anti-nodal region is most likely to link to such a two-dimensional electronic charge order.
In conclusion, we have identified the superconducting peak LSCO (=0.10, 0.14) in the anti-nodal region from analysis of the ARPES spectra above and below . The superconducting peaks follow the pure -wave on top of the pseudogap of a larger energy scalle. The -wave gap parameter of =0.10 and 0.14 are nearly the same. Since the superconducting order parameter is nearly doping independent in the underdoped region, the drop of with underdoping is due to the decreasing length of Fermi arc. The present results have reinforced that the pseudogap and the superconducting gap are distinct phenomena.
We are grateful to H. Ding for informative discussions. This work was supported by a Grant-in-Aid for Young Scientists (B)(22740221) and the Japan-China-Korea A3 Foresight Program from the Japan Society for the Promotion of Science. SSRL is operated by the Department of Energy’s Office of Basic Energy Science, Division of Chemical Sciences and Material Sciences.
References
- Emery and Kivelson (1998) J. V. Emery and S. A. Kivelson, Nature 374, 434 (1998).
- Engelbrecht et al. (1998) J. R. Engelbrecht, A. Nazarenko, M. Randeria, and E. Dagotto, Phys. Rev. B 57, 13406 (1998).
- Simon and Varma (2002) M. E. Simon and C. M. Varma, Phys. Rev. Lett. 89, 247003 (2002).
- Deustcher (1999) G. Deustcher, Nature 397, 410 (1999).
- Panagopoulos et al. (1998) C. Panagopoulos, J. R. Cooper, and T. Xiang, Phys. Rev. B 57, 13422 (1998).
- Opel et al. (2000) M. Opel, R. Nemetschek, C. Hoffmann, R. Philipp, P. F. Müller, R. Hackl, I. Tüttö, A. Erb, B. Revaz, E. Walker, H. Berger, and L. Forró, Phys. Rev. B 61, 9752 (2000).
- Tacon et al. (2006) M. L. Tacon, A. Sacuto, A. Georges, G. Kotliar, Y. Gallais, D. Colson, and A. Forget, Nature Physics 2, 537 (2006).
- Tanaka et al. (2006) K. Tanaka, W. S. Lee, D. H. Lu, A. Fujimori, T. Fujii, Risdiana, I. Terasaki, D. J. Scalapino, T. P. Devereaux, Z. Hussain, and Z.-X. Shen, Science 314, 1910 (2006).
- Lee et al. (2007) W. S. Lee, I. M. Vishik, K. Tanaka, D. H. Lu, T. Sasagawa, N. Nagaosa, T. P. Devereaux, Z. Hussain, and Z.-X. Shen, Nature 450, 81 (2007).
- Kondo et al. (2007) T. Kondo, T. Takeuchi, A. Kaminski, S. Tsuda, and S. Shin, Phys. Rev. Lett. 98, 267004 (2007).
- Terashima et al. (2007) K. Terashima, H. Matsui, T. Sato, T. Takahashi, M. Kofu, and K. Hirota, Phys. Rev. Lett. 99, 017003 (2007).
- Hashimoto et al. (2007) M. Hashimoto, T. Yoshida, K. Tanaka, A. Fujimori, M. Okusawa, S. Wakimoto, K. Yamada, T. Kakeshita, H. Eisaki, and S. Uchida, Phys. Rev. B 75, 140503(R) (2007).
- Yoshida et al. (2009) T. Yoshida, M. Hashimoto, S. Ideta, A. Fujimori, K. Tanaka, N. Mannella, Z. Hussain, Z.-X. Shen, M. Kubota, K. Ono, S. Komiya, Y. Ando, H. Eisaki, and S. Uchida, Phys. Rev. Lett. 103, 037004 (2009).
- Meng et al. (2009) J. Meng, W. Zhang, G. Liu, L. Zhao, H. Liu, X. Jia, W. Lu, X. Dong, G. Wang, H. Zhang, Y. Zhou, Y. Zhu, X. Wang, Z. Zhao, Z. Xu, C. Chen, and X. J. Zhou, Phys. Rev. B 79, 024514 (2009).
- Shi et al. (2009) M. Shi, A. Bendounan, E. Razzoli, S. Rosenkranz, M. R. Norman, J. C. Campuzano, J. Chang, M. Mansson, Y. Sassa, T. Claesson, O. Tjernberg, L. Patthey, N. Momono, M. Oda, M. Ido, S. Guerrero, C. Mudry, and J. Mesot, Europhys. Lett. 88, 27008 (2009).
- Boyer et al. (2007) M. C. Boyer, W. D. Wise, K. Chatterjee, M. Yi, T. Kondo, T. Takeuchi, H. Ikuta, and E. W. Hudson, Nature Physics 3, 802 (2007).
- Ma et al. (2008) J.-H. Ma, Z.-H. Pan, F. C. Niestemski, M. Neupane, Y.-M. Xu, P. Richard, K. Nakayama, T. Sato, T. Takahashi, H.-Q. Luo, L. Fang, H.-H. Wen, Z. Wang, H. Ding, and V. Madhavan, Phys. Rev. Lett. 101, 207002 (2008).
- Ding et al. (2001) H. Ding, J. R. Engelbrecht, Z. Wang, J. C. Campuzano, S.-C. Wang, H.-B. Yang, R. Rogan, T. Takahashi, K. Kadowaki, and D. G. Hinks, Phys. Rev. Lett. 87, 227001 (2001).
- McMillan and Rowell (1965) W. L. McMillan and J. M. Rowell, Phys. Rev. Lett. 14, 108 (1965).
- Ideta et al. (2012) S.-i. Ideta, T. Yoshida, A. Fujimori, H. Anzai, T. Fujita, A. Ino, M. Arita, H. Namatame, M. Taniguchi, Z.-X. Shen, K. Takashima, K. Kojima, and S.-i. Uchida, Phys. Rev. B 85, 104515 (2012).
- Yoshida et al. (2012) T. Yoshida, M. Hashimoto, I. M. Vishik, Z.-X. Shen, and A. Fujimori, Journal of the Physical Society of Japan 81, 011006 (2012).
- Kurosawa et al. (2010) T. Kurosawa, T. Yoneyama, Y. Takano, M. Hagiwara, R. Inoue, N. Hagiwara, K. Kurusu, K. Takeyama, N. Momono, M. Oda, and M. Ido, Phys. Rev. B 81, 094519 (2010).
- Yang et al. (2006) K.-Y. Yang, T. M. Rice, and F.-C. Zhang, Phys. Rev. B 73, 174501 (2006).
- Niestemski and Wang (2009) L. R. Niestemski and Z. Wang, Phys. Rev. Lett. 102, 107001 (2009).
- Das et al. (2008) T. Das, R. S. Markiewicz, and A. Bansil, Phys. Rev. B 77, 134516 (2008).
- Hashimoto et al. (2010) M. Hashimoto, R.-H. He, K. Tanaka, J.-P. Testaud, W. Meevasana, R. G. Moore, D. Lu, H. Yao, Y. Yoshida, H. Eisaki, T. P. Devereaux, Z. Hussain, and Z.-X. Shen, Nature Physics 6, 414 (2010).
- Hanaguri et al. (2004) T. Hanaguri, C. Lupien, Y. Kohsaka, D.-H. Lee, M. Azuma, M. Takano, H. Takagi, and J. C. Davis, Nature 430, 1001 (2004).
- Tranquada et al. (1995) J. M. Tranquada, B. J. Sternlieb, J. D. Axe, Y. Nakamura, and S. Uchida, Nature 375, 561 (1995).