Lyman dominance of the Classical T Tauri FUV Radiation Field
Abstract
Far-ultraviolet (FUV) radiation plays an important role in determining chemical abundances in protoplanetary disks. H I Lyman is suspected to be the dominant component of the FUV emission from Classical T Tauri Stars (CTTSs), but is difficult to measure directly due to circumstellar and interstellar H I absorption. To better characterize the intrinsic Lyman radiation, we present FUV spectra of 14 CTTSs taken with the Hubble Space Telescope COS and STIS instruments. H2 fluorescence, commonly seen in the spectra of CTTSs, is excited by Lyman photons, providing an indirect measure of the Lyman flux incident upon the warm disk surface. We use observed H2 progression fluxes to reconstruct the CTTS Lyman profiles. The Lyman flux correlates with total measured FUV flux, in agreement with an accretion-related source of FUV emission. With a geometry-independent analysis, we confirm that in accreting T Tauri systems Lyman radiation dominates the FUV flux (1150 Å - 1700 Å). In the systems surveyed this one line comprises 70 - 90 % of the total FUV flux.
Subject headings:
stars: pre-main sequence1. Introduction
One of the most influential factors in determining the local composition and physical state of the gas in protoplanetary disks is the ultraviolet (UV) radiation field. Strong UV radiation is produced from hot gas in the magnetically active atmospheres of the central star, and at the magnetospheric shock where disk material collides with the stellar atmosphere (Günther & Schmitt, 2008; Sacco et al., 2008). UV photons have a profound influence on the gas heating (Jonkheid et al., 2004; Nomura et al., 2007; Woitke et al., 2009) and disk gas chemistry (Aikawa & Herbst, 1999; Bethell & Bergin, 2009; Fogel et al., 2011). Surveys of the UV radiation field have been able to characterize the general spectral structure of the radiation (Valenti et al., 2000; Yang et al., 2012). H I Lyman (Ly) is a significant contributor to the UV radiation, comprising as much as 80% of the far-UV (FUV) emission produced in the stellar atmosphere and accretion shock (Bergin et al., 2003; Herczeg et al., 2004). While the Ly radiation is intense close to the star, atomic hydrogen in the disk atmosphere at larger radii isotropically scatters Ly photons which provides greater penetration into the molecular disk. This is quite different from UV photons at other wavelengths that are scattered solely by dust grains, leading to a Ly dominated radiation field - if Ly radiation is present (Herczeg, 2005; Bethell & Bergin, 2011). This is important because Ly dissociates many molecules such as H2O and CH4, and can lead to an overabundance of certain species, especially CN (Bergin et al., 2003; van Zadelhoff et al., 2003; van Dishoeck et al., 2006).
While many strong UV transitions such as C IV and He II have been studied (Ingleby et al., 2011; Yang et al., 2012), an intrinsic Ly profile has only been well characterized in a single Classical T Tauri Star (CTTS) - TW Hya (Herczeg et al., 2004). Due to circumstellar and interstellar H I absorption, it is impossible to directly measure the intrinsic Ly emission of most CTTSs. On the other hand, H2 emission resulting from Ly photoexcitation is prevalent throughout the FUV bandpass, providing an indirect probe of the Ly. Several Lyman and Werner band transitions reside at wavelengths coincident with the Ly profile, and have a relatively simple radiative transfer. These lines have been identified in previous observations of CTTSs (Brown et al., 1981; Valenti et al., 2000; Ardila et al., 2002; Herczeg et al., 2002, 2006; France et al., 2011a). H2 emission therefore provides an opportunity to study the circumstellar region where the Ly radiation interacts with the disk molecular gas, as well as characterize the strength of this key component of the FUV radiation field in T Tauri systems.
The impact of strong Ly radiation on disks has only recently been explored in detailed UV radiation transfer models (Bethell & Bergin, 2011) and chemical models (Fogel et al., 2011). Given the influence of these photons on gas throughout the disk, quantifying the Ly emission in CTTSs is crucial to produce accurate disk thermal/chemistry models. In this letter, we reconstruct the Ly profile from observed H2 emission lines in the FUV spectra of CTTSs.
2. Observations
Our sample includes 14 CTTSs, chosen for their strong H2 and FUV continuum emission. The targets, as well as their distances and extinctions, are listed in Table 1. We adopt target and line-of-sight parameters from France et al. (2012). Most observations utilized the G130M and G160M medium resolution (17 km s-1) modes of COS (Green et al., 2012). We also use archival STIS E140M observations of TW Hya from the StarCAT spectral catalog (Ayres, 2010) to compare our results with previous analysis (Herczeg et al., 2004).
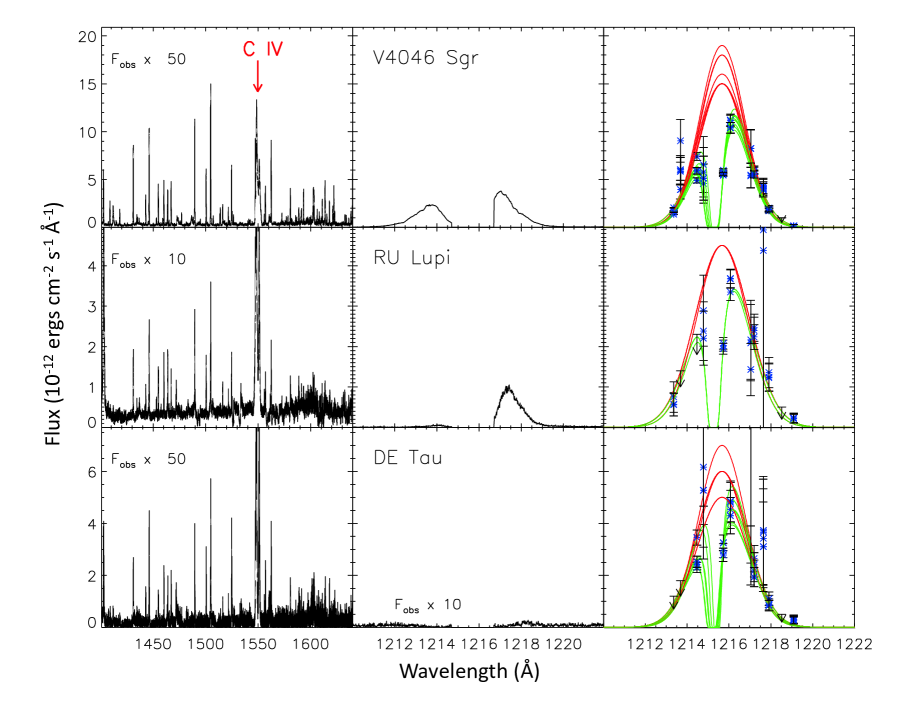
This sample includes targets from the Taurus-Auriga, Chamaeleontis, and TW Hya star-forming regions, in addition to isolated systems. They are a subset of a full CTTS H2 survey presented in more detail in France et al. (2012). All the CTTSs in our sample display Ly-excited H2 emission lines throughout the COS bandpass with an average line width of 46 14 km s-1. Circumstellar and interstellar H I absorbs the Ly profiles to varying degrees in each target. Figure 1 shows the observed H2 emission and Ly profiles of several targets. An H I component absorbs the Ly line core in V4046 Sgr, while an outflow absorber attenuates most of the short wavelength side of the Ly profile of RU Lupi. Very little Ly emission is observed in the DE Tau spectra. However, each target shows abundant Ly excited H2 emission lines (France et al., 2012), demonstrating that the observed Ly profile can vastly underrepresent the local Ly radiation field at the disk surface.
| Target | d | FWHM | d | |||||
|---|---|---|---|---|---|---|---|---|
| (pc) | (km s-1)c | (1019 cm-2)c | (km s-1)c | |||||
| AA Tau | 0.5 | 140 | 35.2 6.3 | 16.5 2.4 | 642 33 | 1.11 0.31 | -143 16 | 3.5 |
| BP Tau | 0.5 | 140 | 31.5 5.5 | 20.7 3.0 | 613 54 | 0.44 0.30 | -131 29 | 14.1 |
| DE Tau | 0.6 | 140 | 15.4 4.5 | 7.91 2.8 | 623 75 | 0.92 0.53 | -156 28 | 3.6 |
| DM Tau | 0.0 | 140 | 4.6 0.5 | 3.19 0.4 | 912 35 | 0.39 0.03 | -89 4 | 1.1 |
| GM Aur | 0.1 | 140 | 12.2 3.0 | 6.19 1.5 | 815 31 | 1.16 0.32 | -129 17 | 2.9 |
| HN Tau | 0.5 | 140 | 12.9 2.6 | 7.08 1.4 | 776 40 | 1.15 0.49 | -153 26 | 2.8 |
| LkCa 15 | 0.6 | 140 | 17.2 2.8 | 9.54 2.0 | 665 39 | 0.80 0.40 | -139 25 | 3.0 |
| RECX 11 | 0.0 | 97 | 5.2 0.4 | 3.07 0.6 | 573 63 | 0.78 0.48 | -126 35 | 0.8 |
| RECX 15 | 0.0 | 97 | 11.6 1.6 | 5.73 1.0 | 848 54 | 0.96 0.38 | -125 27 | 1.0 |
| RU Lupi | 0.1 | 150 | 23.4 5.5 | 10.3 1.7 | 707 59 | 3.14 1.56 | -219 52 | 7.5 |
| SU Aur | 0.9 | 140 | 35.4 8.2 | 14.8 1.9 | 644 59 | 2.34 1.37 | -177 47 | 6.9 |
| TW Hya | 0.0 | 56 | 52.5 9.1 | 38.3 6.6 | 865 35 | 0.29 0.12 | -77 16 | 41.4 |
| UX Tau | 0.2 | 140 | 6.2 0.5 | 4.32 0.4 | 606 42 | 0.18 0.04 | -64 7 | 1.1 |
| V4046 Sgr | 0.0 | 83 | 46.0 5.1 | 24.9 2.2 | 627 38 | 0.65 0.26 | -108 17 | 7.0 |
Fluxes in 10-12 ergs cm-2 s-1
a Intrinsic, unabsorbed model flux
b H2-incident, circumstellar H I-absorbed model flux
c Average parameters of intrinsic model Ly profiles
d Integrated 1160 - 1695 Å flux, excluding Ly (1207 - 1222 Å) and O I (1300 - 1310 Å).
3. Analysis
Wood et al. (2002) and Herczeg et al. (2004) developed a method of Ly reconstruction using photo-excited H2 emission lines in the UV spectra of Mira B and TW Hya. The line fluxes were used in fluorescence models to determine the intrinsic Ly profiles and H2 properties of each object. To make an analysis of a larger sample tractable, we employ a similar technique with only the brightest H2 progressions. A progression refers to the cascade of electronic transitions originating from an individual rotational-vibrational level of the excited electronic state. Similar to the previous studies, we first measure the H2 lines, and then model the Ly profiles.
3.1. H2 Emission Spectra and the Absorbed Ly Flux
We employed a multi-Gaussian IDL line-fitting code, optimized for COS emission line spectra, to measure the total flux from Ly-pumped H2. This code assumes a Gaussian line-shape convolved with a wavelength dependent line spread function (LSF), then uses the MPFIT routine to minimize between the fit and data (Markwardt, 2009). An unconvolved Gaussian was used for TW Hya observed with STIS. To reconstruct the local Ly profile incident upon the molecular disk surface, we measured the total flux from 12 fluorescent progressions excited by Ly. We chose to restrict the emission line analysis to the 1395 – 1640 Å range to mitigate the effects of H2 self-absorption, which are strongest at 1400 Å (Herczeg et al., 2004). The brightest, unblended lines from 12 progressions in the 1395 – 1640 Å bandpass (up to 38 lines) were fitted. We refer the reader to France et al. (2012) for additional information on the H2 emission characteristics of our sample, including progression IDs for all lines measured.
The total flux from progression is given by
| (1) |
where is the reddening corrected, integrated H2 emission line flux (in units of ergs cm-2 s-1) from rovibrational state (= [,]) in the electronic state to (= [,]) in the ground electronic state, . is the branching ratio for each transition in a progression, defined as the ratio of the Einstein -value for a given transition () to the total transition rate out of state , including transitions to bound states and the vibrational continuum (Stecher & Williams, 1967; Wood & Karovska, 2004; France et al., 2011b). is the number of emission lines measured from a given progression.
We take the error to be the standard deviation of the individual measurements of (H2), as this is the relative uncertainty in H2 fluxes in most cases. These standard deviations are typically less than 10% for bright progressions, and as high as 20 - 30% in weaker progressions. The primary uncertainty in H2 luminosities relates to the extinction correction (see in Table 1), although to zeroeth order this would affect all progressions similarly as they have been chosen from a narrow range of wavelengths. Upper limits on the H2 emission line fluxes of undetectable progressions were determined from the standard deviation in a 50 km s-1 region surrounding the laboratory wavelength of the transition.
The flux incident on the H2 (, in units of ergs cm-2 s-1 Å-1) at each H2 absorbing transition wavelength was then assumed to be the total progression flux divided by the equivalent width () of the absorbing H2 transition:
| (2) |
| (3) |
where each [,] state of the ground electronic level is populated by a single rotational temperature () and column density (). Non-thermal populations can result from dust heating and photo excitation by the strong X-ray and UV radiation fields (Nomura et al., 2007; Gorti & Hollenbach, 2009). However, a degeneracy exists between and in our model, discussed further in Section 3.2. As a first order approximation to simplify this degeneracy we assume a thermal population. To determine , we used a grid of in 100 K increments from 1000 K to 5000 K, and in 0.1 dex increments from 1016 to 1022 cm-2. Models with 1000 K produce a negligible population in the =2 level of the ground electronic state and are therefore not considered. For each of the 12 transitions, we calculated a set of for each pair of and . Each pair of and therefore creates 12 unique values of .
3.2. Ly Profile Reconstruction
Our reconstruction technique finds the set of outflow-absorbed Ly profiles (, in units of ergs cm-2 s-1 Å-1) that best fit the variety of values. The model assumes Ly emission is created near the stellar surface. Some amount of H I lies in between the Ly source and the H2, absorbing some of the Ly photons before they reach the H2. For each target, we create a grid of profiles, each with its own single Gaussian emission component and single outflow H I absorber:
| (4) |
is the average continuum flux per Angstrom near Ly. is the accretion/magnetospheric-generated Gaussian emission profile, centered at the stellar radial velocity and parameterized by amplitude and FWHM (in units of ergs cm-2 s-1 Å-1 and km s-1, respectively). The optical depth is determined with a Voigt profile for the H I Ly transition, characterized by an outflow velocity and column density (in units of km s-1 and cm-2, respectively). This outflow absorption component is essential to adequately fitting the values.
For each model profile, a is calculated with each set of [,]-dependent . We then exclude any sets of and which yield a greater than 95.4% (2) from the peak of the probability distribution. The H2 progressions for which only upper limits are calculated provide additional constraints on the Ly profile; we reject any Ly profile with a flux greater than an upper limit value at that wavelength. Given the various combinations of , FWHM, , , , and , a variety of Ly profiles adequately fit the values. This is demonstrated in Figure 1, where several combinations of , , and are shown. We quantify the overall distribution of profiles for each target by integrating each profile from 1210 Å to 1222 Å, resulting in fluxes (in units of ergs cm-2 s-1) which form an approximately Gaussian distribution.
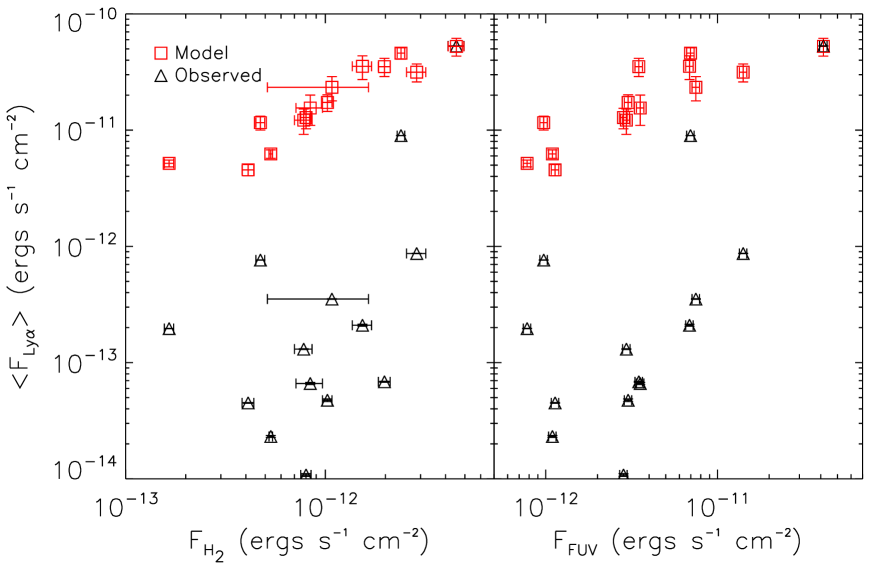
The average () of each target is listed in Table 1, along with the 1 width of the distribution. represents the total Ly flux at the star, and is generally constrained to within 10 - 20 %. We also include the average emission FWHM and H I absorber properties ( and . Integrating , the H2-incident Ly flux, yields . Assuming a thermally populated ground state distribution, typical values are 2500 1000 K and log((cm-2)) 19 1, similar to those found in TW Hya (Herczeg et al., 2004). Strong UV and X-ray irradiation from the central star would act to preferentially populate excited rovibrational levels in excess of the thermal distribution (see e.g., Nomura et al. (2007)). In our simple model, non-thermal excitation would be approximated by higher rotational temperatures, and this increase in rovibrational population will be offset by lower total H2 column densities. The varying effects of non-thermal excitation most likely contribute to the spread of the observed and values. Lower can require increased Ly flux, although we expect that this increase will be of the same order of the uncertainty on the derived Ly emission flux ( 10 – 20 %). Untangling the effects of non-thermal populations requires more complex modeling, including the effects of H2 formation on dust grains, and disk modeling efforts that predict the UV fluorescent spectrum of H2 (and CO) would be very valuable. Regardless, the overall model Ly properties follow approximately gaussian distributions. Figure 2 compares and the observed Ly fluxes (, summed over the entire profile) with the total H2 fluxes. has a Spearman rank correlation coefficient of 0.57 while , by design, has a of 0.96.
Ideally we would compare our model Ly profiles with the observed Ly profiles. However, this involves additional parameters and a more complex analysis than presented here. Primarily, the radiative transfer of Ly photons between the source, the H2, and Earth must account for the geometric filling fraction . This fraction represents the solid angle of H2 illuminated by the Ly emission, such that =1 implies the H2 completely surrounds the star. An other than 1 would enter Equation 2 by multiplying by . Herczeg et al. (2004) found =0.25 for TW Hya, implying gas in a disk surface layer. However, Wood et al. (2002) measured 2 in Mira B. A filling factor greater than 1 would possibly correspond to preferential scattering of H2 photons into, or more likely Ly photons out of, our line of sight (Wood et al., 2002). Future analysis will incorporate into a more detailed radiative transfer model of our sample targets.
3.3. Total Ly Flux in CTTSs
We determine the fraction of the total FUV output from CTTSs that is in the Ly emission line, adopting a definition of the Ly fraction, , given by
| (5) |
where is our average model Ly flux from the star (in units of ergs cm-2 s-1; §3.2) and is the total unreddened FUV flux, measured over the 1160 – 1695 Å bandpass (in units of ergs cm-2 s-1). The wings of the stellar Ly can extend to 1000 km s-1 from line center in some targets (see e.g, Figure 2 () from Yang et al. 2011), therefore we excluded the 1207 – 1225 Å region from the computation of . We also excluded the 1300 – 1310 Å region to remove contamination by the geocoronal O I multiplet. A 5% error is assumed on corresponding to the uncertainty in flux calibration. The restriction of the total FUV band to 1160 – 1695 Å is mainly driven by the the lack of supporting observations at short wavelengths (912 – 1160 Å) for all targets and the end of the STIS E140M bandpass at 1700 Å.
Molecular line emission from H2 (Herczeg et al. 2006; this work) and CO (France et al., 2011a; Schindhelm et al., 2012) contributes to . The FUV molecular emission is thought to originate from an inner warm disk surface ( 3 AU) (Herczeg et al., 2004; France et al., 2012) or outflow (Saucedo et al., 2003; Walter et al., 2003). The total FUV flux also includes a molecular continuum whose excitation mechanism and spatial distribution are not well constrained (Bergin et al., 2004; France et al., 2011b). shows a much better correlation with than (Figure 2). This is consistent with the idea that both the Ly and FUV continuum emission are produced by related processes.
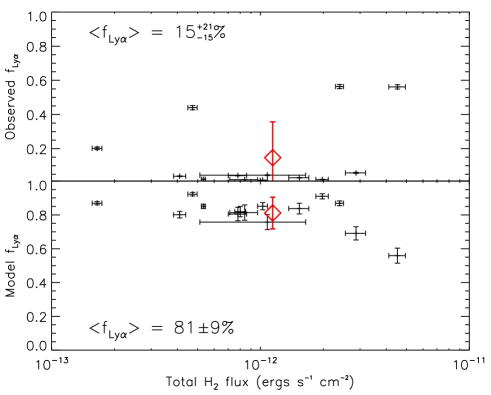
We also calculate an observed Ly fraction () using instead of in Equation 5. We compare and with the total H2 flux in Figure 3. For our general assumption of =1, we find an average of 819%, compared with 15% for . For = 0.1, 0.25, 0.5, and 2.0, is 97%, 94%, 90%, and 69%, respectively. A slight trend for decreasing with increasing is apparent, although this may be inappropriately weighted by BP Tau and TW Hya. Regardless, our calculated values demonstrate the validity of previous assertions that Ly emission dominates the FUV radiation field from CTTSs (e.g. Bergin et al. (2003)).
4. Discussion and Conclusions
We have demonstrated that Ly dominates the FUV emission of CTTSs. Ly-fluoresced H2 emission lines appear throughout the spectra of each CTTS in our survey. Circumstellar and interstellar H I partially attenuates the line centers of the Ly profiles in most targets and completely absorbs them in several targets. The Ly fluxes do not correlate with either the total H2 emission or the summed FUV continuum flux. The strongest fluorescent H2 progressions are used to reconstruct the Ly profile incident on the molecular disk, yielding values accurate to within % in most targets. This uncertainty is caused by the distribution of possible H I and H2 properties. Our model assumptions (such as a single Gaussian emission component or simple outflow absorber) may hide larger systematic errors, however future work will study these effects in a more detailed model. We find that the intrinsic Ly comprises 81% of the total FUV emission from CTTSs, compared with a fraction of only 15% for the observed Ly profiles. This demonstrates the need for Ly reconstruction to achieve accurate disk models of CTTSs.
It is clear from our results that the detection of the strong Ly line in TW Hya was not limited to a single object. Rather, strong Ly emission dominates the FUV flux from all accreting (classical) T Tauri stars. Our measurements of the relative Ly/FUV continuum flux only compare Ly to the FUV flux from 1160 - 1695 Å. Thus if there is significant UV flux shortward of 1160 Å then the strength of Ly relative to the FUV radiation could go down. However, in TW Hya the flux below this limit is only 5% of the FUV flux below 1700 Å. Similarly, France et al. (2011b) have shown that the FUV continuum decreases to shorter wavelengths across the FUV bandpass. In addition, the absorption properties of grains strongly limit the propagation of UV photons near the Lyman limit.
The derived Ly fractions confirm the dominance of Ly in the FUV spectrum of the accreting young stars with disks. This is important because Ly photons from the star will see the atomic hydrogen layer, with shallow angle of incidence, above the molecular surface. Isotropic scattering will lead a significant fraction of the Ly flux to rain down on the disk with greater penetrating power than typical UV continuum photons (Bethell & Bergin, 2011). In addition, the Ly emission reprocessed by H2 (which is scattered throughout the FUV spectrum) will also emit directly on the disk surface (France et al., 2012). These two effects increase the penetration of UV photons beyond the simple case where one assumes the UV photons observe the disk surface with shallow angle of incidence and with the propagation solely influenced by grains. In general this should lead to greater heating and additional chemical effects deeper in the disk system.
ES and KF thank Brian Wood for input on Ly profile reconstruction. This work was supported by NASA grants NNX08AC146 and NAS5-98043 to the University of Colorado at Boulder ( programs 11533 and 12036) and made use of data from GO programs 8041 and 11616.
References
- Aikawa & Herbst (1999) Aikawa, Y. & Herbst, E. 1999, A&A, 351, 233
- Ardila et al. (2002) Ardila, D. R., Basri, G., Walter, F. M., Valenti, J. A., & Johns-Krull, C. M. 2002, ApJ, 566, 1100
- Ayres (2010) Ayres, T. R. 2010, ApJS, 187, 149
- Bergin et al. (2003) Bergin, E., Calvet, N., D’Alessio, P., & Herczeg, G. J. 2003, ApJ, 591, L159
- Bergin et al. (2004) Bergin, E., Calvet, N., Sitko, M. L., Abgrall, H., D’Alessio, P., Herczeg, G. J., Roueff, E., Qi, C., Lynch, D. K., Russell, R. W., Brafford, S. M., & Perry, R. B. 2004, ApJ, 614, L133
- Bethell & Bergin (2009) Bethell, T. & Bergin, E. 2009, Science, 326, 1675
- Bethell & Bergin (2011) Bethell, T. J. & Bergin, E. A. 2011, ApJ, 739, 78
- Brown et al. (1981) Brown, A., Jordan, C., Millar, T. J., Gondhalekar, P., & Wilson, R. 1981, Nature, 290, 34
- Fogel et al. (2011) Fogel, J. K. J., Bethell, T. J., Bergin, E. A., Calvet, N., & Semenov, D. 2011, ApJ, 726, 29
- France et al. (2011a) France, K., Schindhelm, E., Burgh, E. B., Herczeg, G. J., Harper, G. M., Brown, A., Green, J. C., Linsky, J. L., Yang, H., Abgrall, H., Ardila, D. R., Bergin, E., Bethell, T., Brown, J. M., Calvet, N., Espaillat, C., Gregory, S. G., Hillenbrand, L. A., Hussain, G., Ingleby, L., Johns-Krull, C. M., Roueff, E., Valenti, J. A., & Walter, F. M. 2011a, ApJ, 734, 31
- France et al. (2012) France, K., Schindhelm, E., Herczeg, G. J., Brown, A., Abgrall, H., Alexander, R. D., Bergin, E. A., Brown, J. M., Linsky, J. L., Roueff, E., & Yang, H. 2012, ArXiv e-prints
- France et al. (2011b) France, K., Yang, H., & Linsky, J. L. 2011b, ApJ, 729, 7
- Gorti & Hollenbach (2009) Gorti, U. & Hollenbach, D. 2009, ApJ, 690, 1539
- Green et al. (2012) Green, J. C., Froning, C. S., Osterman, S., Ebbets, D., Heap, S. H., Leitherer, C., Linsky, J. L., Savage, B. D., Sembach, K., Shull, J. M., Siegmund, O. H. W., Snow, T. P., Spencer, J., Stern, S. A., Stocke, J., Welsh, B., Béland, S., Burgh, E. B., Danforth, C., France, K., Keeney, B., McPhate, J., Penton, S. V., Andrews, J., Brownsberger, K., Morse, J., & Wilkinson, E. 2012, ApJ, 744, 60
- Günther & Schmitt (2008) Günther, H. M. & Schmitt, J. H. M. M. 2008, A&A, 481, 735
- Herczeg (2005) Herczeg, G. J. 2005, PhD thesis, University of Colorado at Boulder, Colorado, USA
- Herczeg et al. (2002) Herczeg, G. J., Linsky, J. L., Valenti, J. A., Johns-Krull, C. M., & Wood, B. E. 2002, ApJ, 572, 310
- Herczeg et al. (2006) Herczeg, G. J., Linsky, J. L., Walter, F. M., Gahm, G. F., & Johns-Krull, C. M. 2006, ApJS, 165, 256
- Herczeg et al. (2004) Herczeg, G. J., Wood, B. E., Linsky, J. L., Valenti, J. A., & Johns-Krull, C. M. 2004, ApJ, 607, 369
- Ingleby et al. (2011) Ingleby, L., Calvet, N., Hernández, J., Briceño, C., Espaillat, C., Miller, J., Bergin, E., & Hartmann, L. 2011, AJ, 141, 127
- Jonkheid et al. (2004) Jonkheid, B., Faas, F. G. A., van Zadelhoff, G.-J., & van Dishoeck, E. F. 2004, A&A, 428, 511
- Markwardt (2009) Markwardt, C. B. 2009, in Astronomical Society of the Pacific Conference Series, Vol. 411, Astronomical Data Analysis Software and Systems XVIII, ed. D. A. Bohlender, D. Durand, & P. Dowler, 251
- Nomura et al. (2007) Nomura, H., Aikawa, Y., Tsujimoto, M., Nakagawa, Y., & Millar, T. J. 2007, ApJ, 661, 334
- Sacco et al. (2008) Sacco, G. G., Argiroffi, C., Orlando, S., Maggio, A., Peres, G., & Reale, F. 2008, A&A, 491, L17
- Saucedo et al. (2003) Saucedo, J., Calvet, N., Hartmann, L., & Raymond, J. 2003, ApJ, 591, 275
- Schindhelm et al. (2012) Schindhelm, E., France, K., Burgh, E. B., Herczeg, G. J., Green, J. C., Brown, A., Brown, J. M., & Valenti, J. A. 2012, ApJ, 746, 97
- Stecher & Williams (1967) Stecher, T. P. & Williams, D. A. 1967, ApJ, 149, L29+
- Valenti et al. (2000) Valenti, J. A., Johns-Krull, C. M., & Linsky, J. L. 2000, ApJS, 129, 399
- van Dishoeck et al. (2006) van Dishoeck, E. F., Jonkheid, B., & van Hemert, M. C. 2006, Faraday Discussions, 133, 231
- van Zadelhoff et al. (2003) van Zadelhoff, G.-J., Aikawa, Y., Hogerheijde, M. R., & van Dishoeck, E. F. 2003, A&A, 397, 789
- Walter et al. (2003) Walter, F. M., Herczeg, G., Brown, A., Ardila, D. R., Gahm, G. F., Johns-Krull, C. M., Lissauer, J. J., Simon, M., & Valenti, J. A. 2003, AJ, 126, 3076
- Woitke et al. (2009) Woitke, P., Kamp, I., & Thi, W.-F. 2009, A&A, 501, 383
- Wood & Karovska (2004) Wood, B. E. & Karovska, M. 2004, ApJ, 601, 502
- Wood et al. (2002) Wood, B. E., Karovska, M., & Raymond, J. C. 2002, ApJ, 575, 1057
- Yang et al. (2012) Yang, H., Herczeg, G. J., Linsky, J. L., Brown, A., Johns-Krull, C. M., Ingleby, L., Calvet, N., Bergin, E., & Valenti, J. A. 2012, ApJ, 744, 121
- Yang et al. (2011) Yang, H., Linsky, J. L., & France, K. 2011, ApJ, 730, L10+