PHENIX Collaboration
Neutral pion production with respect to centrality and reaction plane in AuAu collisions at =200 GeV
Abstract
The PHENIX experiment has measured the production of s in AuAu collisions at = 200 GeV. The new data offer a fourfold increase in recorded luminosity, providing higher precision and a larger reach in transverse momentum, , to 20 GeV/. The production ratio of is 0.460.01(stat)0.05(syst), constant with and collision centrality. The observed ratio is consistent with earlier measurements, as well as with the and Au values. are suppressed by a factor of 5, as in earlier findings. However, with the improved statistical precision a small but significant rise of the nuclear modification factor vs , with a slope of 0.0106 [Gev/]-1, is discernible in central collisions. A phenomenological extraction of the average fractional parton energy loss shows a decrease with increasing . To study the path length dependence of suppression, the yield was measured at different angles with respect to the event plane; a strong azimuthal dependence of the is observed. The data are compared to theoretical models of parton energy loss as a function of the path length, , in the medium. Models based on pQCD are insufficient to describe the data, while a hybrid model utilizing pQCD for the hard interactions and AdS/CFT for the soft interactions is consistent with the data.
pacs:
25.75.DwI Introduction
Discovery of the suppression of high transverse momentum () hadrons in relativistic heavy ion collisions Adcox et al. (2001); Adler et al. (2003a); Adams et al. (2003) and the absence of such suppression in Au collisions Adler et al. (2003b) inspired intense theoretical work during the past decade. The phenomenon was immediately interpreted, in fact, even predicted Bjorken ; Wang and Gyulassy (1992); Baier et al. (2000), as the energy loss of a hard scattered parton in the hot, dense strongly-interacting quark-gluon plasma (QGP) formed in the collision. Prompted by the large amount of very diverse experimental data from the Relativistic Heavy Ion Collider (RHIC) – namely, by suppression patterns at various collision energies, colliding systems, and centralities – several models have been developed, based mostly on perturbative quantum chromodynamics (pQCD) (see Section III.5 as well as Armesto et al. ). The suppression patterns are quantified by the nuclear modification factor , defined for single-inclusive s as
| (1) |
where is the production cross section of in collisions, is the nuclear overlap function averaged over the relevant range of impact parameters, and is the number of binary nucleon-nucleon collisions computed with . Despite their different approaches, several models Arnold et al. (2001); Wang and Guo (2001); Salgado and Wiedemann (2003); Marquet and Renk (2010) were able to describe the and centrality dependence of within experimental uncertainties. At the same time, those models provided very different estimates of medium properties such as the transport coefficient , the average 4-momentum-transfer-squared per mean free path of the outgoing parton within the medium. For this reason, alone does not provide sufficient constraint for extracting medium properties such as from the theoretical predictions, because it averages the varying energy losses along many different paths of the parton in the medium.
While dihadron correlation measurements are a successful approach to constrain of the parton in the medium Adare et al. (2009), the single particle observable typically has smaller statistical errors and higher reach. In addition, if is measured as a function of the azimuthal angle with respect to the event plane of the collision, the average path length can be constrained Adler et al. (2007); Afanasiev et al. (2009a). In all but the most central ion-ion collisions, the overlap region of the nuclei is not azimuthally isotropic. The average distance the parton traverses before emerging and fragmenting varies as a function of the angle with respect to the event plane. Each collision centrality class selects different values, so the differential observable directly probes the path length dependence of the energy loss.
The first measurements of azimuthal asymmetries of nuclear suppression and collective flow Adler et al. (2007); Afanasiev et al. (2009a); Adare et al. (2010a) used s as the probe, which has the advantage that s are relatively easy to identify over a very wide range in a single detector – a crucial factor in mitigating systematic uncertainties. As pointed out in Afanasiev et al. (2009a), both collective flow and azimuthal dependence of nuclear suppression can be formally defined at any , but they have historically and conceptually different roots. The notion of collective flow originates in lower phenomena, and is usually interpreted as a boost to the original spectrum (of partons or final state particles) in the direction of the highest pressure gradient. In contrast, and are typically used to describe high behavior, and their decrease from unity interpreted as a loss of parton momentum due to the presence of a medium. In this paper, results on production, the nuclear modification factor , and its azimuthal dependence in terms of the event-plane-dependent are presented. The results presented here are based upon the data collected in the 2007 RHIC run. The data sample is four times larger than that of Adare et al. (2008a); Afanasiev et al. (2009a). The dedicated reaction plane detector Richardson et al. (2011) installed in 2007 offers improved event-plane resolution.
II Experimental details
II.1 Data set
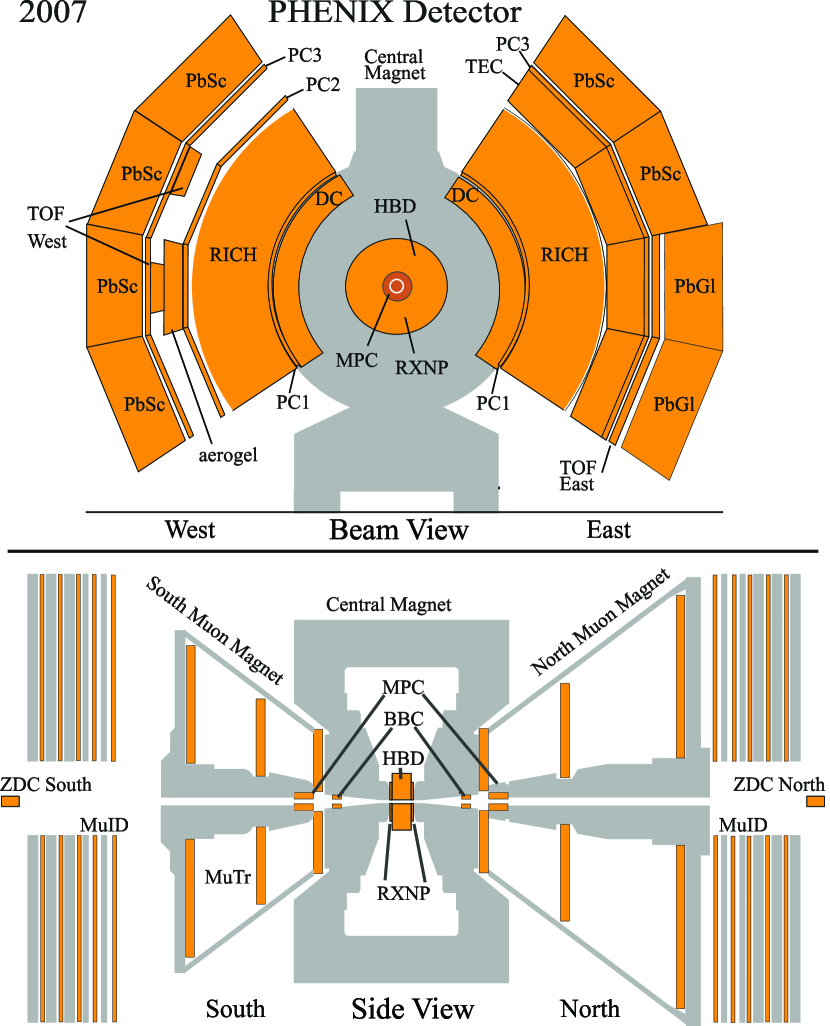
This analysis used minimum bias AuAu collisions at GeV recorded by the PHENIX experiment Adcox et al. (2003) at RHIC in 2007. The experimental setup is shown in Figure 1. Collision centrality was determined from the amount of charge deposited in the Beam-Beam Counters (BBC, ). From a Monte Carlo calculation based on the Glauber model Glauber (1958); Miller et al. (2007), the average number of participants , the number of binary collisions , and impact parameter are estimated (see Table 1).
| Centrality | ||||
|---|---|---|---|---|
| (%) | [fm] | |||
| 00–10 | 325.83.8 | 960.296.1 | 3.10.1 | 0.105 0.004 |
| 10–20 | 236.15.5 | 609.559.8 | 5.60.2 | 0.198 0.008 |
| 20–30 | 167.65.8 | 377.636.4 | 7.30.3 | 0.284 0.010 |
| 30–40 | 115.55.8 | 223.923.2 | 8.70.3 | 0.358 0.011 |
| 40–50 | 76.25.5 | 124.614.9 | 9.90.4 | 0.425 0.013 |
| 50–60 | 47.14.7 | 63.99.4 | 10.90.4 | 0.495 0.016 |
| 60–70 | 26.73.7 | 29.85.4 | 11.90.5 | 0.575 0.023 |
| 70–80 | 13.72.5 | 12.62.8 | 12.60.8 | 0.671 0.024 |
| 80–93 | 5.60.8 | 4.20.8 | 13.90.5 | 0.736 0.021 |
II.2 Reaction plane
Each noncentral nucleus-nucleus collision has a well-defined reaction plane, given by the beam direction and the impact parameter vector of the actual collision. Although this reaction plane cannot be directly observed, an event plane can be experimentally determined event-by-event using the method discussed in detail in Afanasiev et al. (2009b).
In order to reduce the biases to the event plane determination from physical correlations such as Hanbury-Brown-Twiss (HBT), resonance decay, and especially high- jet production, it is necessary that the event plane is determined with a large gap with respect to the high- measurement Adare et al. (2012a). Therefore, in this analysis measurements from two detectors were combined, located along the beam direction to the North and South of the interaction region. The first is a pair of muon-piston calorimeters (MPC) Chiu (2007); Kazantsev (2007) covering 3.1 3.9 in pseudorapidity and consisting of 240 2.22.218 cm3 crystals each. The second is a pair of reaction-plane detectors (RxNP) Richardson et al. (2011), which are plastic scintillators, with 20 mm of lead converter in front of it. The RxNP is divided into 12 azimuthal segments and further divided radially into outer (RxNPout) and inner (RxNPin) rings. The outer ring covers 1.0 1.5 and the inner ring covers 1.5 2.8. The current analysis did not use RxNPout and the event plane was established only from the MPC and RxNPin. The resolution is shown in Fig. 2. The method to establish the event plane from the combined MPC-RxNPin information is identical to that used in Adare et al. (2010a).
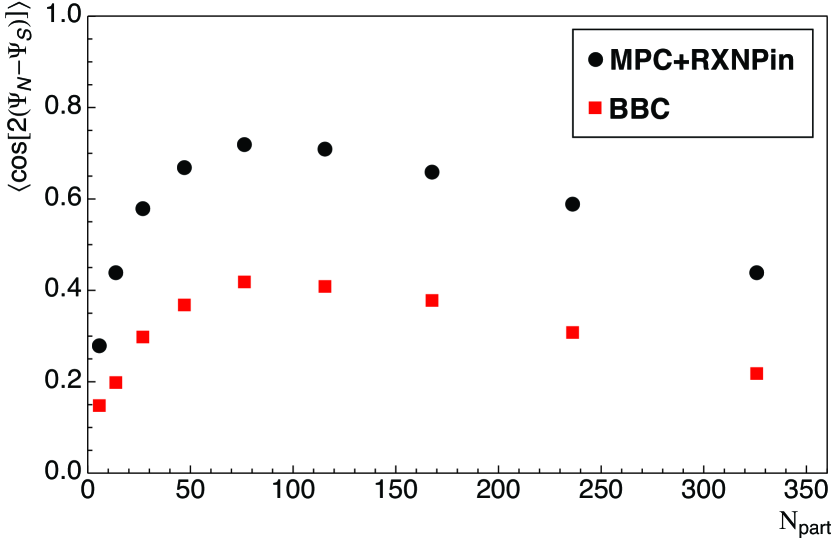
In order to estimate the resolution of the event plane, it is measured independently by the north and south detectors, and , respectively. The resolution is then characterized by . Higher values indicate better resolution. The resolution is centrality-dependent, as shown in Figure 2.
II.3 Neutral pions
Neutral pions are measured via the decay channel. Photons are identified in the PHENIX Electromagnetic Calorimeter (EMCal, described in Aphecetche et al. (2003)) consisting of two subdetectors, both extending to in pseudorapidity and are located at 5.1 m radial distance from the collision point. The analysis uses data from the lead-scintillator (PbSc) sampling calorimeter, which comprises six sectors covering of the full azimuth and has a 5.55.5 cm2 granularity and depth of 18 radiation lengths. Photons are identified using various cuts on the shower shape observed in the calorimeter as well as by comparing the observed shapes to an ideal one, parametrized using well-controlled test beam data Aphecetche et al. (2003). Since this analysis is restricted to the region above 5 GeV/, the hadron contamination is small; hadrons in this energy region typically deposit only a small fraction of their energy in the EMCal.
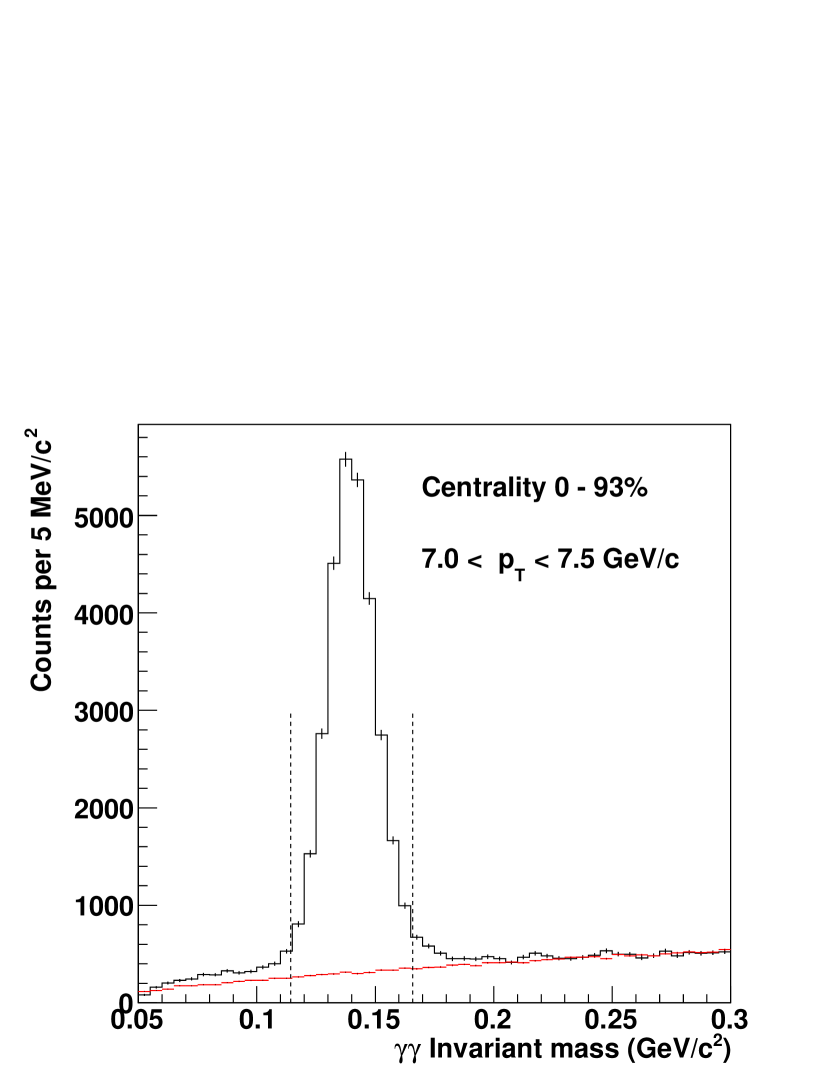
The invariant mass is calculated in bins of photon pair from each pair of photons, provided the pair passes the energy asymmetry cut where , and the distance between the impact positions of the two photons is larger than 8 cm. An example distribution is shown in Fig. 3. For the event-plane-dependent studies the procedure is repeated in six 15∘-wide bins of angles with respect to the event plane. The combinatorial background is estimated with the event mixing technique where photons from one event are combined with photons from other events, which satisfy the same global conditions (vertex position, centrality, event plane direction), and is calculated. The mixed-event distributions are then normalized and subtracted from the real event distributions. The resulting peaks are 10-11 MeV wide, depending on centrality, and have very small residual background due to the inherent correlations in real events not reproducible by the mixed-event technique. This residual background is fitted to a second-order polynomial in the regions below and above the peak. This polynomial shape is then subtracted from the distribution. The raw yields are extracted by integrating the resulting histogram in a 2.5 wide window.
In order to establish the combined effects of acceptance and detection efficiency, single s are generated with a distribution uniform in and extending to in pseudorapidity, then simulated in the full geant3 GEANT 3.2.1 (1993) framework of PHENIX. After the geant3 output is tuned to reproduce the inactive detector areas as well as the peak positions and widths observed in real data, the simulated s are embedded into real events. The embedded output can then be analyzed with the very same tools as the real events.
At high , the two decay photons may be so close that the EMCal can no longer resolve them as two particles and provide the proper energies and impact points. The two photons “merge” into one cluster, and the corresponding cannot be reconstructed from . Such merged clusters were rejected by various shower profile cuts, and the loss was determined by simulated s embedded into real events and analyzed with the same cuts. At 11 GeV/ merging happens only for the most symmetric decays resulting in a 5% loss of s. At 17 GeV/ the correction is 50%. At = 20 GeV/ about 70% of s are lost due to this effect. The systematic uncertainties were estimated by comparing yields extracted in bins of asymmetry (). The yields are corrected for the bin width by fitting the invariant yield to a power-law fit and adjusting the yield to correspond to the one at the center of the bin.
II.4 Systematic uncertainties
| [GeV/ ] | indep. | 6 | 8 | 10 | 16 | Type |
|---|---|---|---|---|---|---|
| Yield extr. (%) | 5.0 | 4.0 | 3.0 | 2.0 | B | |
| E scale (%) | 6.0 | 6.0 | 7.0 | 7.0 | B | |
| PID (%) | 4.0 | 3.0 | 4.0 | 5.0 | B | |
| Merging (%) | 4.5 | 28.0 | B | |||
| Acceptance (%) | 1.0 | B | ||||
| Off-vertex (%) | 1.5 | C | ||||
| Total (%) | 1.8 | 8.8 | 7.8 | 9.7 | 29.4 |
Systematic uncertainties are characterized as follows. Type A uncertainties are point-to-point uncorrelated with . Type B uncertainties have point-to-point correlations that cannot be characterized by a simple multiplicative factor, but vary smoothly with . Finally, type C uncertainties would move all points up or down by a common multiplicative factor, a typical example being the uncertainty on in .
The type B systematic uncertainty of the raw yield extraction has been estimated by comparing yields obtained in windows of varying widths. The uncertainty is less than 5% for peripheral collisions (low multiplicity, small combinatorics) and reaches about 7% in central collisions.
The uncertainty on the efficiency of the photon identification (PID) is estimated comparing fully corrected yields obtained with various PID cuts. The uncertainty is 2–4% at 5–8 GeV/, and increases both with centrality and with . It is of type B.
The uncertainty on the energy scale is estimated from how well the peaks and widths of simulated s embedded in real events agree with the measured peaks and widths at each centrality. The difference is less than 1% at 5–8 GeV/. Due to the steeply falling spectrum this less-than-1% uncertainty of the energy scale translates to about 7% uncertainty on the invariant yield.
The uncertainty due to the photon-merging correction is estimated as follows. Raw yields at high are extracted in different asymmetry windows both from real data and simulated decay photon pairs embedded in real data. Apart from small and precisely calculable acceptance effects, the true asymmetry distribution is flat, and at any given one should observe the same raw yield, for instance, in the window and . However, lower asymmetry means a smaller opening angle of the decay leading to a greater probability for the photons to merge. Therefore, the measured asymmetry distribution at high is not flat. To determine the photon-merging correction and its systematic uncertainty, a series of raw yield ratios in different asymmetry bins were compared between data and simulation. The uncertainties on the spectra due to the merging correction are and centrality dependent.
The uncertainty due to acceptance corrections is estimated from the ratio of simulated acceptance distribution and its fit function, which is actually used for corrections. Since the geometry is well understood and a single map to exclude malfunctioning areas of the detector has been used for the entire data set, this uncertainty is less than 1% for all centralities.
There are two sources of s not coming from the vertex (off-vertex ): those produced by hadrons interacting with detector material (instrumental background) and feed-down products from weak decay of higher mass hadrons (physics background). Based upon simulations, both types of background were found to be negligible at less than 1 % for greater than 2.0 GeV/, with the exception of s from decay which contribute about 3% to the yield for greater than 1 GeV/, and have been subtracted from the data. The uncertainty due to this effect is conservatively estimated as 1.5 % and is of type C.
II.5
Similar to the previous analysis Afanasiev et al. (2009a) the measurement uses both the inclusive and the quantity , where is defined as the second Fourier expansion coefficient of the single inclusive azimuthal distribution
| (2) |
and . This assumes that the second Fourier coefficient is dominant in this expansion. The azimuthal anisotropy has been published in Adare et al. (2010a).
The yield is subdivided into six evenly-spaced azimuthal bins in from 0 to on an event-by-event basis using the measured event plane (see Sec. II.2). From the inclusive the -dependent can be constructed as
| (3) |
where
| (4) |
and the summation runs over the azimuthal bins.
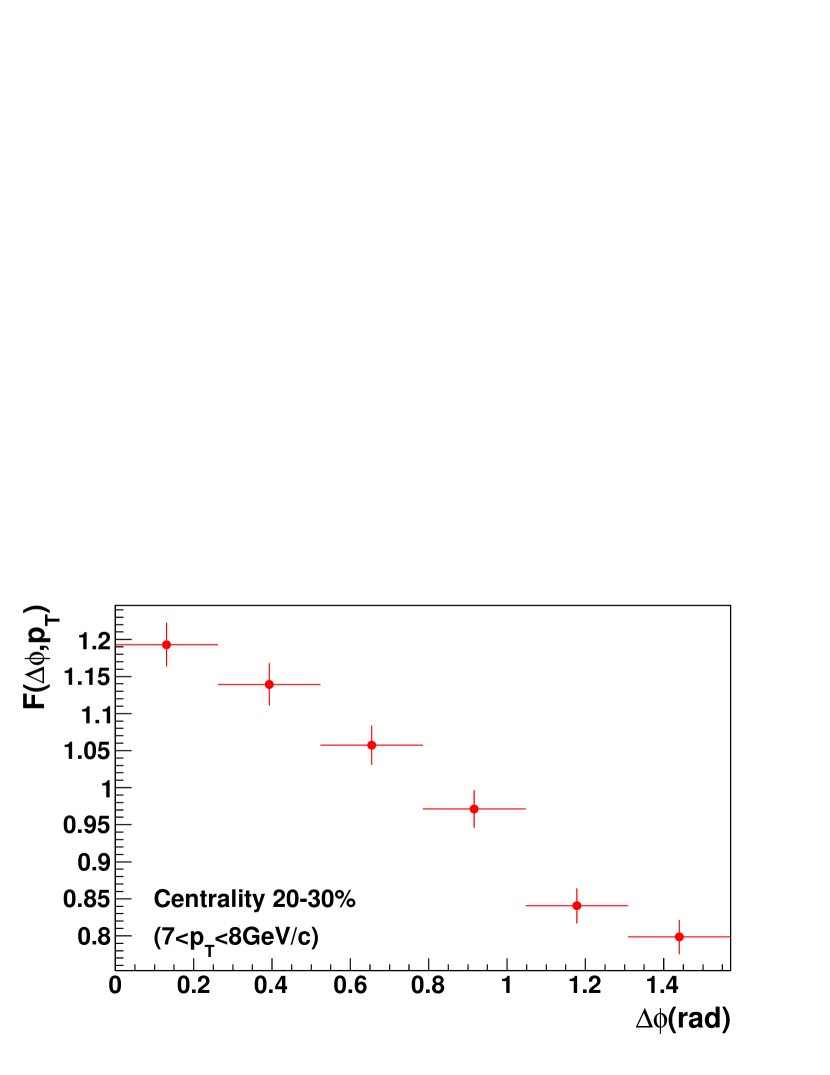
Because of finite event plane resolution, , as calculated from the raw yields, needs to be corrected. An approximate unfolding can be done by using the raw and the resolution-corrected
| (5) |
The relation between the raw and the corrected is given by
| (6) |
The denominator is shown in Fig. 2. Figure 5 shows the at GeV/ for centrality 20–30.
III Results
III.1 Spectra and power law fits
| System | A | n | /NDF |
|---|---|---|---|
| AuAu 0–5 % | 23.3 | 7.580.07 | 7.36/9 |
| AuAu 0–10 % | 26.3 | 7.660.05 | 5.43/9 |
| AuAu 10–20 % | 32.1 | 7.810.05 | 1.38/9 |
| AuAu 20–30 % | 25.6 | 7.81 | 14.2/9 |
| AuAu 30–40 % | 24.9 | 7.960.06 | 11.3/9 |
| AuAu 40–50 % | 20.0 | 8.020.08 | 7.50/9 |
| AuAu 50–60 % | 15.0 | 8.090.10 | 5.56/9 |
| AuAu 60–70 % | 5.04 | 7.920.13 | 12.6/9 |
| AuAu 70–80 % | 6.32 | 8.33 | 6.48/8 |
| AuAu 80–93 % | 5.16 | 8.79 | 8.14/8 |
| AuAu 0–93 % | 16.4 | 7.860.02 | 11.2/9 |
| () | 16.7 | 8.140.05 | 15.9/9 |
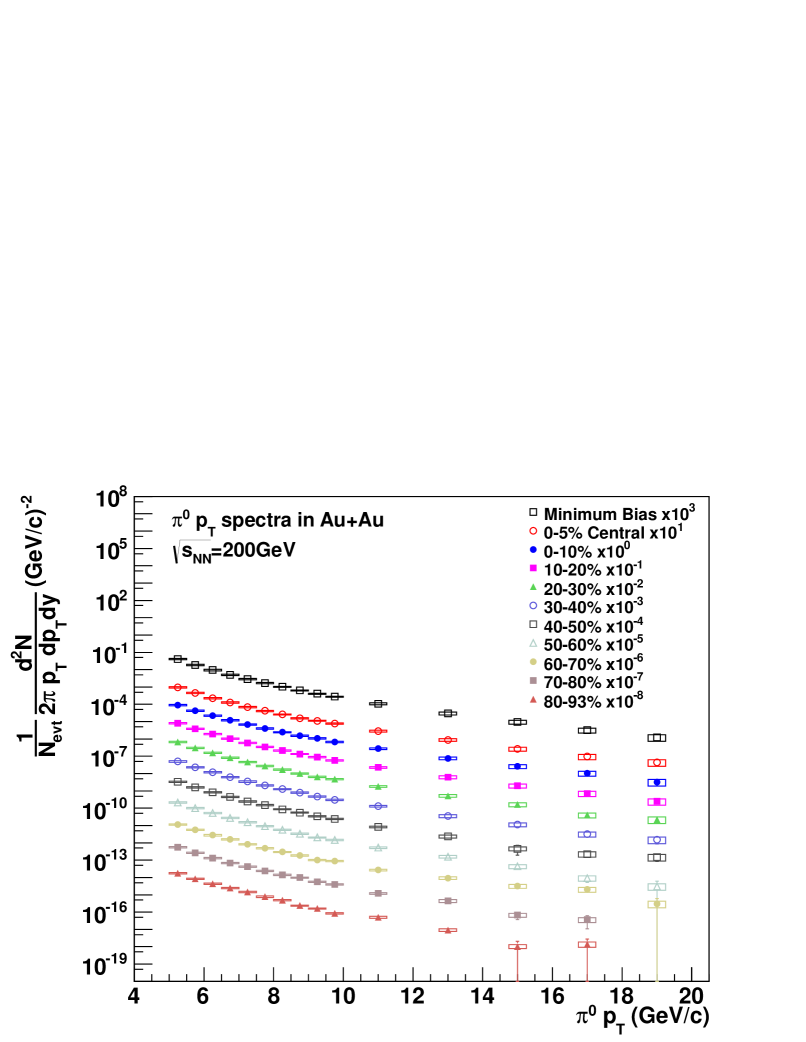
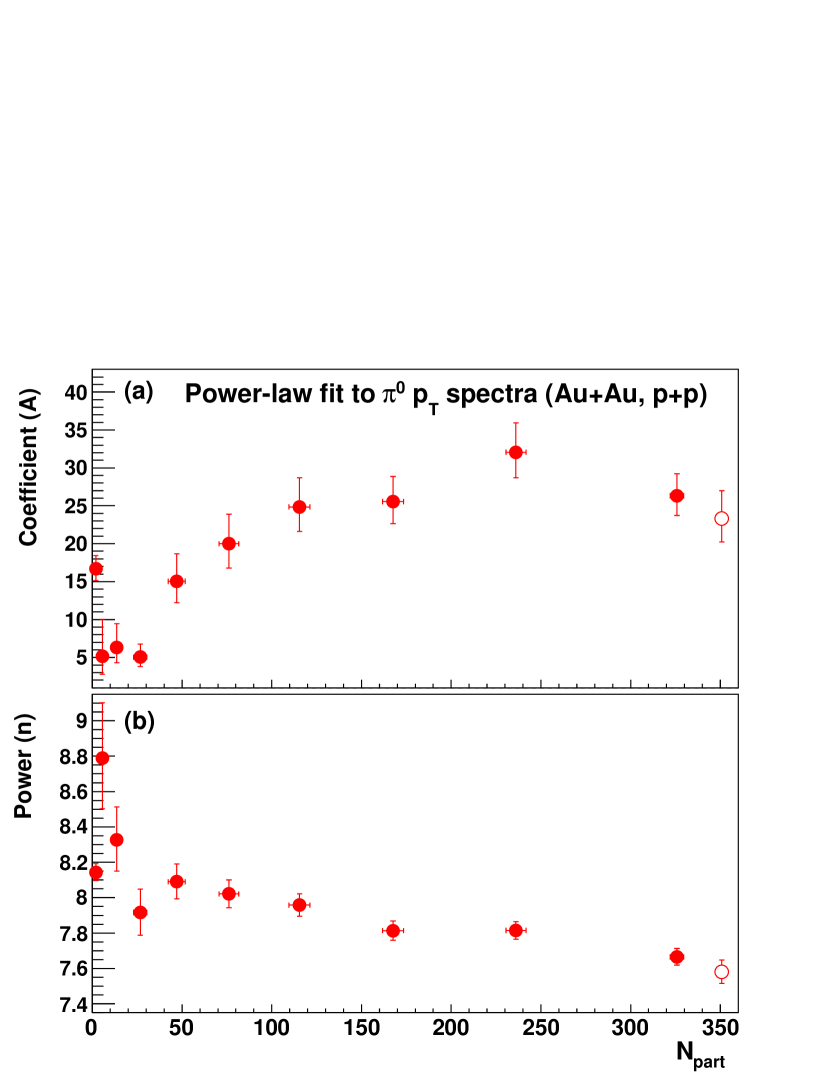
Figure 5 shows the invariant yield in AuAu collisions for all centralities, and for minimum bias data. As with earlier published results Adare et al. (2008a), in this range all distributions are well described by a single power law function []. The fit method employed here takes both statistical and systematic uncertainties into account, following the one established in previous publications Adare et al. (2008b, a, 2010b). The obtained fit parameters are listed in Table 3 for all AuAu centrality classes, as well as for measured in 2005 Adare et al. (2007). In the more peripheral collisions the AuAu and powers are consistent, but in central collisions the AuAu powers are slightly smaller, which is also reflected in the behavior of the nuclear modification factor (see Sec. III.3). Figure 6 shows the amplitudes and powers from Table 3.
III.2 The production ratio /
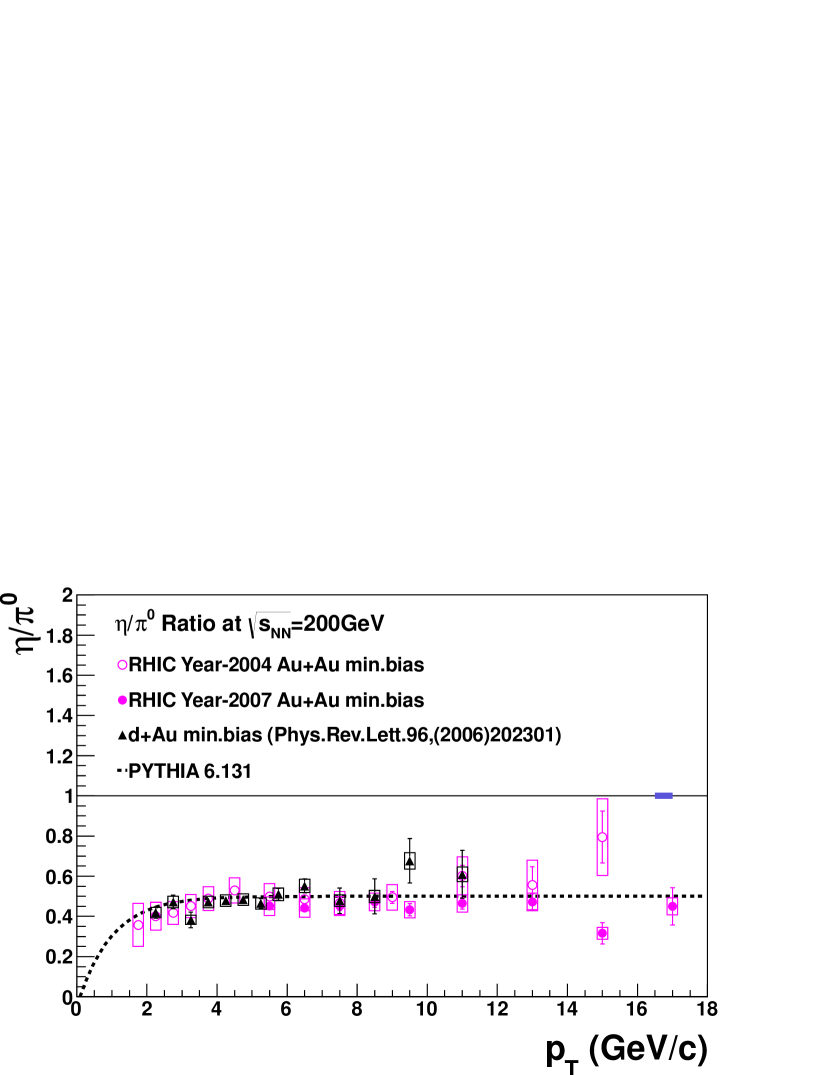
Combining the current high statistics results with the published meson spectra from the same (2007) data set Adare et al. (2010b) provides new ratios with much smaller uncertainties than those published previously Adler et al. (2006). Figure 7 compares the measured ratios from minimum bias collisions for various data sets and colliding systems. Although the uncertainties vary, the new ratios are consistent with previously published ones Adler et al. (2006) and are also consistent with the overlaid pythia-6.131 calculation.
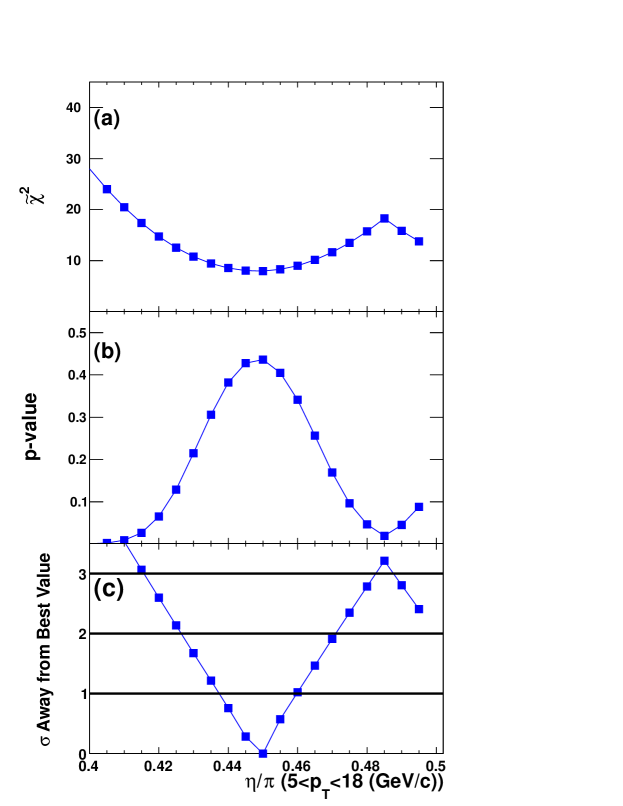
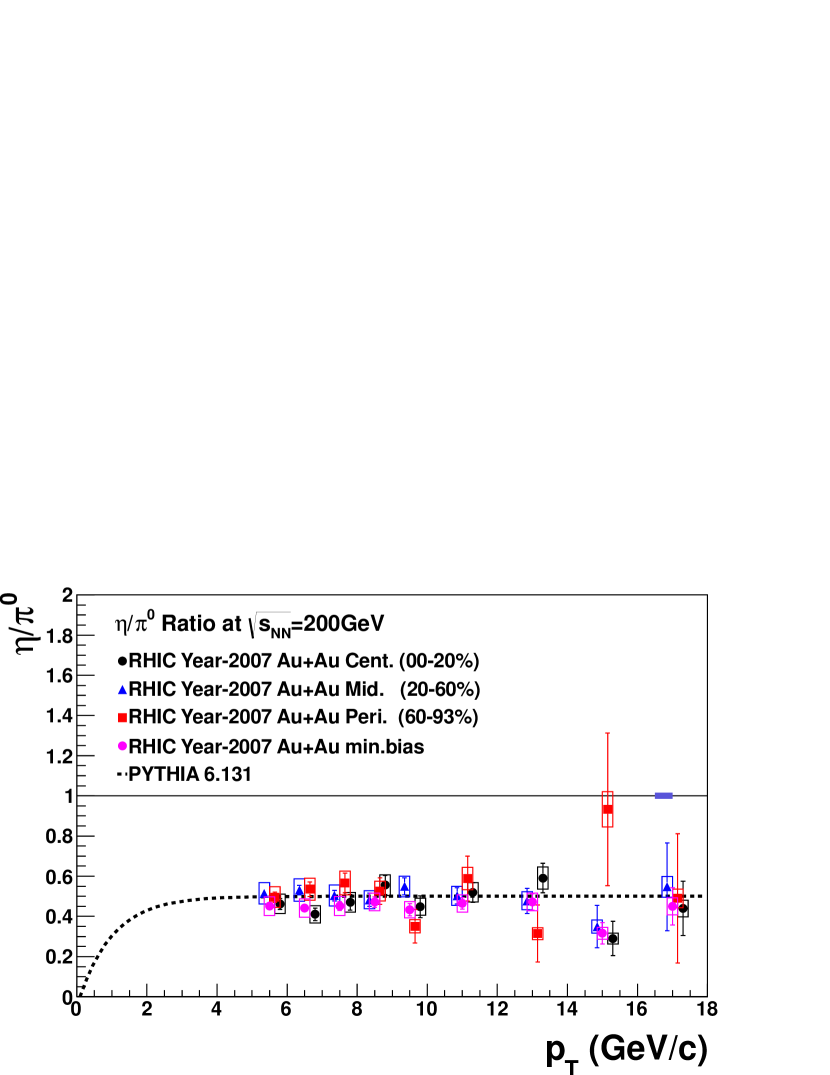
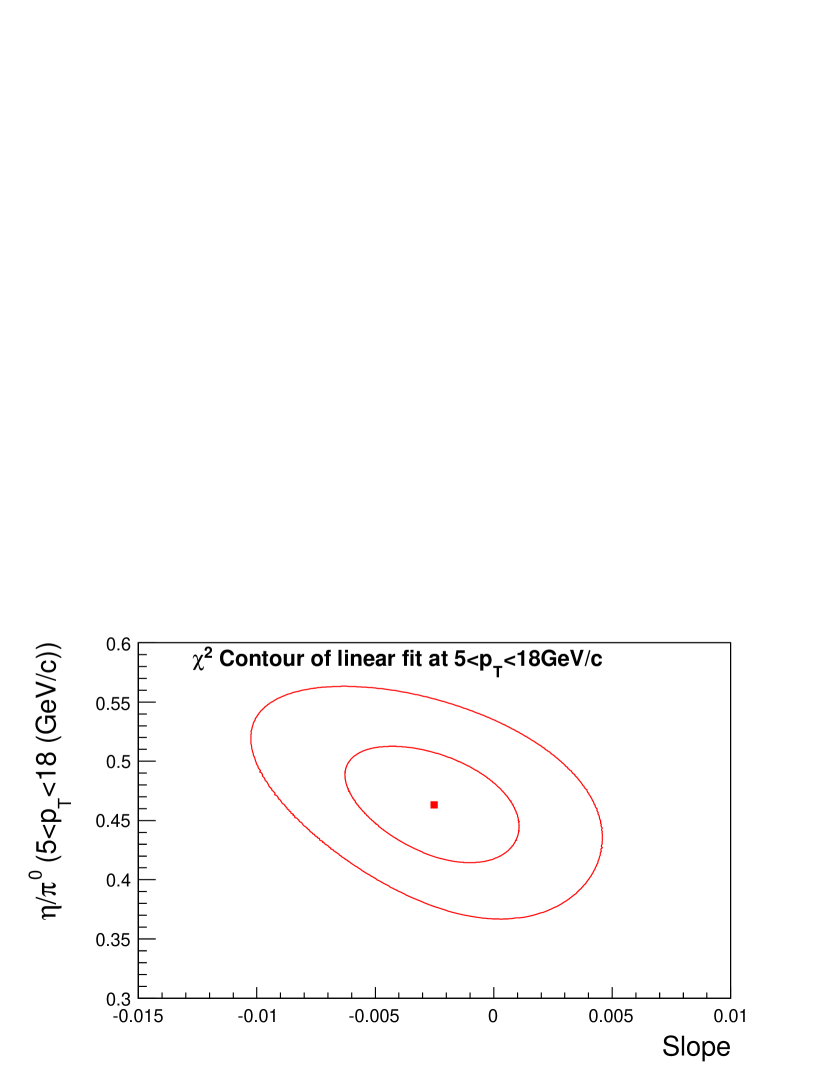
Figure 8 shows the ratios for various centralities along with the pythia values. A linear fit to the minimum bias data gives a constant term of 0.460.05 and a slope of -0.00250.0037, with the contours shown in Fig. 9. The fit method employed here takes both statistical and systematic uncertainties into account, following the one established in previous publications Adare et al. (2008b, a, 2010b), and fit values for all centralities are listed in Table 4. Since the data are fully consistent with a zero slope, they were refitted with a constant in the 5–18 GeV/ range, resulting in the final values of / = 0.45 for minimum bias, / = 0.47 for 0–20 %, / = 0.51 for 20–60 %, and / = 0.51 for 60–93 % centrality. Results of the statistical analysis of the constant fit to the minimum bias data are shown in Fig. 10. Note that the earlier published value Adler et al. (2006) for the most central AuAu collisions was =0.400.04; the current result is closer to the ratios observed in Au (0.470.03) and (0.480.03) Adler et al. (2006).
| Centrality | Intercept | Slope [1/GeV/ ] | /NDF |
|---|---|---|---|
| 00-93 % | 0.4630.049 | -2.52 | 7.46/7 |
| 00-20 % | 0.4630.053 | 3.33 | 14.8/7 |
| 20-60 % | 0.5250.058 | -5.67 | 4.03/7 |
| 60-93 % | 0.5110.061 | -2.80 | 9.36/7 |
The lack of nuclear effects on this ratio indicate that at high pT the fragmentation occurs outside the medium and the ratio is governed by vacuum fragmentation Adler et al. (2006). This is also supported by a recent global analysis of fragmentation functions (consider Figure 5 in Aidala et al. (2011) and the fact that the relevant range, the fraction of the four-momentum of the parton taken by a fragment, in the current measurement is about 0.05–0.2). The relevant pT is presumably 5–6 GeV/, below which recombination may be a significant hadronization mechanism (see Adare et al. (2012b); Afanasiev et al. (2007) and Bass et al. (2009)). Also, it should be pointed out, that precise knowledge of the absolute value of this ratio is important for the background calculations in dielectron and direct photon measurements.
III.3 Nuclear modification factor (-integrated)
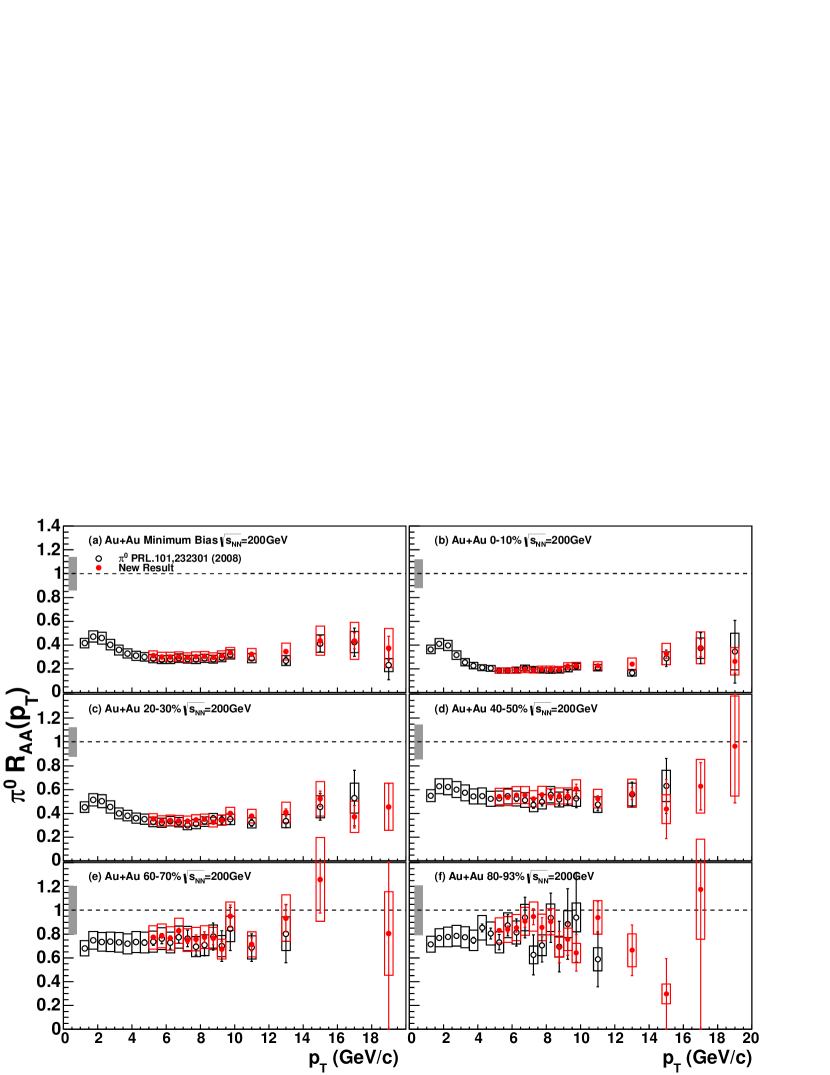
The reference yield of in collisions has been obtained from data taken in 2005 Adare et al. (2007). Instead of using a fit to the data, has been calculated by dividing the AuAu yields point-by-point by the -scaled cross section. Figure 11 shows for s as a function of for six representative centrality classes with the new results overlaid on the previously published ones Adare et al. (2008a). The analysis presented here spans the range = 5–20 GeV/ in several centrality classes. Gray bands show the global systematic uncertainties and are of type C, which are the quadratic sum of uncertainties of , normalization, and off-vertex contribution shown in Table 2. The results agree well in the overlapping region with the published data Adare et al. (2008a).
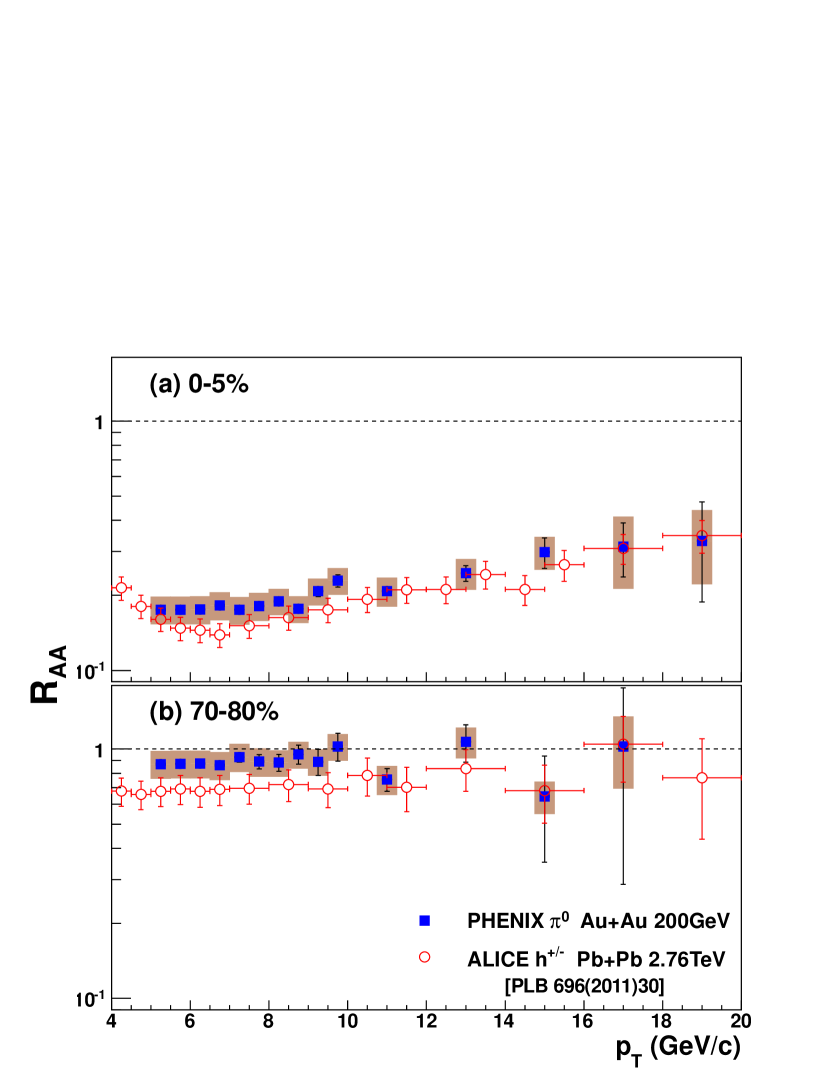
Figure 12 compares current RHIC = 200 GeV AuAu data to the charged hadron observed in = 2.76 TeV PbPb collisions at the LHC (ALICE experiment) Aamodt et al. (2011). For the PbPb points, the vertical error bars show the total errors. For both centralities and over the entire range of 5–20 GeV/, the two data sets appear to be similar. This is remarkable given the 14-fold increase of colliding energy, resulting in an approximately factor of two increase in the parton density at the LHC Horowitz and Gyulassy . The expected increase in the parton density is corroborated by the factor of 2.2 increase in dNch/d reported by ALICE Abelev et al. (2010).
However, there are two important caveats. Preliminary results from the same experiment on s, measured via photon conversions up to 10 GeV/, show an that is somewhat lower in central collisions than for charged hadrons Appelshauser . In Horowitz and Gyulassy the authors assert that the similarity of at RHIC and LHC may be coincidental. In any case, it does not mean that the RHIC and LHC data show the same average parton energy loss (see Sec. III.4), since the spectra are much harder (the power ) at the LHC. The power is obtained by fitting the ALICE charged hadron data Aamodt et al. (2011).
The fact that at = 200 GeV in central collisions reaches its minimum around 5 GeV/ transverse momentum was first observed in Adler et al. (2003a). higher appeared to be approximately constant, although the data did not unambiguously exclude a slow rise with Adare et al. (2008b, 2010b). On the other hand, all models that reproduce the large suppression observed at of 6–10 GeV/ predict a slow rise of as the transverse momentum increases Majumder and Shen ; Horowitz and Gyulassy . The current, higher precision data are used to reassess the -dependence of suppression in the RHIC regime.
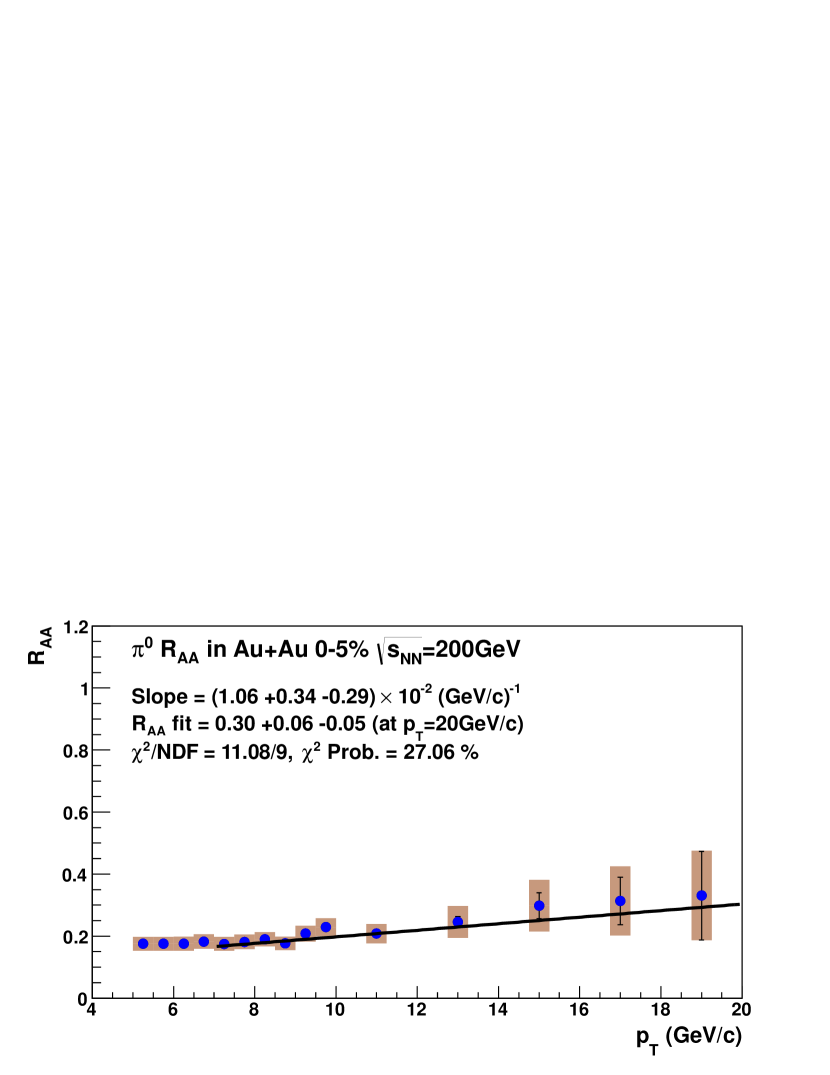
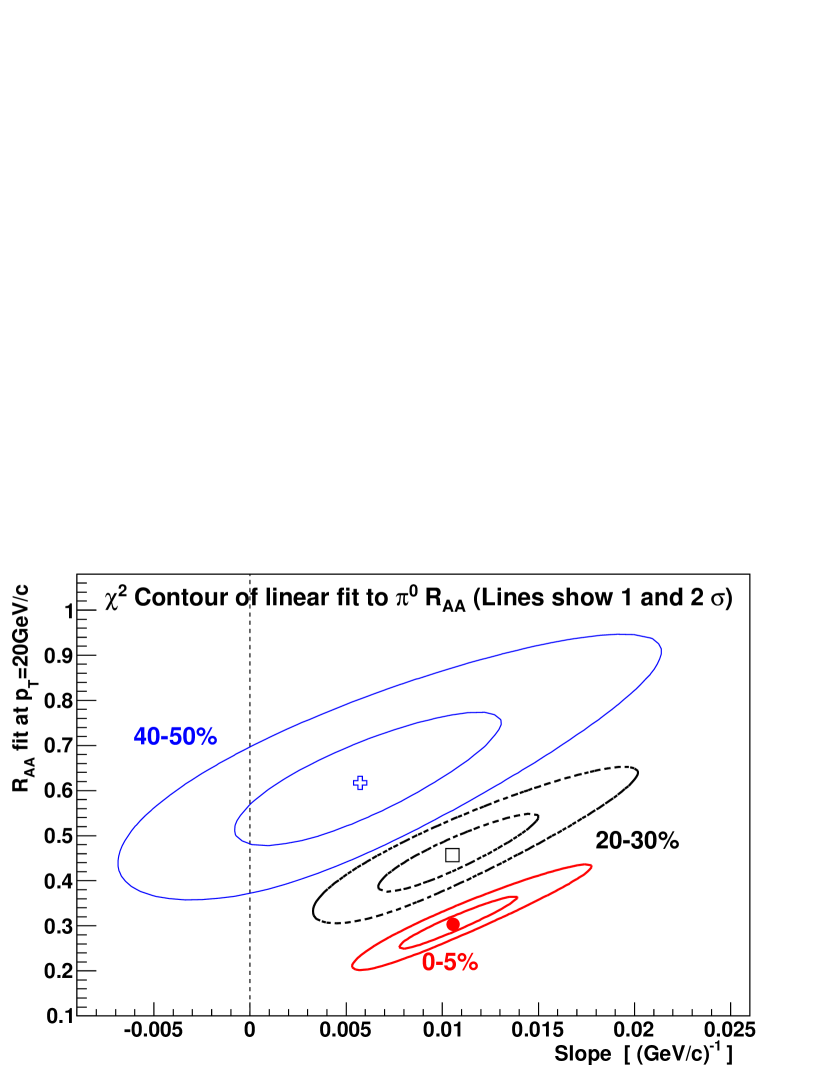
Figure 13 shows a sample linear fit to the -dependence of in the most central AuAu data. Figure 14 shows the 1 and 2 contour lines of the fitted slope and intercept for three centralities. The fit method employed here takes both statistical and systematic uncertainties into account, following the one established in previous publications Adare et al. (2008b, a, 2010b). In contrast to Figure 9 in Adare et al. (2008b) where the slope was consistent with zero within 1 due to the large uncertainties, the slope here is significantly different from zero, not only in the most central, but in 20–30% centrality collisions as well.
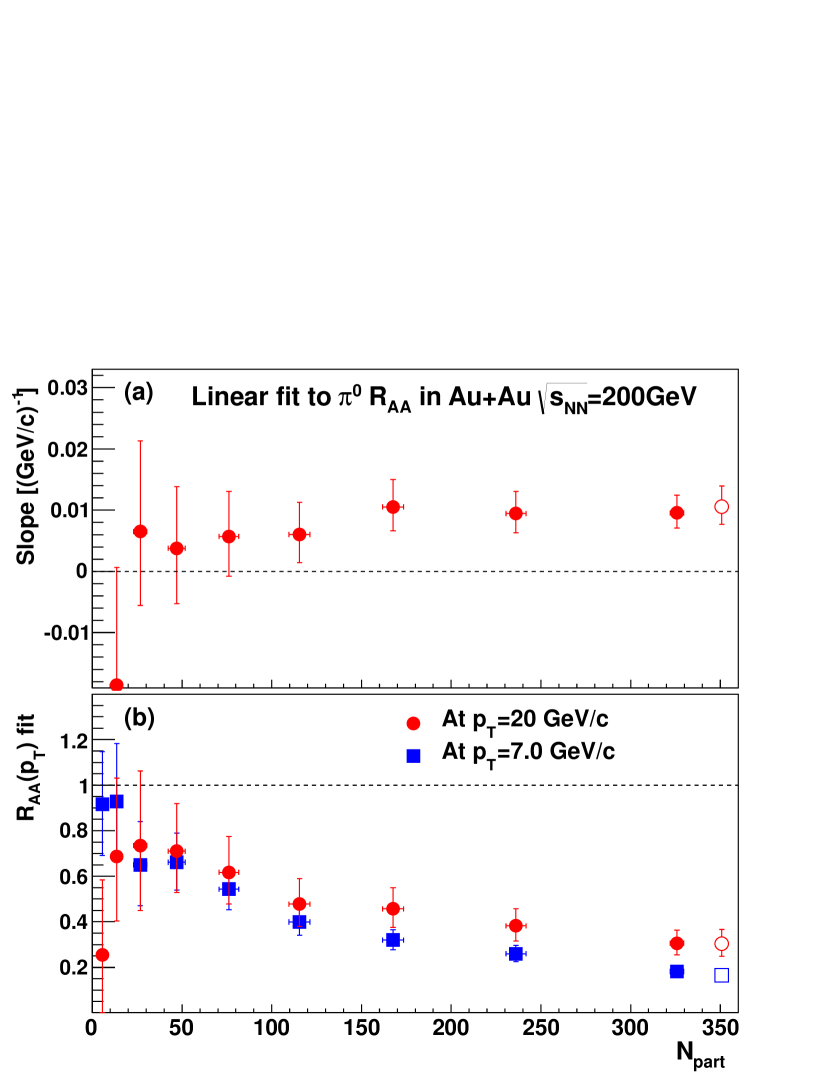
Figure 15 shows the fitted slopes (a) and the from the fits (b) at 7 GeV/ and 20 GeV/ for all centralities, expressed in terms of . At and above =167 (20–30% centrality) the slopes are significantly different from zero.
III.4 Phenomenological energy loss
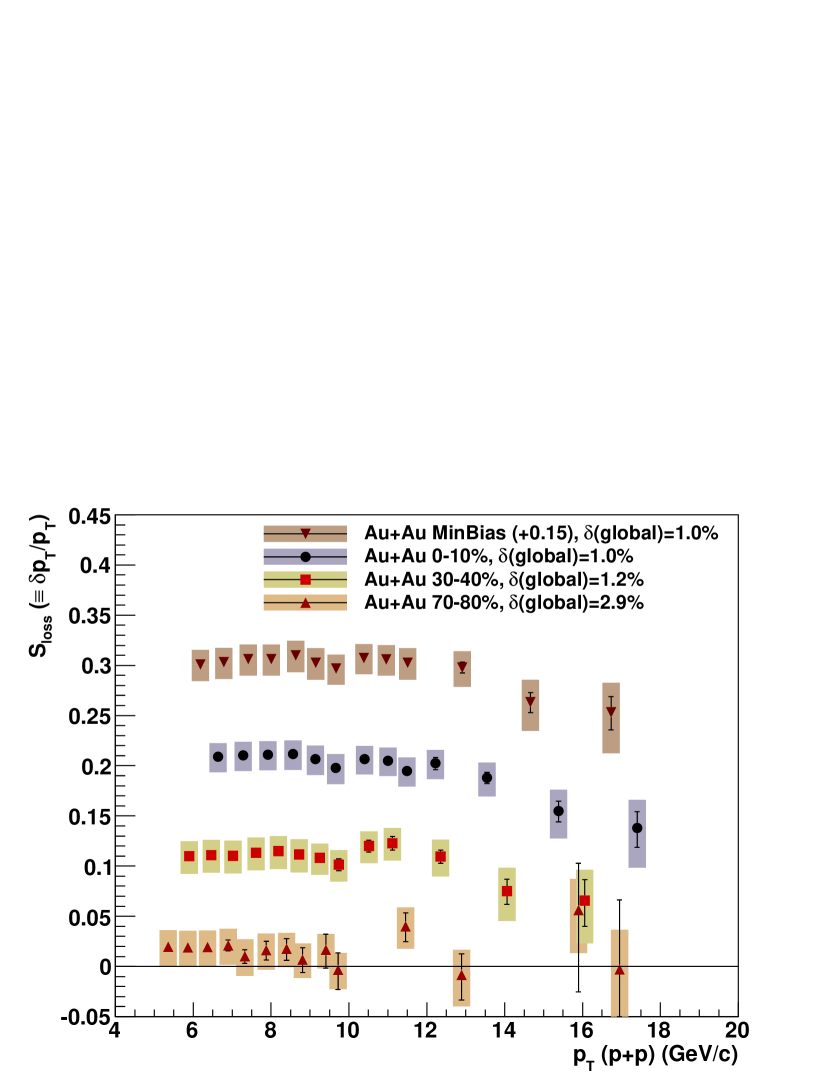
The average fractional momentum loss () of high hadrons has been of interest since it may reflect the average fractional energy loss of the initial parton. is defined as , where is the difference of the momentum in collisions () and that in AuAu collisions [], and the in the denominator is . In the previous publication Adler et al. (2007), the assumption was made that both AuAu and spectra are comparable in shape and vs is flat or slowly varying, since the data sample size was not large enough to directly calculate the . With these assumptions, the suppression of high hadrons could be phenomenologically interpreted as a fractional momentum loss by fitting AuAu spectra with, , where and were obtained from by fitting a power-law function to -scaled cross section Adler et al. (2007).
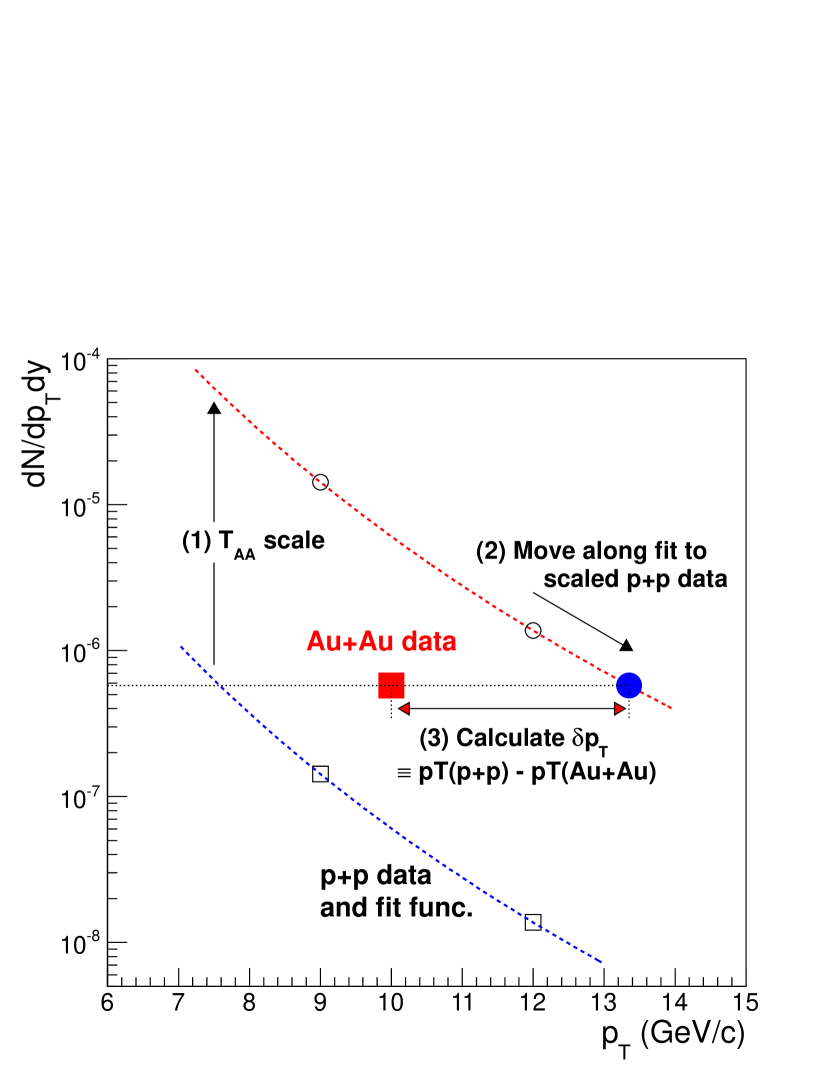
With larger statistics and AuAu data collected, it is possible to directly calculate without any assumptions. The calculation method is schematically depicted in Fig. 16. First, the cross section in [] is scaled by corresponding to the centrality selection of the AuAu data []. Second, the scaled cross section [] is fit with a power-law function []. Third, the scaled point closest in yield to the AuAu point of interest [] is found using the fit to interpolate between scaled data points. The is calculated as . For obtaining , the is divided by the . The uncertainty of the is calculated by inversely converting the quadratic sum of the uncertainties on the yields of AuAu and points, by the fit function. Statistical and type B systematic uncertainties are individually calculated in the same way. Therefore, the dependence of systematic uncertainties are propagated to the values.
Figure 17 shows the results for minimum bias collisions and three different centralities. The uncertainty coming from , which is of type C, changes with centrality selection as listed on the plot. The normalization error of 9.7% is not shown here because it moves all the points independent of or centrality. Because is plotted as a function of in collisions, the points in successive centrality bins in AuAu are shifted as the momentum loss of hadrons varies. An interesting feature of the central collision data is that while is constant up to at least 10 GeV/, at higher it slowly decreases, consistent with the slow rise of . If one assumes that the fragmentation function of the parton after energy loss is unchanged, the fractional momentum loss can be interpreted as the average fractional energy loss of the initial parton. This can then be compared to the trends predicted in Horowitz and Gyulassy . In this particular model (see Figure 4 in Horowitz and Gyulassy ), the collisional energy loss appears to be somewhat overestimated, particularly below 10 GeV/, but at higher the observed trend in is reproduced quite well.
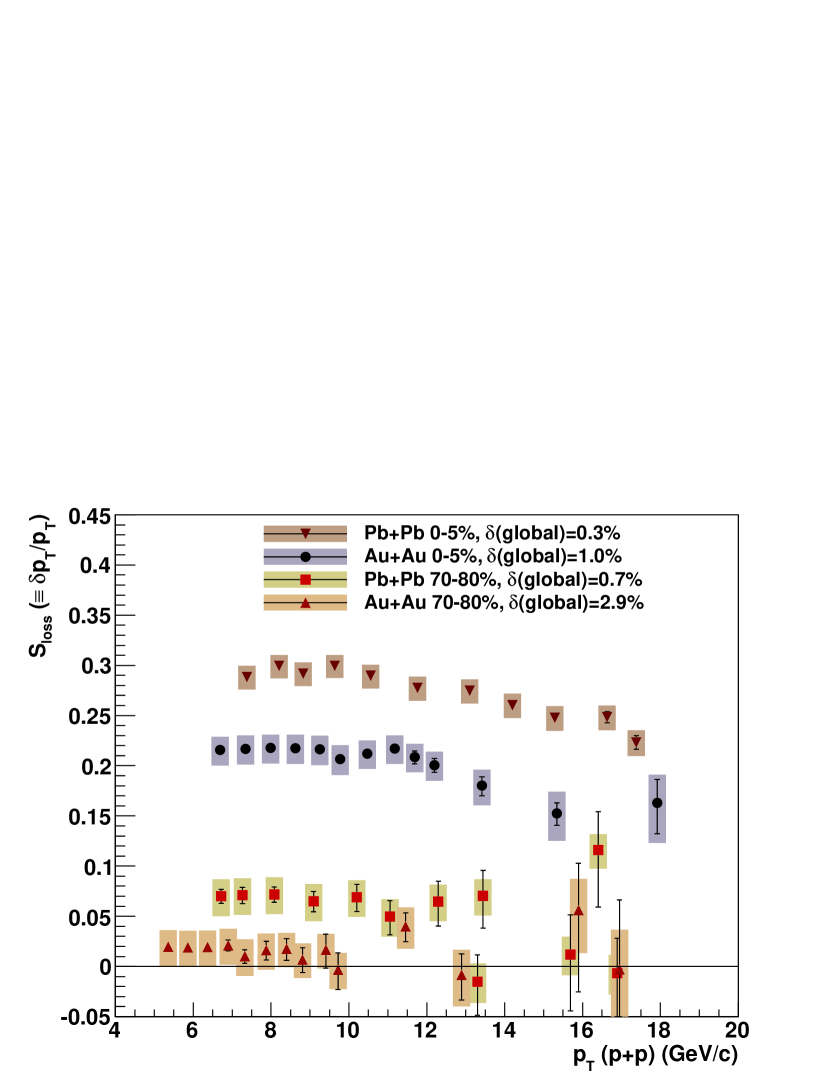
Figure 12 showed that the in the same centrality at RHIC and LHC show very similar dependence even though the collision systems and center-of-mass energies are vastly different. Figure 18 shows comparisons of . Note that the obtained from the ALICE charged hadron measurement is 30% higher than that from the PHENIX measurement. This is reasonable considering the fact that the powers () in the power-law fit to the spectra are different between the two systems; the power of the PHENIX s at GeV/ is about 8, while that of the ALICE charged hadrons is about 6.
III.5 Model calculations, transport coefficient
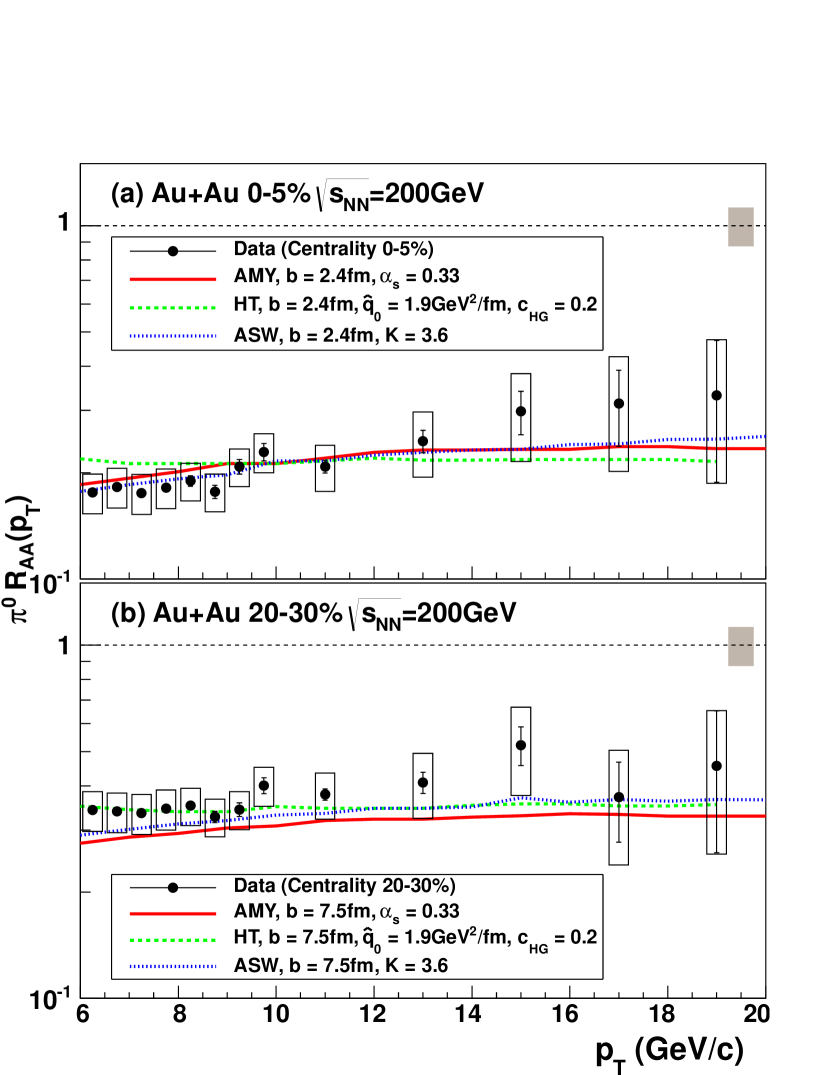
In this section, is compared to four different parton energy loss models, following the method described in Bass et al. (2009). All four models are incorporated into the same three-dimensional relativistic hydrodynamic calculation with an initial thermalization time = 0.6 fm/ and describe the observed elliptic flow, pseudorapidity distributions, and particle spectra at low . The Arnold-Moore-Yaffe formalism (AMY Arnold et al. (2001, 2002)) incorporates radiative and collisional energy loss processes in an extended medium in equilibrium at high temperature, i.e. small coupling constant , where . In this approximation, a hierarchy of scales of successively higher powers of the coupling constant can be identified, and it becomes possible to construct an effective theory of soft modes by summing contributions from hard loops into effective propagators and vertices. The higher-twist approach (HT Wang and Guo (2001)) is based on the medium-enhanced higher-twist corrections to the total cross section in deep inelastic scattering (DIS) off large nuclei Qiu and Sterman (1991). HT incorporates only radiative corrections, but it can directly calculate the medium-modified fragmentation function. The Armesto-Salgado-Wiedemann approach (ASW Salgado and Wiedemann (2003)), which is equivalent to the well known BDMPS-Z approach Baier et al. (1997); Zakharov (1997), includes only radiative processes in a medium where the mean free path of the parton is much larger than the color-screening length.
The crucial parameter in all these models is the transport coefficient defined as
| (7) |
where is the average squared transverse momentum transferred from the medium to the parton per collision and is the mean free path of the partons. In AMY is directly related to the temperature, while in HT it is related to the local entropy density () and in ASW it is related to the energy density .
Figure 19 compares the measured at two centralities with calculations using the energy loss models described above, incorporated into the same hydrodynamic evolution Bass et al. (2009). In these models, the value of is fixed such as to reproduce the measured in 0–5% centrality collisions. (See Bass et al. (2009) for the definitions of the parameters , and , which can be converted to .) The values of for gluons (defined as the value of at fm/ required to describe ) differ by a factor of five: is 4.1, 4.3 and 18.5 GeVfm in AMY, HT and ASW, respectively. The HT formalism was originally developed for deep inelastic scattering off a large nucleus, and hence it has become customary to quote the value of for a quark Majumder et al. (2009), and gives the value =1.9 GeVfm as seen in Fig. 19. Despite the large differences in the values of , all models describe both the -dependence and the centrality dependence of quite well. Additional experimental constraints are needed to differentiate between the models, for instance, restricting the average path length the parton traverses in the medium, which can be achieved not only in two-particle correlation measurements Adare et al. (2009) but also by studying of single particles.
III.6 Nuclear modification factor vs event plane
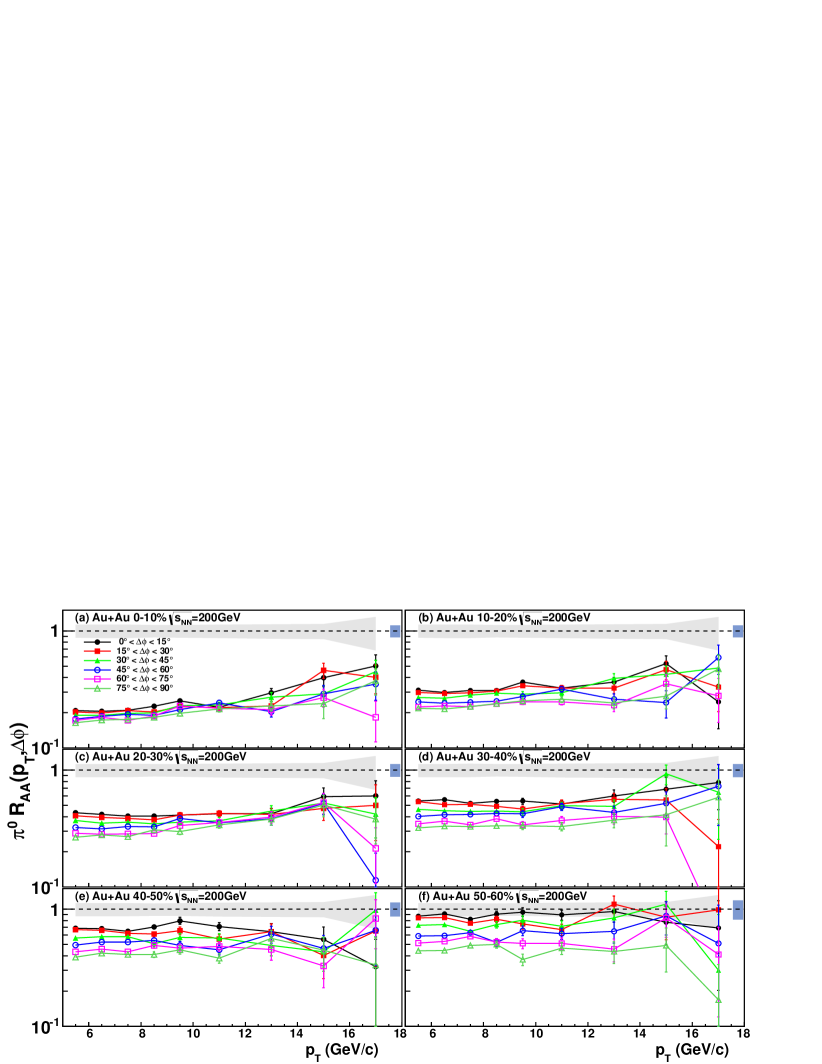
The overlap region of the colliding nuclei is not azimuthally isotropic, and neither is the medium that is formed in the collision. To first approximation (homogeneous density distribution of nucleons) the overlap region is elliptical, with the short axis being in the reaction plane. As a consequence, the average path length the hard scattered parton traverses in the medium, losing energy in the process, varies with the azimuthal angle , defined experimentally as the relative azimuthal angle between the emerging hadron and the measured event plane. Measuring as a function of provides additional constraints on the average in-medium path length Adler et al. (2007); Afanasiev et al. (2009a); Adare et al. (2010a), therefore, a more stringent test of energy loss models than the -integrated alone.
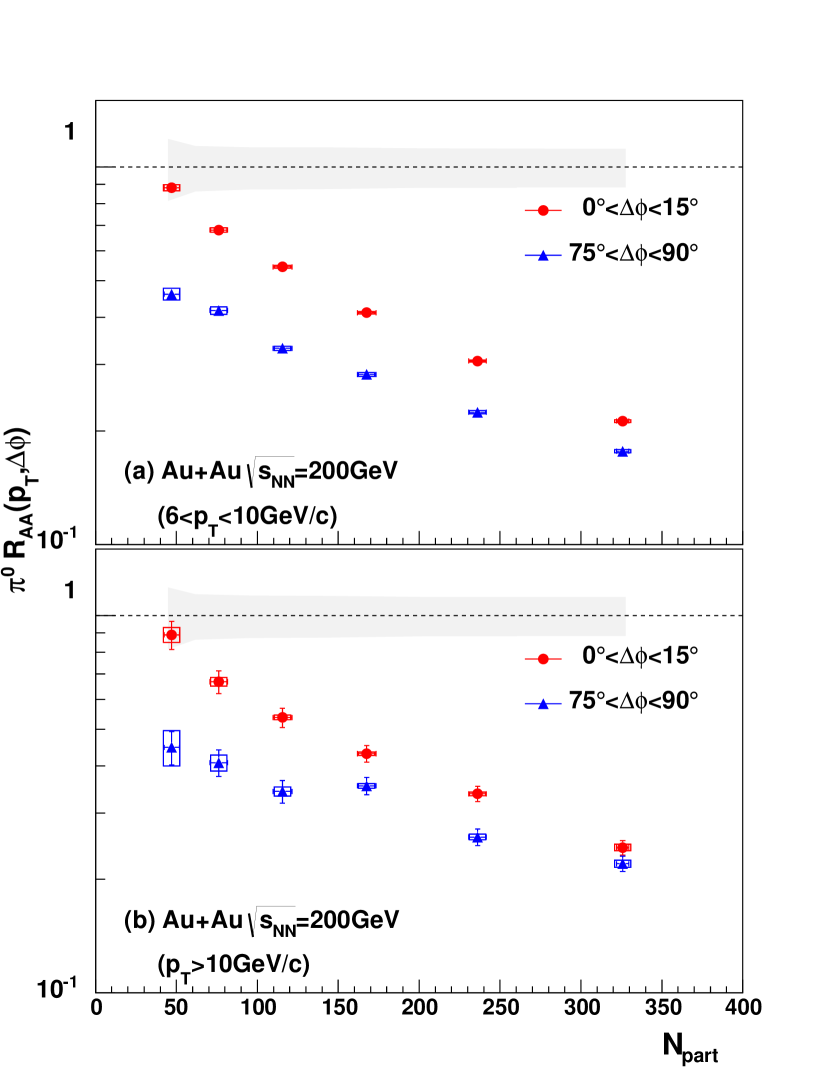
Figure 20 shows the differential nuclear modification factor for six bins in azimuth and six centralities. The participant eccentricities in Table 1 indicate the difference between the two extremes, in-plane and out-of-plane. In the most central collisions [panel (a)] the average path lengths in-plane and out-of-plane are almost identical, therefore, the curves almost completely overlap. As one moves to more peripheral collisions, the eccentricity of the overlap region increases and the six curves start to split up showing the expected ordering: suppression is always largest out-of-plane and smallest in-plane. A simple calculation using the participant eccentricity (see Table 1) shows that the in-plane path length changes from 6.1 fm to 3.4 fm when 0–10% and 50–60% centralities are compared, while the out-of-plane path length changes from 6.7 fm to 5.9 fm between the same two centralities. As a consequence, the out-of-plane changes much less with centrality than the in-plane . All these observations are in full agreement with the findings in Afanasiev et al. (2009a).
Figure 21 shows the evolution of with centrality in-plane and out-of-plane at (a) moderate transverse momenta (averaged in the 6–10 GeV/ region) and (b) averaged over all available above 10 GeV/. As expected, the difference between in-plane and out-of-plane suppression increases with eccentricity (decreasing ), and the actual values converge toward each other as the centrality increases.
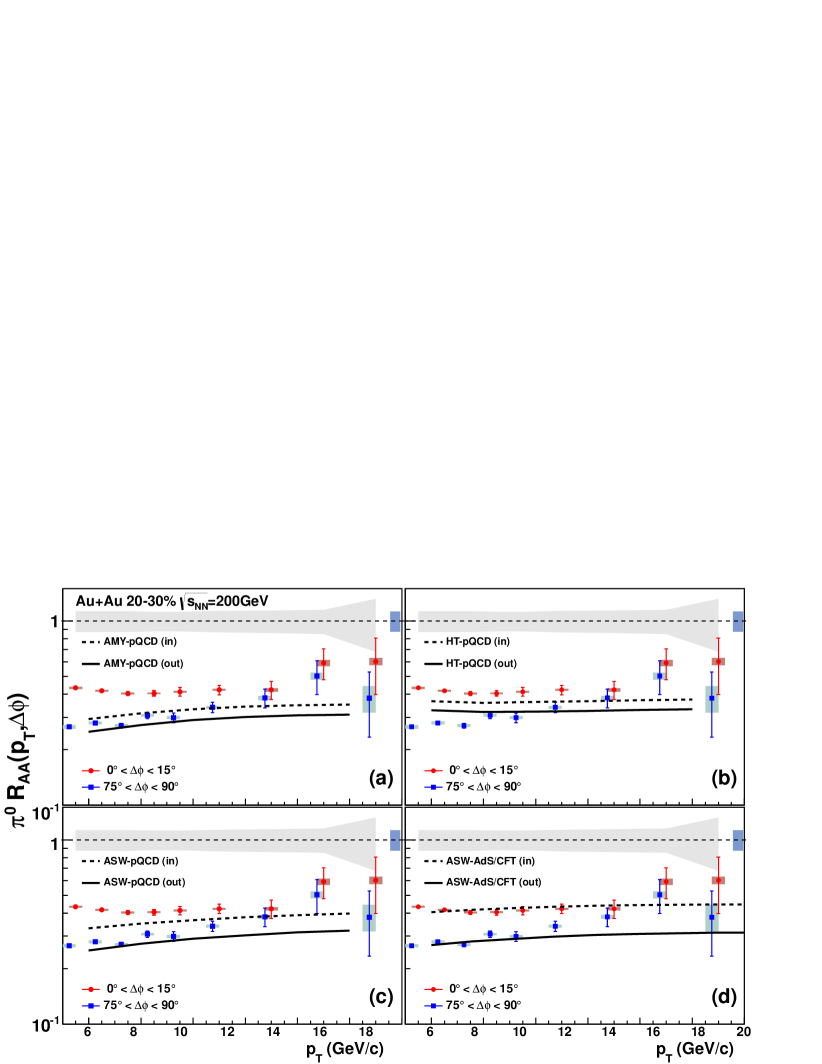
Figure 22 shows the comparisons of the models to the measured in-plane and out-of-plane as a function of for 20–30% centrality. The choice of the 20–30% centrality interval is motivated by the availability of calculations for all the models shown. Furthermore, this interval is a “sweet spot” in determining the reaction plane (minimum uncertainty). While statistical limitations of the reaction plane selected vs do not prove that rises with , that rise is apparent from the reaction-plane-integrated measurement shown in Fig. 13. The (i.e. pathlength) dependence is clear from the increasing in-plane vs out-of-plane difference in vs centrality and the consistent ordering of the curves in Fig. 20.
The brackets and bars on the data in Fig. 22 are the statistical uncertainties of the in-plane and out-of-plane . The shaded (gray) band around 1 corresponds to the systematic uncertainty of the average , while the shaded (blue) boxes at the right end of the =1 lines show the uncertainty on and are of type C. The shaded bands on the data points are the systematic uncertainty of the including the uncertainty from the event-plane resolution. Closed (red) circles and closed (blue) squares are the in-plane and out-of-plane , respectively. Panel (a) shows the data overlaid with the AMY calculation Arnold et al. (2001, 2002). While the out-of-plane data are well described, the in-plane data are not, implying that the path-length dependence is too weak in this model. The comparison with HT in panel (b) shows that this model fails to describe both the general trend and the in-plane vs. out-of-plane differences. The ASW formalism [panel (c)] describes the out-of-plane suppression as well as AMY and shows a somewhat larger in-plane vs. out-of-plane difference, but is still inconsistent with the data. It should be noted that in these three models the energy loss is proportional to , where is the path length in the medium, and the quadratic dependence is characteristic when radiative energy loss is the dominant mechanism.
Finally, in panel (d) the data are compared to a model that invokes strong coupling in the medium via an AdS/CFT-inspired model. The ASW-AdS/CFT formalism Marquet and Renk (2010) incorporates the ASW treatment of hard processes, but for the soft processes assumes strong coupling. Such a hybrid procedure was first suggested in Liu et al. (2006). The virtual gluons radiated into the medium are governed by pQCD, but the interactions of those virtual gluons with the medium to bring them on shell is done by assuming that the transverse-momentum-squared is proportional to as given by an AdS/CFT calculation Marquet and Renk (2010); Dominguez et al. (2008). This is in contrast to the weak-coupling expression for the transverse-momentum-squared, . This results in an energy loss proportional to L3 instead of L2 as in the case of the pQCD-based models. Panel (d) shows that the ASW-AdS/CFT model describes both the general shape and the absolute difference of the in-plane and out-of-plane data well. The observation that models with path-length dependence of energy loss stronger than are in better agreement with the measurements is consistent with the findings in Adare et al. (2010a).
IV Summary and Conclusions
In summary, the large data set presented in this paper made possible a measurement of the invariant yield in = 200 GeV AuAu collisions up to 20 GeV/ transverse momentum. This has led to a precision measurement of the / ratio in AuAu collisions, which is constant as a function of both centrality and , / = 0.450.01(stat)0.04(syst) and consistent with the values observed in Au and . The large observed suppression is fully consistent with earlier findings, and a slow but significant rise of vs with a slope of 0.0106 (GeV/)-1 for central collisions is now observed for the first time at RHIC energies. This has been an expectation of all pQCD-based parton energy loss models. The large data set has also made possible the calculation of a phenomenological energy loss. The differential , testing the path-length dependence of energy loss, is measured up to of 20 GeV/ and is compared to various energy loss calculations. While all models considered describe the -integrated adequately, the pQCD based calculations where the energy loss depends on the path length as fail to describe the differential . The data require an energy loss with a power greater than 2, as given by models in which the soft interactions with the medium are strongly coupled.
These findings are consistent with the conclusions of Adare et al. (2010a) in which data on elliptic flow of high pT ( 6 GeV) s is shown to be inconsistent with pQCD-based models. To explore the strong coupling regime, a comparison was made to the same ASW-AdS/CFT model used in this work, as well as to a phenomenological model Jia and Wei (2010) in which the energy loss was proportional to , both of which were able to fit the data. Both the current measurement and Adare et al. (2010a) explore a region of high pT where the mechanism leading to an azimuthally anisotropic yield is parton energy loss rather than hydrodynamical flow. It is increasingly difficult for purely pQCD-based models to explain these results and one is led to the tentative conclusion that strong coupling plays an important role in parton energy loss in the medium. At present, the best method to do the relevant calculations is in an AdS/CFT framework. Similar conclusions are reached when one looks at the behavior of heavy quarks Adare et al. (2011), where higher quality data will soon be available. Recent preliminary results on the suppression pattern seen at the LHC for p 6 GeV/ are strikingly similar to those seen at RHIC. In this paper, a phenomenological calculation of fractional energy loss is given, which indicates that the energy loss at LHC (ALICE data) is about 30% higher than at RHIC, and that the loss falls slightly with energy. The dependence of these observables on momentum and center-of-mass energy (presumably on energy density) will be a crucial factor in untangling the underlying mechanisms of parton energy loss.
Recently, experiments at the LHC have begun to examine the behavior of fully reconstructed jets, which should give more easily interpretable information on this phenomenon. Future work at both the LHC and at RHIC should bring data on path length dependence of fully reconstructed jets, jet widths, and heavy-quark jets which will add a wealth of new information. In addition, a more complete understanding of the initial state is also needed both for the initial configuration of hydrodynamical models, and as a calibration of the hard probes that are used in these measurements.
ACKNOWLEDGMENTS
We thank the staff of the Collider-Accelerator and Physics Departments at Brookhaven National Laboratory and the staff of the other PHENIX participating institutions for their vital contributions. We acknowledge support from the Office of Nuclear Physics in the Office of Science of the Department of Energy, the National Science Foundation, Abilene Christian University Research Council, Research Foundation of SUNY, and Dean of the College of Arts and Sciences, Vanderbilt University (U.S.A), Ministry of Education, Culture, Sports, Science, and Technology and the Japan Society for the Promotion of Science (Japan), Conselho Nacional de Desenvolvimento Científico e Tecnológico and Fundação de Amparo à Pesquisa do Estado de São Paulo (Brazil), Natural Science Foundation of China (P. R. China), Ministry of Education, Youth and Sports (Czech Republic), Centre National de la Recherche Scientifique, Commissariat à l’Énergie Atomique, and Institut National de Physique Nucléaire et de Physique des Particules (France), Bundesministerium für Bildung und Forschung, Deutscher Akademischer Austausch Dienst, and Alexander von Humboldt Stiftung (Germany), Hungarian National Science Fund, OTKA (Hungary), Department of Atomic Energy and Department of Science and Technology (India), Israel Science Foundation (Israel), National Research Foundation and WCU program of the Ministry Education Science and Technology (Korea), Ministry of Education and Science, Russian Academy of Sciences, Federal Agency of Atomic Energy (Russia), VR and Wallenberg Foundation (Sweden), the U.S. Civilian Research and Development Foundation for the Independent States of the Former Soviet Union, the US-Hungarian Fulbright Foundation for Educational Exchange, and the US-Israel Binational Science Foundation.
APPENDIX
Tables 5 and 6 give values for the invariant Yields for neutral pions, as shown in Fig. 5. Tables 7 and 8 give values of for neutral pions, as shown in Fig. 11.
| Cen- | Inv. Yield | Stat. | Fraction | Syst.(B) | Fraction | |
|---|---|---|---|---|---|---|
| trality | error | % | error | % | ||
| 0–5% | 5.25 | 9.394 | 8.7 | 0.92 | 8.4 | 8.9 |
| 5.75 | 4.524 | 5.2 | 1.1 | 4.0 | 8.9 | |
| 6.25 | 2.273 | 3.2 | 1.4 | 2.0 | 8.9 | |
| 6.75 | 1.253 | 2.2 | 1.7 | 1.1 | 8.9 | |
| 7.25 | 6.862 | 1.5 | 2.1 | 6.1 | 8.9 | |
| 7.75 | 4.164 | 1.1 | 2.5 | 3.7 | 8.9 | |
| 8.25 | 2.598 | 7.8 | 3.0 | 2.0 | 7.6 | |
| 8.75 | 1.545 | 5.8 | 3.7 | 1.2 | 7.6 | |
| 9.25 | 1.118 | 4.5 | 4.0 | 8.6 | 7.7 | |
| 9.75 | 7.684 | 3.5 | 4.6 | 6.3 | 8.2 | |
| 11 | 2.837 | 9.6 | 3.4 | 3.1 | 11 | |
| 13 | 8.685 | 4.9 | 5.7 | 1.5 | 18 | |
| 15 | 2.659 | 3.0 | 11 | 6.7 | 25 | |
| 17 | 9.547 | 1.9 | 20 | 3.1 | 33 | |
| 19 | 4.450 | 1.7 | 38 | 1.8 | 41 |
| Cen- | Inv. Yield | Stat. | Fraction | Syst.(B) | Fraction | Cen- | Inv. Yield | Stat. | Fraction | Syst.(B) | Fraction | |||
| trality | error | % | error | % | trality | error | % | error | % | |||||
| 0–10% | 5.25 | 8.969 | 5.6 | 0.63 | 8.0 | 8.9 | 50–60% | 5.25 | 2.147 | 1.8 | 0.84 | 1.9 | 8.9 | |
| 5.75 | 4.309 | 3.4 | 0.79 | 3.8 | 8.9 | 5.75 | 1.007 | 1.2 | 1.1 | 9.0 | 8.9 | |||
| 6.25 | 2.193 | 2.2 | 0.99 | 2.0 | 8.9 | 6.25 | 5.253 | 7.9 | 1.5 | 4.7 | 8.9 | |||
| 6.75 | 1.190 | 1.4 | 1.2 | 1.1 | 8.9 | 6.75 | 2.785 | 5.4 | 1.9 | 2.5 | 8.9 | |||
| 7.25 | 6.738 | 1.0 | 1.5 | 6.0 | 8.9 | 7.25 | 1.535 | 3.9 | 2.5 | 1.4 | 8.9 | |||
| 7.75 | 4.063 | 7.2 | 1.8 | 3.6 | 8.9 | 7.75 | 9.018 | 2.8 | 3.2 | 8.0 | 8.9 | |||
| 8.25 | 2.457 | 5.3 | 2.2 | 1.9 | 7.6 | 8.25 | 5.628 | 2.2 | 3.9 | 4.3 | 7.6 | |||
| 8.75 | 1.551 | 4.0 | 2.6 | 1.2 | 7.6 | 8.75 | 3.352 | 1.6 | 4.9 | 2.6 | 7.6 | |||
| 9.25 | 1.085 | 3.1 | 2.9 | 8.4 | 7.7 | 9.25 | 2.041 | 1.3 | 6.2 | 1.6 | 7.7 | |||
| 9.75 | 6.798 | 2.4 | 3.5 | 5.6 | 8.2 | 9.75 | 1.459 | 1.0 | 6.8 | 1.2 | 8.2 | |||
| 11 | 2.767 | 6.7 | 2.4 | 3.1 | 11 | 11 | 5.270 | 2.8 | 5.3 | 5.8 | 11 | |||
| 13 | 7.651 | 3.3 | 4.3 | 1.4 | 18 | 13 | 1.563 | 1.7 | 11 | 2.8 | 18 | |||
| 15 | 2.603 | 2.0 | 7.9 | 6.6 | 25 | 15 | 4.387 | 7.8 | 18 | 1.1 | 25 | |||
| 17 | 1.031 | 1.4 | 14 | 3.4 | 33 | 17 | 9.288 | 4.2 | 45 | 3.1 | 33 | |||
| 19 | 3.194 | 1.0 | 32 | 1.3 | 41 | 19 | 3.030 | 3.0 | 100 | 1.2 | 41 | |||
| 10–20% | 5.25 | 8.053 | 4.6 | 0.57 | 7.2 | 8.9 | 60–70% | 5.25 | 1.155 | 1.3 | 1.1 | 1.0 | 8.9 | |
| 5.75 | 3.806 | 2.8 | 0.74 | 3.4 | 8.9 | 5.75 | 5.650 | 8.4 | 1.5 | 5.0 | 8.9 | |||
| 6.25 | 1.882 | 1.8 | 0.96 | 1.7 | 8.9 | 6.25 | 2.759 | 5.7 | 2.1 | 2.5 | 8.9 | |||
| 6.75 | 1.031 | 1.2 | 1.2 | 9.2 | 8.9 | 6.75 | 1.587 | 4.0 | 2.6 | 1.4 | 8.9 | |||
| 7.25 | 5.924 | 8.7 | 1.5 | 5.3 | 8.9 | 7.25 | 8.197 | 2.8 | 3.4 | 7.3 | 8.9 | |||
| 7.75 | 3.469 | 6.2 | 1.8 | 3.1 | 8.9 | 7.75 | 4.848 | 2.1 | 4.3 | 4.3 | 8.9 | |||
| 8.25 | 2.161 | 4.7 | 2.2 | 1.7 | 7.6 | 8.25 | 2.964 | 1.6 | 5.2 | 2.3 | 7.6 | |||
| 8.75 | 1.345 | 3.5 | 2.6 | 1.0 | 7.6 | 8.75 | 1.863 | 1.2 | 6.5 | 1.4 | 7.6 | |||
| 9.25 | 8.844 | 2.7 | 3.1 | 6.8 | 7.7 | 9.25 | 1.011 | 9.1 | 9.0 | 7.8 | 7.7 | |||
| 9.75 | 5.838 | 2.1 | 3.6 | 4.8 | 8.2 | 9.75 | 8.904 | 8.1 | 9.1 | 7.3 | 8.2 | |||
| 11 | 2.300 | 5.9 | 2.6 | 2.5 | 11 | 11 | 2.715 | 2.0 | 7.3 | 3.0 | 11 | |||
| 13 | 6.141 | 2.9 | 4.7 | 1.1 | 18 | 13 | 9.210 | 1.1 | 11 | 1.6 | 18 | |||
| 15 | 1.971 | 1.7 | 8.8 | 5.0 | 25 | 15 | 3.129 | 6.5 | 21 | 7.9 | 25 | |||
| 17 | 6.953 | 1.3 | 18 | 2.3 | 33 | 17 | 2.029 | 6.1 | 30 | 6.7 | 33 | |||
| 19 | 2.490 | 8.8 | 35 | 1.0 | 41 | 19 | 3.015 | 3.0 | 100 | 1.2 | 41 | |||
| 20–30% | 5.25 | 6.693 | 3.8 | 0.57 | 6.0 | 8.9 | 70–80% | 5.25 | 5.486 | 8.7 | 1.6 | 4.9 | 8.9 | |
| 5.75 | 3.084 | 2.3 | 0.76 | 2.8 | 8.9 | 5.75 | 2.651 | 5.7 | 2.2 | 2.4 | 8.9 | |||
| 6.25 | 1.563 | 1.5 | 0.98 | 1.4 | 8.9 | 6.25 | 1.330 | 3.9 | 2.9 | 1.2 | 8.9 | |||
| 6.75 | 8.231 | 1.0 | 1.3 | 7.3 | 8.9 | 6.75 | 6.962 | 2.6 | 3.8 | 6.2 | 8.9 | |||
| 7.25 | 4.649 | 7.3 | 1.6 | 4.1 | 8.9 | 7.25 | 4.293 | 2.0 | 4.7 | 3.8 | 8.9 | |||
| 7.75 | 2.797 | 5.4 | 1.9 | 2.5 | 8.9 | 7.75 | 2.404 | 1.5 | 6.4 | 2.1 | 8.9 | |||
| 8.25 | 1.705 | 4.0 | 2.3 | 1.3 | 7.6 | 8.25 | 1.424 | 1.1 | 7.6 | 1.1 | 7.6 | |||
| 8.75 | 1.012 | 3.0 | 2.9 | 7.7 | 7.6 | 8.75 | 9.797 | 8.3 | 8.4 | 7.5 | 7.6 | |||
| 9.25 | 6.519 | 2.3 | 3.5 | 5.0 | 7.7 | 9.25 | 5.629 | 6.6 | 12 | 4.3 | 7.7 | |||
| 9.75 | 4.762 | 1.8 | 3.9 | 3.9 | 8.2 | 9.75 | 4.044 | 5.0 | 12 | 3.3 | 8.2 | |||
| 11 | 1.826 | 5.2 | 2.9 | 2.0 | 11 | 11 | 1.212 | 1.2 | 10 | 1.3 | 11 | |||
| 13 | 5.116 | 2.6 | 5.1 | 9.1 | 18 | 13 | 4.448 | 7.3 | 16 | 7.9 | 18 | |||
| 15 | 1.646 | 1.6 | 9.5 | 4.1 | 25 | 15 | 6.762 | 3.0 | 45 | 1.7 | 25 | |||
| 17 | 3.999 | 8.7 | 22 | 1.3 | 33 | 17 | 3.663 | 2.6 | 71 | 1.2 | 33 | |||
| 19 | 2.166 | 8.2 | 38 | 8.8 | 41 | 19 | — | — | — | — | — | |||
| 30–40% | 5.25 | 4.960 | 3.0 | 0.61 | 4.4 | 8.9 | 80–93% | 5.25 | 1.748 | 4.3 | 2.5 | 1.6 | 8.9 | |
| 5.75 | 2.294 | 1.9 | 0.83 | 2.0 | 8.9 | 5.75 | 8.505 | 2.8 | 3.3 | 7.6 | 8.9 | |||
| 6.25 | 1.194 | 1.3 | 1.1 | 1.1 | 8.9 | 6.25 | 4.344 | 2.0 | 4.5 | 3.9 | 8.9 | |||
| 6.75 | 6.265 | 8.7 | 1.4 | 5.6 | 8.9 | 6.75 | 2.451 | 1.4 | 5.5 | 2.2 | 8.9 | |||
| 7.25 | 3.449 | 6.1 | 1.8 | 3.1 | 8.9 | 7.25 | 1.460 | 1.0 | 7.0 | 1.3 | 8.9 | |||
| 7.75 | 2.119 | 4.5 | 2.1 | 1.9 | 8.9 | 7.75 | 7.727 | 7.2 | 9.4 | 6.9 | 8.9 | |||
| 8.25 | 1.266 | 3.3 | 2.6 | 9.7 | 7.6 | 8.25 | 4.874 | 5.6 | 12 | 3.7 | 7.6 | |||
| 8.75 | 7.920 | 2.5 | 3.2 | 6.1 | 7.6 | 8.75 | 2.374 | 4.4 | 19 | 1.8 | 7.6 | |||
| 9.25 | 4.733 | 1.9 | 4.0 | 3.7 | 7.7 | 9.25 | 1.599 | 2.8 | 18 | 1.2 | 7.7 | |||
| 9.75 | 3.024 | 1.5 | 4.8 | 2.5 | 8.2 | 9.75 | 8.472 | 2.0 | 24 | 7.0 | 8.2 | |||
| 11 | 1.297 | 4.3 | 3.3 | 1.4 | 11 | 11 | 5.041 | 7.0 | 14 | 5.6 | 11 | |||
| 13 | 3.537 | 2.2 | 6.1 | 6.3 | 18 | 13 | 9.230 | 2.9 | 32 | 1.6 | 18 | |||
| 15 | 1.117 | 1.5 | 13 | 2.8 | 25 | 15 | 1.038 | 1.0 | 100 | 2.6 | 25 | |||
| 17 | 3.195 | 7.7 | 24 | 1.1 | 33 | 17 | 1.407 | 1.4 | 100 | 4.6 | 33 | |||
| 19 | 1.531 | 6.8 | 45 | 6.2 | 41 | 19 | — | — | — | — | — | |||
| 40–50% | 5.25 | 3.395 | 2.3 | 0.69 | 3.0 | 8.9 | 0–93% | 5.25 | 4.038 | 1.0 | 0.26 | 3.6 | 8.9 | |
| 5.75 | 1.612 | 1.5 | 0.93 | 1.4 | 8.9 | 5.75 | 1.880 | 6.3 | 0.33 | 1.7 | 8.9 | |||
| 6.25 | 8.369 | 1.0 | 1.2 | 7.5 | 8.9 | 6.25 | 9.464 | 4.1 | 0.43 | 8.4 | 8.9 | |||
| 6.75 | 4.444 | 7.0 | 1.6 | 4.0 | 8.9 | 6.75 | 5.047 | 2.7 | 0.54 | 4.5 | 8.9 | |||
| 7.25 | 2.397 | 5.0 | 2.1 | 2.1 | 8.9 | 7.25 | 2.821 | 1.9 | 0.68 | 2.5 | 8.9 | |||
| 7.75 | 1.492 | 3.7 | 2.5 | 1.3 | 8.9 | 7.75 | 1.688 | 1.4 | 0.83 | 1.5 | 8.9 | |||
| 8.25 | 8.663 | 2.7 | 3.1 | 6.6 | 7.6 | 8.25 | 1.022 | 1.0 | 1.0 | 7.8 | 7.6 | |||
| 8.75 | 5.578 | 2.1 | 3.7 | 4.3 | 7.6 | 8.75 | 6.311 | 7.8 | 1.2 | 4.8 | 7.6 | |||
| 9.25 | 3.434 | 1.6 | 4.5 | 2.6 | 7.7 | 9.25 | 4.075 | 6.0 | 1.5 | 3.1 | 7.7 | |||
| 9.75 | 2.377 | 1.3 | 5.3 | 2.0 | 8.2 | 9.75 | 2.744 | 4.7 | 1.7 | 2.3 | 8.2 | |||
| 11 | 8.341 | 3.5 | 4.2 | 9.2 | 11 | 11 | 1.073 | 1.3 | 1.2 | 1.2 | 11 | |||
| 13 | 2.352 | 1.8 | 7.7 | 4.2 | 18 | 13 | 2.968 | 6.6 | 2.2 | 5.3 | 18 | |||
| 15 | 4.544 | 2.6 | 56 | 1.1 | 25 | 15 | 9.454 | 4.0 | 4.2 | 2.4 | 25 | |||
| 17 | 2.233 | 6.4 | 29 | 7.3 | 33 | 17 | 3.208 | 2.6 | 8.1 | 1.1 | 33 | |||
| 19 | 1.517 | 6.8 | 45 | 6.2 | 41 | 19 | 1.224 | 2.0 | 16 | 5.0 | 41 |
| Cen- | Stat. | Fraction | Syst.(B) | Fraction | Cen- | Stat. | Fraction | Syst.(B) | Fraction | |||||
|---|---|---|---|---|---|---|---|---|---|---|---|---|---|---|
| trality | error | % | error | % | trality | error | % | error | % | |||||
| 0–10% | 5.25 | 0.1859 | 0.0014 | 0.74 | 0.024 | 13 | 50–60% | 5.25 | 0.6691 | 0.0062 | 0.92 | 0.086 | 13 | |
| 5.75 | 0.1855 | 0.0018 | 0.95 | 0.024 | 13 | 5.75 | 0.6517 | 0.0082 | 1.3 | 0.084 | 13 | |||
| 6.25 | 0.1882 | 0.0023 | 1.2 | 0.024 | 13 | 6.25 | 0.6776 | 0.011 | 1.7 | 0.087 | 13 | |||
| 6.75 | 0.1922 | 0.0029 | 1.5 | 0.025 | 13 | 6.75 | 0.6765 | 0.015 | 2.2 | 0.087 | 13 | |||
| 7.25 | 0.1908 | 0.0036 | 1.9 | 0.025 | 13 | 7.25 | 0.6533 | 0.018 | 2.8 | 0.084 | 13 | |||
| 7.75 | 0.1967 | 0.0045 | 2.3 | 0.025 | 13 | 7.75 | 0.6562 | 0.023 | 3.5 | 0.085 | 13 | |||
| 8.25 | 0.1990 | 0.0056 | 2.8 | 0.024 | 12 | 8.25 | 0.6851 | 0.030 | 4.3 | 0.083 | 12 | |||
| 8.75 | 0.1970 | 0.0066 | 3.4 | 0.024 | 12 | 8.75 | 0.6399 | 0.034 | 5.4 | 0.078 | 12 | |||
| 9.25 | 0.2241 | 0.0089 | 4.0 | 0.028 | 12 | 9.25 | 0.6339 | 0.043 | 6.8 | 0.078 | 12 | |||
| 9.75 | 0.2250 | 0.011 | 4.9 | 0.028 | 13 | 9.75 | 0.7255 | 0.055 | 7.6 | 0.092 | 13 | |||
| 11 | 0.2253 | 0.0077 | 3.4 | 0.034 | 15 | 11 | 0.6448 | 0.038 | 5.9 | 0.096 | 15 | |||
| 13 | 0.2403 | 0.015 | 6.3 | 0.050 | 21 | 13 | 0.7378 | 0.085 | 12 | 0.15 | 21 | |||
| 15 | 0.3244 | 0.037 | 11 | 0.091 | 28 | 15 | 0.8217 | 0.16 | 19 | 0.23 | 28 | |||
| 17 | 0.3763 | 0.072 | 19 | 0.13 | 36 | 17 | 0.5097 | 0.24 | 47 | 0.18 | 36 | |||
| 19 | 0.2639 | 0.10 | 38 | 0.12 | 44 | 19 | 0.3762 | 0.38 | 100 | 0.16 | 44 | |||
| 10-20% | 5.25 | 0.2630 | 0.0018 | 0.69 | 0.034 | 13 | 60-70% | 5.25 | 0.7726 | 0.0091 | 1.2 | 0.099 | 13 | |
| 5.75 | 0.2581 | 0.0023 | 0.91 | 0.033 | 13 | 5.75 | 0.7851 | 0.012 | 1.6 | 0.10 | 13 | |||
| 6.25 | 0.2545 | 0.0030 | 1.2 | 0.033 | 13 | 6.25 | 0.7642 | 0.017 | 2.2 | 0.098 | 13 | |||
| 6.75 | 0.2625 | 0.0040 | 1.5 | 0.034 | 13 | 6.75 | 0.8278 | 0.022 | 2.7 | 0.11 | 13 | |||
| 7.25 | 0.2643 | 0.0050 | 1.9 | 0.034 | 13 | 7.25 | 0.7490 | 0.027 | 3.6 | 0.097 | 13 | |||
| 7.75 | 0.2646 | 0.0061 | 2.3 | 0.034 | 13 | 7.75 | 0.7576 | 0.034 | 4.5 | 0.098 | 13 | |||
| 8.25 | 0.2757 | 0.0078 | 2.8 | 0.034 | 12 | 8.25 | 0.7747 | 0.043 | 5.5 | 0.094 | 12 | |||
| 8.75 | 0.2691 | 0.0091 | 3.4 | 0.033 | 12 | 8.75 | 0.7636 | 0.053 | 6.9 | 0.093 | 12 | |||
| 9.25 | 0.2879 | 0.012 | 4.1 | 0.035 | 12 | 9.25 | 0.6745 | 0.064 | 9.4 | 0.083 | 12 | |||
| 9.75 | 0.3043 | 0.015 | 5.0 | 0.038 | 13 | 9.75 | 0.9509 | 0.092 | 9.7 | 0.12 | 13 | |||
| 11 | 0.2950 | 0.010 | 3.5 | 0.044 | 15 | 11 | 0.7135 | 0.055 | 7.7 | 0.11 | 15 | |||
| 13 | 0.3038 | 0.020 | 6.6 | 0.063 | 21 | 13 | 0.9334 | 0.12 | 12 | 0.19 | 21 | |||
| 15 | 0.3870 | 0.046 | 12 | 0.11 | 28 | 15 | 1.259 | 0.28 | 22 | 0.35 | 28 | |||
| 17 | 0.4000 | 0.089 | 22 | 0.14 | 36 | 17 | 2.391 | 0.79 | 33 | 0.85 | 36 | |||
| 19 | 0.3240 | 0.13 | 41 | 0.14 | 44 | 19 | 0.8040 | 0.82 | 100 | 0.35 | 44 | |||
| 20–30% | 5.25 | 0.3528 | 0.0024 | 0.69 | 0.045 | 13 | 70–80% | 5.25 | 0.8701 | 0.014 | 1.6 | 0.11 | 13 | |
| 5.75 | 0.3377 | 0.0031 | 0.92 | 0.043 | 13 | 5.75 | 0.8731 | 0.019 | 2.2 | 0.11 | 13 | |||
| 6.25 | 0.3412 | 0.0041 | 1.2 | 0.044 | 13 | 6.25 | 0.8736 | 0.026 | 3.0 | 0.11 | 13 | |||
| 6.75 | 0.3382 | 0.0053 | 1.6 | 0.044 | 13 | 6.75 | 0.8608 | 0.034 | 3.9 | 0.11 | 13 | |||
| 7.25 | 0.3347 | 0.0065 | 2.0 | 0.043 | 13 | 7.25 | 0.9298 | 0.045 | 4.9 | 0.12 | 13 | |||
| 7.75 | 0.3444 | 0.0083 | 2.4 | 0.045 | 13 | 7.75 | 0.8904 | 0.059 | 6.6 | 0.12 | 13 | |||
| 8.25 | 0.3511 | 0.010 | 3.0 | 0.043 | 12 | 8.25 | 0.8823 | 0.069 | 7.8 | 0.11 | 12 | |||
| 8.75 | 0.3268 | 0.012 | 3.6 | 0.040 | 12 | 8.75 | 0.9520 | 0.083 | 8.7 | 0.12 | 12 | |||
| 9.25 | 0.3425 | 0.015 | 4.4 | 0.042 | 12 | 9.25 | 0.8898 | 0.11 | 12 | 0.11 | 12 | |||
| 9.75 | 0.4006 | 0.021 | 5.1 | 0.051 | 13 | 9.75 | 1.024 | 0.13 | 13 | 0.13 | 13 | |||
| 11 | 0.3779 | 0.014 | 3.7 | 0.057 | 15 | 11 | 0.7552 | 0.079 | 10 | 0.11 | 15 | |||
| 13 | 0.4085 | 0.028 | 6.9 | 0.085 | 21 | 13 | 1.069 | 0.18 | 17 | 0.22 | 21 | |||
| 15 | 0.5216 | 0.065 | 12 | 0.15 | 28 | 15 | 0.6448 | 0.29 | 45 | 0.18 | 28 | |||
| 17 | 0.3713 | 0.095 | 26 | 0.13 | 36 | 17 | 1.023 | 0.74 | 72 | 0.37 | 36 | |||
| 19 | 0.4550 | 0.20 | 43 | 0.20 | 44 | 19 | — | — | — | — | — | |||
| 30–40% | 5.25 | 0.4408 | 0.0032 | 0.72 | 0.056 | 13 | 80–93% | 5.25 | 0.8298 | 0.021 | 2.5 | 0.11 | 13 | |
| 5.75 | 0.4234 | 0.0041 | 0.98 | 0.054 | 13 | 5.75 | 0.8385 | 0.028 | 3.4 | 0.11 | 13 | |||
| 6.25 | 0.4394 | 0.0056 | 1.3 | 0.056 | 13 | 6.25 | 0.8537 | 0.039 | 4.6 | 0.11 | 13 | |||
| 6.75 | 0.4341 | 0.0072 | 1.7 | 0.056 | 13 | 6.75 | 0.9070 | 0.051 | 5.6 | 0.12 | 13 | |||
| 7.25 | 0.4186 | 0.0089 | 2.1 | 0.054 | 13 | 7.25 | 0.9464 | 0.067 | 7.1 | 0.12 | 13 | |||
| 7.75 | 0.4398 | 0.011 | 2.6 | 0.057 | 13 | 7.75 | 0.8566 | 0.081 | 9.5 | 0.11 | 13 | |||
| 8.25 | 0.4397 | 0.014 | 3.2 | 0.053 | 12 | 8.25 | 0.9038 | 0.11 | 12 | 0.11 | 12 | |||
| 8.75 | 0.4313 | 0.017 | 3.9 | 0.053 | 12 | 8.75 | 0.6904 | 0.13 | 19 | 0.084 | 12 | |||
| 9.25 | 0.4193 | 0.020 | 4.9 | 0.052 | 12 | 9.25 | 0.7566 | 0.14 | 18 | 0.093 | 12 | |||
| 9.75 | 0.4291 | 0.025 | 5.9 | 0.054 | 13 | 9.75 | 0.6419 | 0.15 | 24 | 0.081 | 13 | |||
| 11 | 0.4526 | 0.019 | 4.1 | 0.068 | 15 | 11 | 0.9396 | 0.13 | 14 | 0.14 | 15 | |||
| 13 | 0.4762 | 0.036 | 7.6 | 0.099 | 21 | 13 | 0.6637 | 0.21 | 32 | 0.14 | 21 | |||
| 15 | 0.5969 | 0.092 | 15 | 0.17 | 28 | 15 | 0.2963 | 0.30 | 100 | 0.083 | 28 | |||
| 17 | 0.5002 | 0.14 | 28 | 0.18 | 36 | 17 | 1.176 | 1.2 | 100 | 0.42 | 36 | |||
| 19 | 0.5423 | 0.27 | 49 | 0.24 | 44 | 19 | — | — | — | — | — | |||
| 40–50% | 5.25 | 0.5422 | 0.0043 | 0.79 | 0.069 | 13 | 0–93% | 5.25 | 0.3105 | 0.0014 | 0.46 | 0.040 | 13 | |
| 5.75 | 0.5346 | 0.0057 | 1.1 | 0.069 | 13 | 5.75 | 0.3002 | 0.0019 | 0.62 | 0.038 | 13 | |||
| 6.25 | 0.5532 | 0.0078 | 1.4 | 0.071 | 13 | 6.25 | 0.3013 | 0.0025 | 0.82 | 0.039 | 13 | |||
| 6.75 | 0.5531 | 0.010 | 1.8 | 0.071 | 13 | 6.75 | 0.3025 | 0.0032 | 1.1 | 0.039 | 13 | |||
| 7.25 | 0.5227 | 0.012 | 2.4 | 0.067 | 13 | 7.25 | 0.2962 | 0.0040 | 1.4 | 0.038 | 13 | |||
| 7.75 | 0.5562 | 0.016 | 2.9 | 0.072 | 13 | 7.75 | 0.3031 | 0.0051 | 1.7 | 0.039 | 13 | |||
| 8.25 | 0.5404 | 0.020 | 3.6 | 0.066 | 12 | 8.25 | 0.3070 | 0.0064 | 2.1 | 0.037 | 12 | |||
| 8.75 | 0.5457 | 0.024 | 4.3 | 0.067 | 12 | 8.75 | 0.2973 | 0.0074 | 2.5 | 0.036 | 12 | |||
| 9.25 | 0.5466 | 0.029 | 5.3 | 0.067 | 12 | 9.25 | 0.3123 | 0.0096 | 3.1 | 0.038 | 12 | |||
| 9.75 | 0.6059 | 0.038 | 6.3 | 0.077 | 13 | 9.75 | 0.3368 | 0.013 | 3.8 | 0.043 | 13 | |||
| 11 | 0.5231 | 0.025 | 4.8 | 0.078 | 15 | 11 | 0.3240 | 0.0088 | 2.7 | 0.048 | 15 | |||
| 13 | 0.5690 | 0.051 | 9.0 | 0.12 | 21 | 13 | 0.3458 | 0.018 | 5.1 | 0.072 | 21 | |||
| 15 | 0.4362 | 0.25 | 57 | 0.12 | 28 | 15 | 0.4370 | 0.040 | 9.2 | 0.12 | 28 | |||
| 17 | 0.6280 | 0.20 | 32 | 0.22 | 36 | 17 | 0.4344 | 0.067 | 16 | 0.16 | 36 | |||
| 19 | 0.9655 | 0.48 | 49 | 0.42 | 44 | 19 | 0.3750 | 0.10 | 27 | 0.16 | 44 |
| Cen- | Stat. | Fraction | Syst.(B) | Fraction | ||
|---|---|---|---|---|---|---|
| trality | error | % | error | % | ||
| 0–5% | 5.25 | 0.1753 | 0.0018 | 1.0 | 0.022 | 13 |
| 5.75 | 0.1753 | 0.0022 | 1.3 | 0.022 | 13 | |
| 6.25 | 0.1756 | 0.0028 | 1.6 | 0.023 | 13 | |
| 6.75 | 0.1823 | 0.0036 | 2.0 | 0.023 | 13 | |
| 7.25 | 0.1749 | 0.0043 | 2.4 | 0.023 | 13 | |
| 7.75 | 0.1815 | 0.0053 | 2.9 | 0.023 | 13 | |
| 8.25 | 0.1894 | 0.0067 | 3.5 | 0.023 | 12 | |
| 8.75 | 0.1766 | 0.0076 | 4.3 | 0.022 | 12 | |
| 9.25 | 0.2080 | 0.010 | 4.8 | 0.026 | 12 | |
| 9.75 | 0.2288 | 0.013 | 5.7 | 0.029 | 13 | |
| 11 | 0.2079 | 0.0087 | 4.2 | 0.031 | 15 | |
| 13 | 0.2455 | 0.018 | 7.3 | 0.051 | 21 | |
| 15 | 0.2982 | 0.042 | 14 | 0.083 | 28 | |
| 17 | 0.3137 | 0.076 | 24 | 0.11 | 36 | |
| 19 | 0.3308 | 0.14 | 43 | 0.14 | 44 |
References
- Adcox et al. (2001) K. Adcox et al. (PHENIX Collaboration), Phys. Rev. Lett. 88, 022301 (2001).
- Adler et al. (2003a) S. S. Adler et al. (PHENIX Collaboration), Phys. Rev. Lett. 91, 072301 (2003a).
- Adams et al. (2003) J. Adams et al. (STAR Collaboration), Phys. Rev. Lett. 91, 172302 (2003).
- Adler et al. (2003b) S. S. Adler et al. (PHENIX Collaboration), Phys. Rev. Lett. 91, 072303 (2003b).
- (5) J. D. Bjorken, fermilab-Pub-82/59-THY (1982).
- Wang and Gyulassy (1992) X.-N. Wang and M. Gyulassy, Phys. Rev. Lett. 68, 1480 (1992).
- Baier et al. (2000) R. Baier, D. Schiff, and B. G. B.G. Zakharov, Ann. Rev. Nucl. Part. Sci. 50, 37 (2000).
- (8) N. Armesto et al., arXiv:1106.1106 (2011).
- Arnold et al. (2001) P. Arnold, G. D. Moore, and L. G. Yaffe, JHEP 0111, 057 (2001).
- Wang and Guo (2001) X.-N. Wang and X. Guo, Nucl. Phys. A 696, 788 (2001).
- Salgado and Wiedemann (2003) C. A. Salgado and U. A. Wiedemann, Phys. Rev. D 68, 014008 (2003).
- Marquet and Renk (2010) C. Marquet and T. Renk, Phys. Lett. B 685, 270 (2010).
- Adare et al. (2009) A. Adare et al. (PHENIX Collaboration), Phys. Rev. C 80, 024908 (2009).
- Adler et al. (2007) S. S. Adler et al. (PHENIX Collaboration), Phys. Rev. C 76, 034904 (2007).
- Afanasiev et al. (2009a) S. Afanasiev et al. (PHENIX Collaboration), Phys. Rev. C 80, 054907 (2009a).
- Adare et al. (2010a) A. Adare et al. (PHENIX Collaboration), Phys. Rev. Lett. 105, 142301 (2010a).
- Adare et al. (2008a) A. Adare et al. (PHENIX Collaboration), Phys. Rev. Lett. 101, 232301 (2008a).
- Richardson et al. (2011) E. Richardson et al. (PHENIX Collaboration), Nucl. Instrum. Meth. A 636, 99 (2011).
- Adcox et al. (2003) K. Adcox et al. (PHENIX Collaboration), Nucl. Instrum. Meth. A 499, 469 (2003).
- Glauber (1958) R. J. Glauber, Lectures in theoretical physics, ed. W. E. Brittin (Interscience Publishers, New York, 1958).
- Miller et al. (2007) M. N. Miller, K. Reygers, J. Sanders, and P. Steinberg, Annu. Rev. Nucl. Part. Sci. 57, 205 (2007).
- Alver et al. (2007) B. Alver et al. (PHOBOS Collaboration), Phys. Rev. Lett. 98, 242302 (2007).
- Afanasiev et al. (2009b) S. Afanasiev et al. (PHENIX Collaboration), Phys. Rev. C 80, 024909 (2009b).
- Adare et al. (2012a) A. Adare et al. (PHENIX Collaboration), Phys. Rev. Lett. 109, 122302 (2012a).
- Chiu (2007) M. Chiu (PHENIX Collaboration), AIP Conf. Proc. 915, 539 (2007).
- Kazantsev (2007) A. Kazantsev (PHENIX Collaboration), AIP Conf. Proc. 351, 539 (2007).
- Aphecetche et al. (2003) L. Aphecetche et al. (PHENIX Collaboration), Nucl. Instrum. Meth. A 499, 521 (2003).
- GEANT 3.2.1 (1993) GEANT 3.2.1, GEANT 3.2.1, CERN Program Library (1993), http://wwwasdoc.web.cern.ch/wwwasdoc/pdfdir/geant.pdf.
- Adare et al. (2007) A. Adare et al. (PHENIX Collaboration), Phys. Rev. D 76, 051106 (2007).
- Adare et al. (2008b) A. Adare et al. (PHENIX Collaboration), Phys. Rev. C 77, 064907 (2008b).
- Adare et al. (2010b) A. Adare et al. (PHENIX Collaboration), Phys. Rev. C 82, 011902 (2010b).
- Adler et al. (2006) S. S. Adler et al. (PHENIX Collaboration), Phys. Rev. Lett. 96, 202301 (2006).
- Sjostrand et al. (2001) T. Sjostrand et al., Comput. Phys. Commun. 135, 238 (2001).
- Aidala et al. (2011) C. A. Aidala, F. Ellinghaus, R. Sassot, J. P. Seele, and M. Stratmann, Phys. Rev. D. 83, 034002 (2011).
- Adare et al. (2012b) A. Adare et al. (PHENIX Collaboration), Phys. Rev. C 85, 064914 (2012b).
- Afanasiev et al. (2007) S. Afanasiev et al. (PHENIX Collaboration), Phys. Rev. Lett. 99, 052301 (2007).
- Bass et al. (2009) S. Bass et al., Phys. Rev. C 79, 024901 (2009).
- Aamodt et al. (2011) K. Aamodt et al. (ALICE Collaboration), Phys. Lett. B 696, 30 (2011).
- (39) W. A. Horowitz and M. Gyulassy, arXiv:1104.4958 (2011).
- Abelev et al. (2010) B. Abelev et al. (ALICE Collaboration), Phys. Rev. Lett. 105, 252301 (2010).
- (41) H. Appelshauser (ALICE Collaboration), arXiv:1110.0638 (2011).
- (42) A. Majumder and C. Shen, arXiv:1103.0809 (2011).
- Arnold et al. (2002) P. Arnold, G. D. Moore, and L. G. Yaffe, JHEP 0206, 030 (2002).
- Qiu and Sterman (1991) J. Qiu and G. Sterman, Nucl. Phys. B 353, 105 (1991).
- Baier et al. (1997) R. Baier, Y. L. Dokshitzer, A. H. Mueller, S. Peigne, and D. Schiff, Nucl. Phys. B 483, 291 (1997).
- Zakharov (1997) B. Zakharov, JETP Lett. 65, 615 (1997).
- Majumder et al. (2009) A. Majumder, B. Muller, and S. Mrowczynski, Phys. Rev. D 80, 125020 (2009).
- Liu et al. (2006) H. Liu, K. Rajagopal, and U. A. Wiedemann, Phys. Rev. Lett. 97, 182301 (2006).
- Dominguez et al. (2008) F. Dominguez, C. Marquet, A. Mueller, B. Wu, and B.-W. Xiao, Nucl. Phys. A 811, 197 (2008).
- Jia and Wei (2010) J. Jia and R. Wei, Phys. Rev. C 82, 024902 (2010).
- Adare et al. (2011) A. Adare et al. (PHENIX Collaboration), Phys. Rev. C 84, 044905 (2011).