Radially Extended Kinematics in the S0 Galaxy NGC 2768 from Planetary Nebulae, Globular Clusters and Starlight
Abstract
There are only a few tracers available to probe the kinematics of individual early-type galaxies beyond one effective radius. Here we directly compare a sample of planetary nebulae (PNe), globular clusters (GCs) and galaxy starlight velocities out to 4 effective radii, in the S0 galaxy NGC 2768. Using a bulge-to-disk decomposition of a K-band image we assign PNe and starlight to either the disk or the bulge. We show that the bulge PNe and bulge starlight follow the same radial density distribution as the red subpopulation of GCs, whereas the disk PNe and disk starlight are distinct components. We find good kinematic agreement between the three tracers to several effective radii (and with stellar data in the inner regions). Further support for the distinct nature of the two galaxy components come from our kinematic analysis. After separating the tracers into bulge and disk components we find the bulge to be a slowly rotating pressure-supported system, whereas the disk reveals a rapidly rising rotation curve with a declining velocity dispersion profile. The resulting Vrot/ ratio for the disk resembles that of a spiral galaxy and hints at an origin for NGC 2768 as a transformed late-type galaxy. A two-component kinematic analysis for a sample of S0s will help to elucidate the nature of this class of galaxy.
keywords:
globular clusters – planetary nebulae – galaxies: individual (NGC 2768)1 Introduction
Based on studies of the morphology-density relation in clusters (Dressler 1980) and groups (Wilman et al. 2009), it has been suggested that lenticular (S0) galaxies may be the descendants of spirals that have undergone some evolutionary process (e.g. ram pressure stripping, galaxy harrassment, gas starvation and/or mergers). Recent investigations of S0s have studied their metallicity gradients (Bedregal et al. 2011), Tully-Fisher relation (Bedregal, Aragon-Salamanca & Merrifield 2006) and stellar populations (Aragon-Salamanca, Bedregal & Merrifield 2006). However, the origin of S0s is still a subject of much debate (e.g. Kormendy & Bender 2012). The internal kinematics of galaxies are a key tool to understanding their structure and formation histories, and S0s are no exception. For example, the kinematics will be largely unaffected if S0s were formerly spirals that have been simply stripped of gas or if they were involved in a relatively minor merger.
Although half of the stellar mass within a galaxy lies within one effective radius (Re), more than 90% of the total mass and angular momentum does not (Romanowsky & Fall 2012). Thus in order to examine the internal kinematics and total mass of early-type galaxies one must probe well beyond 1 Re. elliptical and S0 (early-type) galaxies often lack the significant quantities of extended HI gas commonly found in spirals, so the kinematic tracers are the galaxy starlight itself, planetary nebulae (PNe) and globular clusters (GCs).
Using the underlying starlight of a galaxy to probe its stellar kinematics is perhaps the preferred method, however the surface brightness of a galaxy declines rapidly with increasing radius so it is very difficult to obtain high quality spectra beyond a few effective radii without a large investment of 8m-class telescope time (Coccato et al. 2010) or using deep single pointings (Weijmans et al. 2009). PNe and GCs have the advantage that they are ubiquitous in the halos of early-type galaxies out to large galactocentric radii (5–10 Re). Although there have been several studies of PNe and GC system kinematics in early-type galaxies, very few studies have directly compared them to each other, or to results from galaxy starlight over a common radial range.
Luminous PNe are the end product of low mass stars. However, there is still debate as to whether they arise from normal single-star evolutionary processes or from mass transfer in a binary star system (Ciardullo et al. 2005) In the former case, the PNe observed in early-type galaxies would have an age of 1.5 Gyr, and in the latter case they could be as old as 10 Gyr. Coccato et al. (2009) showed that the radial surface density of PNe follows the galaxy starlight in early-type galaxies and that they are useful probes of galaxy kinematics. However, ellipticals with embedded thick disks and S0 galaxies may contain two subpopulations of PNe, one associated with the disk and one with the bulge, as seen for spiral galaxies (Nolthenius & Ford 1987; Hurley-Keller et al. 2004). Not accounting for the different kinematics of these distinct PNe subpopulations could lead to misleading results as illustrated recently by Cortesi et al. (2011) for the lenticular galaxy NGC 1023. Furthermore, Dekel et al. (2005) suggested that an intermediate-aged population of PNe may have ‘contaminated’ the PNe velocity dispersions of some galaxies in the early-type sample of Romanowsky et al. (2003) and hence impacted the resulting mass analysis.
The globular cluster (GC) systems of all large galaxies, irrespective of Hubble type, generally consist of two subpopulations – blue (or metal-poor) and red (or metal-rich). Both of these subpopulations are thought to have ages 10 Gyr and hence trace old stellar populations (for a review of GC system properties see Brodie & Strader 2006). The blue subpopulation is associated with galaxy halos (Forte et al. 2005; Forbes et al. 2012) whereas the red subpopulation has been shown to share many properties with the spheroid/bulge stars of early-type galaxies (Strader et al. 2011; Forbes et al. 2012), including their kinematics (Pota et al. 2012). We note that the association of red GCs with the bulge and not with a thin disk component extends to spiral galaxies, including our own (Minniti 1995; Cote 1999) and the Sombrero (Forbes, Brodie & Larsen 2001).
To better understand the issues discussed above it is important to directly compare different kinematic tracers for the same galaxy. Here we combine starlight, PNe and GC data for an archetype lenticular galaxy NGC 2768 and directly compare these different kinematic tracers in the same galaxy. The galaxy is a nearby, near edge-on S0 (Sandage, Tammann & van den Bergh 1981), although we note that it was originally classified as an E6 in the RC3 catalogue. According to Wikland et al. (1995) is it an isolated galaxy however it has also been classified as part of the Lyon Group of Galaxies (LGG) 167 (Garcia 1993). It reveals ionised gas and a minor axis dust lane (Kim 1989). The central ionised gas and stars are known to have different kinematics (Fried & Illingworth 1994) suggesting an external origin for the gas. NGC 2768 is a rare example of an early-type galaxy with detectable CO emission (Wikland et al. 1995) and the host of a Calcium-rich supernova type Ib (Filippenko & Chornock 2000). The effective radius of the galaxy is 1.06 arcmin (Proctor et al. 2009; Cappellari et al. 2011). For a distance of 21.8 Mpc (Cappellari et al. 2011), this corresponds to 6.7 kpc.
2 Kinematic Tracers
2.1 Galaxy Starlight Data
Using a new technique to extract integrated kinematic information of the underlying galaxy starlight from a multi-slit spectrograph, Proctor et al. (2009) presented 2D stellar kinematics for NGC 2768 out to 3 Re. Here we have carried out a re-analysis of the Proctor et al. galaxy data after re-defining the sky scaling index continuum passbands to avoid any strong spectral features associated with the galaxy, as well as any skylines in order to refine the sky subtraction (see Foster et al. 2009 for more details). The resulting velocity and velocity dispersion profiles are similar to those published in Proctor et al. (2009). The total number of positions with stellar kinematics available are 104 and our full dataset is given in Table 1 of the Appendix.
2.2 Planetary Nebulae (PNe) Data
Velocity data for 315 PNe in NGC 2768 were acquired using the PN.S spectrograph (Douglas et al. 2002) in 2007 and are available at: www.strw.leidenuniv.nl/pns/ Details of the data reduction procedure and analysis can be found in Cortesi et al. (2011, 2012 in prep.). Following Coccato et al. (2009), a uniform magnitude cut has been applied and radial incompleteness tests carried out. Thus each bin of the PNe surface density distribution is complete to a given magnitude and has been statistically corrected for any radial incompleteness. All are spectroscopically confirmed. The PNe data reach out to 5Re.
2.3 Globular Cluster (GC) Data
The radial surface density distribution and velocity data for GCs comes from the imaging and spectroscopy of Pota et al. (2012). Briefly, imaging from HST allows us to model and subtract the galaxy light, and hence detect GCs in the galaxy inner regions with little or no radial incompleteness. The resulting surface density distribution for over 500 GCs is a combination of HST data in the inner regions and Subaru data in the outer regions, with a background level subtracted. Blue and red GCs were separated according to the local minimum of their bimodal colour distribution, i.e. at R–z = 0.56 (Pota et al. 2012).
Follow-up Keck spectroscopy returned 112 kinematically-confirmed blue and red GCs (Pota et al. 2012). The blue GCs, associated with galaxy halos (Forbes et al. 2012), were found not to rotate (Pota et al. 2012). Here we only consider further the 62 GCs from the red subpopulation. For these GCs the mean velocity is 1353 3 kms -1 in excellent agreement with the galaxy systemic velocity of 1353 km s -1 (Cappellari et al. 2011). The red GCs reach out to 4 Re and we henceforth assume they are all associated with the bulge of the galaxy.
| Parameter | Disk | Bulge |
|---|---|---|
| Rd, Re (′) | 0.72 | 0.84 |
| Sersic n | 1 | 4.65 |
| K (mag) | 8.19 | 7.23 |
| b/a | 0.29 | 0.66 |
3 Results and Discussion
3.1 Spatial Distributions
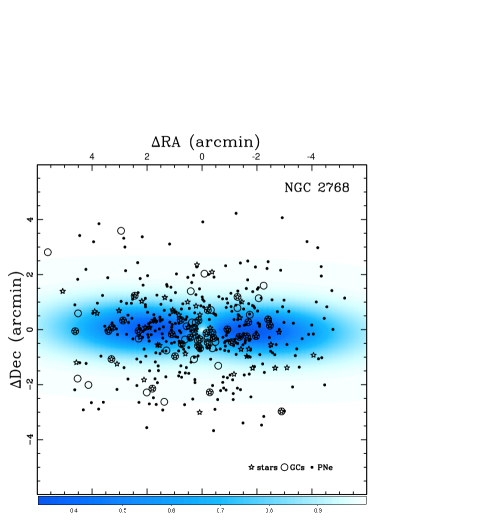
The locations of the 481 starlight, PNe and red GC positions with kinematic data in NGC 2768 are shown in Figure 1. The kinematic data points are well distributed across the surface of the galaxy. In some cases the GC and starlight velocities come from the same position on the sky.
Before examining the kinematic data, we compare the 1D radial distribution of the PNe and red GCs with the galaxy starlight. We use the results of the starlight decomposition into bulge and disk components from Cortesi et al. (2012, in prep.). The general method is to create a model that can be used to assign a probability that a given position is associated with either the disk or bulge component as described in Cortesi et al. (2011). Briefly, it involves a 2D decomposition of a K-band image of NGC 2768 from the 2MASS survey. From this, parameters for the disk and bulge, assuming an exponential and Sersic light profile respectively, are obtained. The resulting major axis scale lengths, Sersic indices, K-band magnitudes and axial ratios are given in Table 1. The 2D disk/bulge probability map is shown in Figure 1.
The bulge has a position angle that is consistent with the major axis of the disk. We also find the bulge and disk to have similar scale sizes. Using a distance of 21.8 Mpc and the K-band magnitudes quoted in Table 1 (assuming a solar value of K = 3.28) we can calculate the luminosity in each component. To calculate masses, we need to assume a mass-to-light ratio that depends on both age and metallicity. The advantage of working in the K-band is that it is relatively insensitive to metallicity and we simply assume solar. In a study of age gradients in S0 galaxies Bedregal et al. (2011) found age gradients to be positive (with disks younger than bulges) or flat. The typical mean age was around 5 Gyr. Although NGC 2768 shows some indication of recent star formation (e.g. a type Ib supernova in 2000), we assume that a mean age of 5 Gyr is more appropriate. The mass-to-light ratio in the K-band for a near solar 5 Gyr population is 0.6 (e.g. Forbes et al. 2008). This gives the mass of the disk to be 3.1 1010 M⊙ and 7.5 1010 M⊙ for the bulge. Thus the bulge-to-total mass ratio is 0.7.
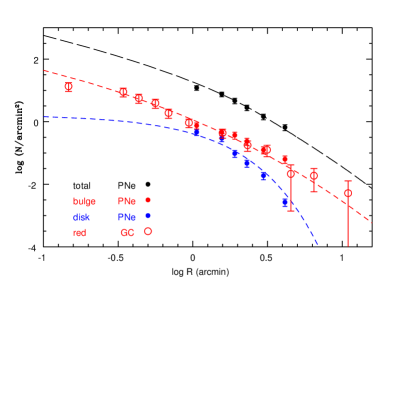
Figure 2 shows the 1D radial surface density distribution of disk and bulge PNe and the red (bulge) GCs with the galaxy starlight profiles. The radial bins, using geometric circular radii, are chosen to have similar numbers of objects in each bin with Poisson errors shown. Our assumption of associating the red GCs with the bulge is supported by the similarity between their surface density profile and that of the bulge starlight.
3.2 Kinematic Profiles
We next explore the radial kinematic (rotation velocity and dispersion) profiles of our three tracers. For the PNe we follow the method of Cortesi et al. (2011) which calculates the disk and bulge kinematics separately in probability-weighted radial bins, with disk/bulge probabilities taken from our spatial analysis. A likelihood clipping is employed to reject data points that are more than 2 from either the disk or the bulge model, leaving 289 PNe data points. The model fits for rotation velocity and velocity dispersion with only the minimal assumption that the line-of-sight velocity distributions for the disk and bulge are drawn from Gaussians.
Conducting a similar disk/bulge analysis on the red GCs revealed that none were assigned to the disk with more than 68% confidence. This, along with our finding that the surface density of the red GCs follows that of the bulge starlight (Figure 2), supports our assumption that the red GCs probe the bulge component only. Thus for the kinematic modelling all of the red GCs are assigned to the bulge.
Unlike our two discrete tracers, the starlight data are integrated quantities for which the rotation velocity and velocity dispersion come directly from the measurements. Ideally, with full wavelength coverage and a high signal-to-noise 2D spectrum we could attempt to decompose the starlight into disk and bulge components (Johnston et al. 2012). However for our data, which are modest signal-to-noise data from a restricted wavelength range around the Ca Triplet lines, we adopt a simpler approach. We assign each starlight position to either the disk or the bulge based on the probability map of Figure 1. The rotation amplitude is fit by an inclined disk model rotating along the major axis using equation 3 from Foster et al. (2011) which fits the rotation velocity and velocity dispersion simultaneously.
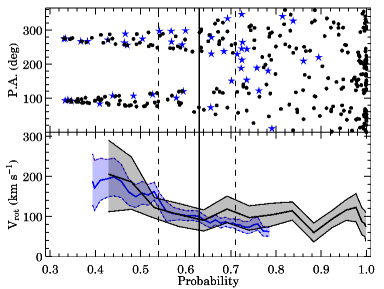
In Figure 3 we show how the starlight and PNe rotation velocity depends on the disk/bulge probability. In both cases the rotation velocity declines smoothly from the disk-dominated regime to the bulge-dominated regime. We note that the velocity dispersion (not shown) does not depend strongly on the disk/bulge probability. The figure also gives the azimuthal dependence on the probability. This shows that low (disk-like) probabilities are exclusively associated with position angles about the major axis (90o and 270o) as expected. For the starlight data we have chosen a probability cut of 63%. This combined with a restriction of velocity errors to be less than 50 km s-1 gives a final sample of 23 disk and 22 bulge-dominated starlight data points. We use these subsamples to calculate the starlight disk and bulge kinematics but recognise that they are still ‘contaminated’ somewhat by the other component. To explore the sensitivity of this cut, and hence the contamination effect, we have varied the probability by 9% either side of our chosen cut. The resulting systematic change in disk and bulge starlight kinematics are included in our errors.
In Figures 4 and 5 we show the disk and bulge kinematic
profiles from our two-component decomposition. Each radial bin is
chosen to have similar numbers in each bin with 289 (disk and
bulge) PNe in 6 radial bins, 122 red (bulge only) GC in 2 bins and 45 (disk
and bulge) starlight data points in 2 bins. As detailed above the
rotation velocity and velocity dispersion in each radial bin are
computed following Cortesi et al. (2011) for the PNe and red GCs,
and Foster et al. (2011) for the starlight data.
For the stellar velocity dispersion we show a continuous profile.
We also include the
inner region stellar kinematic profiles from the SAURON
instrument (Emsellem et al. 2004). For the latter we have simply extracted
profiles about the major and
about the minor axes to
approximate the disk and bulge profiles respectively.
The resulting disk
and bulge data are both plotted
as a function of a generalised radius, i.e.
R = , (1)
where is the semi-major axis, is the semi-minor axis, and q is the axial ratio of 0.46 from 2MASS.
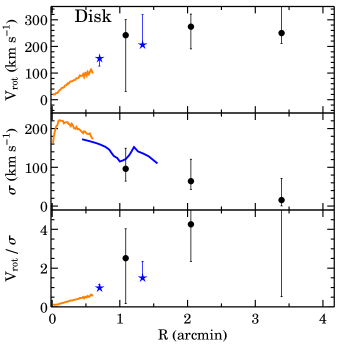
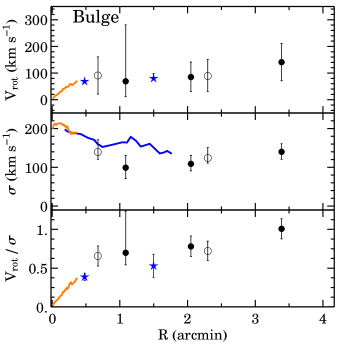
Figures 4 and 5 shows generally good agreement between the PNe kinematics and the kinematics probed by red GCs and direct starlight to large radii for NGC 2768. We also see reasonable consistency in the inner regions with the SAURON stellar kinematic data. We support the earlier work by Cortesi et al. (2011), on the S0 galaxy NGC 1023, finding evidence for distinct populations of disk and bulge PNe.
The disk component reveals a rapid rise reaching a maximum velocity of 270 km s-1 at a few scale lengths. We note that the true circular velocity may be closer to 311 km s-1 given by Davis et al. (2011) from their modelling of molecular gas kinematics which is unaffected by the asymmetric drift that may influence the kinematics derived from stars. Beyond the very inner regions, we find a continuously declining velocity dispersion profile to very low values. In a sample of late-type spiral galaxies, Bottema (1993) found the velocity dispersion to decline exponentially with radius reaching very low values at a few scale lengths. The bulge reveals mild rotation with a near constant velocity of 100 km s-1 and a mean velocity dispersion of 120 km s-1 at large radii.
Figure 4 also shows that Vrot/ for the disk rises continuously with radius. Such a trend suggests that NGC 2768 could be descended from a galaxy with an extended disk. The simulations of Bournaud et al. (2005) showed that such high values of Vrot/ are maintained after a minor merger. Minor mergers may also help to build-up the bulge mass. We note that an isotropic oblate rotator of b/a = 0.66 (see Table 1) would be expected to have Vrot/ 0.7 (Davies et al. 1983), similar to our average value. The bulge of NGC 2768 (Figure 5) resembles a pressure-supported system similar to those seen for the bulges of other spiral galaxies (MacArthur, Gonzalez & Courteau 2009). Thus we find NGC 2768 to have kinematic properties that resemble those of a spiral galaxy (although with a dominant bulge). We note that determining the exact differences and testing the various evolutionary processes suggested for S0 formation would require a detailed analysis beyond the scope of this paper.
4 Conclusions
By combining galaxy starlight, PNe, and red GC data for NGC 2768 we have shown that the red subpopulation of GCs and a subpopulation of PNe follow the same radial surface density profile as the bulge component of the galaxy starlight. An additional distinct, and presumably younger, PNe subpopulation is associated with the galaxy disk.
We have also investigated the radially extended kinematics of these three tracers out to 4Re and show that they are in very good agreement with each other over a large range of radii. Using a 2D probability map generated from a K-band bulge-to-disk decomposition we estimate the bulge-to-total ratio to be 0.7, with both components having a similar scale size. Using this two-component decomposition we examined the kinematics of the bulge and disk separately finding that the disk component reveals rapid rotation and a falling velocity dispersion profile resulting in an increasing Vrot/ ratio with radius. Such a behaviour is similar to that seen in the disks of late-type spiral galaxies. We also found a slowly rotating bulge, indicative of a pressure-supported system.
Although NGC 2768 is an S0 galaxy, many elliptical galaxies contain embedded disks and potentially an associated subpopulation of disk PNe. This work shows that bulge and disk components may need to be taken into account in any kinematic, or mass, analysis of early-type galaxies. This is particularly true when using kinematics to help unravel the origin of S0 galaxies.
Acknowledgments
We thank C. Blom, J. Arnold, L. Spitler for their help with the Keck observations. We thank the referee for several useful comments. CF acknowledges co-funding under the Marie Curie Actions of the European Commission (FP7-COFUND). LC has received funding from the European Community’s Seventh Framework Programme (/FP7/2007-2013/) under grant agreement No 229517. JB. and AR acknowledge support from the NSF through grants AST-0808099, AST-0909237, and AST-1109878.
References
- (1) Aragón-Salamanca A., Bedregal A. G., Merrifield M. R., 2006, A&A, 458, 101
- (2) Bedregal A. G., Aragón-Salamanca A., Merrifield M. R., 2006, MNRAS, 373, 1125
- (3) Bedregal A. G., Cardiel N., Aragón-Salamanca A., Merrifield M. R., 2011, MNRAS, 415, 2063
- (4) Bottema, R., 1993, A&A, 275, 16
- (5) Bournaud F., Jog C. J., Combes F., 2005, A&A, 437, 69
- (6) Brodie J. P., Strader J., 2006, ARA&A, 44, 193
- (7) Cappellari M., et al., 2011, MNRAS, 413, 813
- (8) Ciardullo R., Sigurdsson S., Feldmeier J. J., Jacoby G. H., 2005, ApJ, 629, 499
- (9) Coccato L., et al., 2009, MNRAS, 394, 1249
- (10) Coccato L., Arnaboldi M., Gerhard O., Freeman, K., Ventimiglia, G., Yasuda, N., 2010, A&A, 519, 95
- (11) Cortesi A., et al., 2011, MNRAS, 414, 642
- (12) Côté P., 1999, AJ, 118, 406
- (13) Davies R. L., Efstathiou G., Fall S. M., Illingworth G., Schechter P. L., 1983, ApJ, 266, 41
- (14) Davis, T., et al., 2011, MNRAS, 414, 968
- (15) Dekel A., Stoehr F., Mamon G. A., Cox T. J., Novak G. S., Primack J. R., 2005, Nature, 437, 707
- (16) Douglas N. G., et al., 2002, PASP, 114, 1234
- (17) Dressler A., 1980, ApJ, 236, 351
- (18) Emsellem E., et al., 2004, MNRAS, 352, 721
- (19) Filippenko, A., Chornock, R., IAUC, 7511, 2
- (20) Forbes D. A., Brodie J. P., Larsen, S., 2001, ApJ, 556, L83
- (21) Forbes D. A., Lasky, P., Graham, A., Spitler, L., 2008, MNRAS, 389, 1924
- (22) Forbes D. A., Ponman, T., O‘Sullivan, E., 2012, MNRAS, in press
- (23) Forte J. C., Faifer F., Geisler D., 2005, MNRAS, 357, 56
- (24) Foster C., Proctor R. N., Forbes D. A., Spolaor M., Hopkins P. F., Brodie J. P., 2009, MNRAS, 400, 2135
- (25) Foster C., et al., 2011, MNRAS, 415, 3393
- (26) Fried J. W., Illingworth G. D., 1994, AJ, 107, 992
- (27) Garcia, A., 1993, A&AS, 100, 47
- (28) Hurley-Keller D., Morrison H. L., Harding P., Jacoby G. H., 2004, ApJ, 616, 804
- (29) Johnston, E., Aragon-Salamanca, Merrifield, M., Bedregal, A., 2012, arXiv:1202.6064
- (30) Kim, D. 1989, ApJ, 346, 653
- (31) Kormendy J., Bender R., 2012, ApJS, 198, 2
- (32) MacArthur L. A., González J. J., Courteau S., 2009, MNRAS, 395, 28
- (33) Minniti D., 1995, A&A, 303, 468
- (34) Nolthenius R., Ford H. C., 1987, ApJ, 317, 62
- (35) Pota, V., et al. 2012, MNRAS, submitted
- (36) Proctor R. N., Forbes D. A., Romanowsky A. J., Brodie J. P., Strader J., Spolaor M., Mendel J. T., Spitler L., 2009, MNRAS, 398, 91
- (37) Romanowsky A. J., Douglas N. G., Arnaboldi M., Kuijken K., Merrifield M. R., Napolitano N. R., Capaccioli M., Freeman K. C., 2003, Sci, 301, 1696
- (38) Romanowsky A. J., Fall, M., 2012, ApJS, submitted
- (39) Sandage A., Tammann G. A., van den Bergh S., 1981, JRASC, 75, 267
- (40) Strader J., et al., 2011, ApJS, 197, 33
- (41) Weijmans A.-M., et al., 2009, MNRAS, 398, 561
- (42) Wikland, T., Combes, F., Henkel, C., 1995, A&A, 297, 643
- (43) Wilman D. J., Oemler A., Jr., Mulchaey J. S., McGee S. L., Balogh M. L., Bower R. G., 2009, ApJ, 692, 298
- (44)
| PA | |||||||
| (hh:mm:ss) | (o:’:”) | (arcsec) | (degree) | (km s-1) | (km s-1) | ||
| (1) | (2) | (3) | (4) | (5) | (6) | (7) | (8) |
| Mask Y1 | |||||||
| 09:11:28.703 | 60:02:48.06 | 92.5 | 297 | 1205 11 | 143 18 | 0.080.09 | -0.020.12 |
| 09:11:39.886 | 60:01:37.87 | 81.5 | 153 | 1343 14 | 178 19 | -0.020.06 | 0.020.09 |
| 09:11:20.931 | 60:02:07.85 | 126.4 | 267 | 1148 8 | 126 12 | 0.010.07 | -0.120.13 |
| 09:11:23.223 | 60:02:24.78 | 106.9 | 275 | 1122 7 | 107 18 | 0.070.07 | 0.100.08 |
| 09:11:33.407 | 60:02:16.73 | 29.9 | 273 | 1228 5 | 171 8 | 0.020.02 | 0.010.02 |
| 09:11:25.877 | 60:03:16.79 | 152.8 | 306 | 1209 55 | 110 65 | 0.050.09 | -0.030.13 |
| 09:11:24.979 | 60:01:32.49 | 137.4 | 245 | 1218 15 | 113 20 | 0.060.07 | -0.080.10 |
| 09:11:22.204 | 60:02:08.74 | 116.5 | 267 | 1127 9 | 96 16 | 0.100.08 | 0.050.13 |
| 09:11:28.835 | 60:01:58.20 | 77.1 | 255 | 1217 8 | 142 10 | 0.030.05 | 0.010.05 |
| 09:11:30.367 | 60:02:41.56 | 74.4 | 297 | 1240 7 | 130 11 | -0.020.06 | -0.050.06 |
| 09:11:19.758 | 60:01:45.71 | 152.5 | 257 | 1197 13 | 123 11 | -0.010.05 | -0.060.07 |
| 09:11:21.916 | 60:00:13.79 | 297.6 | 224 | 1306123 | 211117 | 0.010.07 | -0.020.10 |
| 09:11:38.854 | 60:02:07.47 | 19.2 | 125 | 1376 5 | 196 8 | 0.010.01 | -0.020.03 |
| 09:11:36.253 | 60:01:59.28 | 36.3 | 208 | 1309 5 | 180 8 | 0.000.02 | 0.020.02 |
| 09:11:37.409 | 60:01:32.92 | 91.8 | 180 | 1314 22 | 212 26 | -0.120.08 | 0.070.17 |
| 09:11:35.694 | 60:02:12.86 | 14.2 | 260 | 1270 5 | 203 8 | 0.030.01 | 0.010.02 |
| 09:11:19.269 | 60:03:04.43 | 165.7 | 290 | 1152 70 | 65 84 | 0.080.10 | 0.010.16 |
| 09:11:41.096 | 60:01:58.14 | 44.3 | 122 | 1400 5 | 174 8 | -0.040.02 | 0.020.06 |
| 09:11:24.573 | 59 59 56.42 | 324.5 | 215 | 1132 85 | 106 54 | 0.000.06 | -0.030.06 |
| 09:11:34.314 | 60:01:54.53 | 52.3 | 228 | 1274 5 | 155 8 | 0.000.02 | 0.010.03 |
| 09:11:39.822 | 60:02:19.25 | 21.0 | 77 | 1403 5 | 194 8 | -0.020.01 | 0.000.02 |
| 09:11:31.048 | 60:02:31.14 | 56.5 | 289 | 1221 6 | 172 9 | 0.040.04 | 0.050.04 |
| 09:11:36.752 | 60:01:38.21 | 80.9 | 187 | 1329 16 | 184 20 | -0.080.07 | 0.020.12 |
| 09:11:19.078 | 60:01:59.02 | 145.3 | 263 | 1136 13 | 91 28 | 0.170.08 | 0.000.12 |
| 09:12:10.561 | 60:01:39.79 | 254.6 | 98 | 1329144 | 170144 | 0.020.08 | -0.020.12 |
| 09:12:02.699 | 59 59:31.30 | 388.4 | 131 | 1325164 | 228153 | 0.010.11 | 0.000.19 |
| 09:11:59.927 | 60:02:23.17 | 172.0 | 87 | 1560 53 | 131102 | -0.010.10 | 0.050.12 |
| 09:11:59.744 | 60:01:04.39 | 217.6 | 113 | 1481 79 | 164107 | -0.050.06 | -0.010.05 |
| 09:11:57.921 | 60:01:54.50 | 157.0 | 98 | 1500 27 | 149 63 | -0.120.11 | 0.030.12 |
| 09:11:57.142 | 60:02:35.58 | 158.9 | 82 | 1506 45 | 125 86 | -0.090.10 | -0.050.12 |
| 09:11:56.449 | 60:02:48.83 | 166.7 | 77 | 1523 47 | 148 87 | -0.010.12 | -0.070.11 |
| 09:11:53.358 | 60:02:10.14 | 119.7 | 92 | 1523 11 | 127 15 | -0.140.06 | -0.070.12 |
| 09:11:53.195 | 60:01:00.13 | 193.0 | 122 | 1289 41 | 168 65 | -0.010.06 | 0.000.04 |
| 09:11:51.588 | 60:01:40.84 | 124.7 | 108 | 1445 19 | 159 18 | -0.180.05 | -0.090.11 |
| 09:11:50.723 | 60:02:07.76 | 100.2 | 94 | 1500 9 | 141 12 | -0.070.04 | 0.010.09 |
| 09:11:49.342 | 60:01:38.98 | 114.1 | 112 | 1456 15 | 175 16 | -0.110.04 | 0.000.10 |
| 09:11:48.534 | 60:02:05.28 | 84.7 | 97 | 1490 8 | 155 8 | -0.110.03 | -0.060.07 |
| 09:11:48.180 | 60:02:46.95 | 111.1 | 69 | 1460 22 | 141 57 | 0.040.07 | 0.080.08 |
| 09:11:46.500 | 60:01:52.47 | 80.8 | 108 | 1457 7 | 152 8 | -0.050.03 | -0.090.05 |
| 09:11:44.879 | 60:02:19.45 | 57.9 | 86 | 1463 6 | 167 8 | -0.060.02 | -0.040.04 |
| 09:11:17.066 | 60:03:14.92 | 191.6 | 291 | 1131102 | 33114 | 0.030.09 | -0.030.11 |
| 09:11:14.309 | 60:02:18.90 | 173.3 | 271 | 1182 20 | 98 31 | 0.100.07 | -0.030.08 |
| 09:11:13.660 | 60:00:43.19 | 279.7 | 243 | 1163 97 | 92 90 | 0.030.06 | -0.020.12 |
| 09:11:12.873 | 60:02:39.49 | 187.5 | 278 | 1109 40 | 34 60 | 0.020.07 | -0.010.06 |
| 09:11:11.932 | 60:00:52.67 | 273.9 | 247 | 1202 76 | 76 84 | 0.010.07 | -0.040.10 |
| 09:11:11.256 | 60:02:01.23 | 201.8 | 266 | 1200 34 | 80 40 | 0.040.06 | -0.020.07 |
| 09:11:10.340 | 60:01:53.13 | 213.4 | 264 | 1187 55 | 92 56 | 0.030.07 | -0.030.11 |
| 09:11:01.815 | 60:00:38.63 | 354.6 | 250 | 1175116 | 81107 | 0.010.07 | -0.030.12 |
| 09:11:00.672 | 60:01:46.55 | 288.8 | 264 | 1224 93 | 69 84 | -0.010.02 | -0.010.03 |
| 09:12:03.148 | 60:01:07.31 | 232.9 | 109 | 1406 66 | 247 79 | -0.060.07 | -0.050.07 |
| 09:10:56.037 | 60:03:10.99 | 323.9 | 280 | 1194130 | 68117 | 0.010.05 | -0.020.06 |
| Mask Y2 | |||||||
| 09:11:28.703 | 60:02:48.06 | 92.5 | 297 | 1209 38 | 185 48 | 0.000.14 | 0.090.14 |
| 09:11:39.886 | 60:01:37.87 | 81.5 | 153 | 1322 47 | 191 57 | -0.100.12 | 0.100.27 |
| 09:11:20.931 | 60:02:07.85 | 126.4 | 267 | 1140 25 | 110 45 | 0.050.13 | 0.110.12 |
| 09:11:23.223 | 60:02:24.78 | 106.9 | 275 | 1127 25 | 132 45 | 0.080.12 | 0.080.11 |
| 09:11:33.407 | 60:02:16.73 | 29.9 | 273 | 1232 5 | 179 8 | 0.000.04 | 0.000.03 |
| 09:11:25.877 | 60:03:16.79 | 152.8 | 306 | 1217113 | 151117 | 0.050.11 | -0.030.14 |
| PA | |||||||
| (hh:mm:ss) | (o:’:”) | (arcsec) | (degree) | (km s-1) | (km s-1) | ||
| (1) | (2) | (3) | (4) | (5) | (6) | (7) | (8) |
| 09:11:24.979 | 60:01:32.49 | 137.4 | 245 | 1200 98 | 244 743 | -0.150.12 | 0.070.12 |
| 09:11:22.204 | 60:02:08.74 | 116.5 | 267 | 1127 27 | 102 51 | 0.080.14 | 0.080.13 |
| 09:11:28.835 | 60:01:58.20 | 77.1 | 255 | 1216 25 | 171 29 | -0.060.10 | -0.030.09 |
| 09:11:30.367 | 60:02:41.56 | 74.4 | 297 | 1227 19 | 157 23 | 0.010.11 | -0.020.09 |
| 09:11:19.758 | 60:01:45.71 | 152.5 | 257 | 1187 60 | 145 66 | -0.020.10 | -0.040.10 |
| 09:11:38.854 | 60:02:07.47 | 19.2 | 125 | 1378 5 | 210 8 | 0.000.02 | 0.040.05 |
| 09:11:36.253 | 60:01:59.28 | 36.3 | 208 | 1310 6 | 184 9 | -0.030.03 | 0.030.07 |
| 09:11:37.409 | 60:01:32.92 | 91.8 | 180 | 1293144 | 321113 | -0.100.12 | 0.200.19 |
| 09:11:35.694 | 60:02:12.86 | 14.2 | 260 | 1273 5 | 203 8 | 0.010.01 | -0.030.05 |
| 09:11:19.269 | 60:03:04.43 | 165.7 | 290 | 1148143 | 55119 | 0.120.11 | 0.000.14 |
| 09:11:41.096 | 60:01:58.14 | 44.3 | 122 | 1400 8 | 169 15 | -0.050.04 | 0.010.08 |
| 09:11:34.314 | 60:01:54.53 | 52.3 | 228 | 1274 10 | 176 12 | -0.040.06 | 0.040.11 |
| 09:11:39.822 | 60:02:19.25 | 21.0 | 77 | 1404 5 | 190 8 | -0.030.02 | -0.010.03 |
| 09:11:31.048 | 60:02:31.14 | 56.5 | 289 | 1226 13 | 166 15 | 0.030.08 | -0.010.07 |
| 09:11:36.752 | 60:01:38.21 | 80.9 | 187 | 1311 73 | 300 76 | -0.060.10 | 0.190.19 |
| 09:11:19.078 | 60:01:59.02 | 145.3 | 263 | 1149 38 | 82 64 | 0.030.13 | -0.010.14 |
| 09:11:59.927 | 60:02:23.17 | 172.0 | 87 | 1523153 | 96129 | 0.040.11 | -0.090.11 |
| 09:11:59.744 | 60:01:04.39 | 217.6 | 113 | 1346148 | 148117 | -0.010.08 | 0.010.07 |
| 09:11:57.921 | 60:01:54.50 | 157.0 | 98 | 1488 85 | 172118 | -0.140.13 | 0.050.16 |
| 09:11:57.142 | 60:02:35.58 | 158.9 | 82 | 1481 91 | 149144 | 0.100.12 | -0.100.12 |
| 09:11:56.449 | 60:02:48.83 | 166.7 | 77 | 1621160 | 223114 | 0.100.08 | -0.010.09 |
| 09:11:53.358 | 60:02:10.14 | 119.7 | 92 | 1526 34 | 114 69 | -0.120.14 | -0.140.20 |
| 09:11:53.195 | 60:01:00.13 | 193.0 | 122 | 1398125 | 150118 | 0.030.04 | -0.010.03 |
| 09:11:51.588 | 60:01:40.84 | 124.7 | 108 | 1466 34 | 148 58 | -0.120.11 | 0.020.22 |
| 09:11:50.723 | 60:02:07.76 | 100.2 | 94 | 1477 25 | 286 49 | -0.110.10 | 0.250.38 |
| 09:11:49.342 | 60:01:38.98 | 114.1 | 112 | 1437 25 | 160 43 | -0.090.09 | 0.040.16 |
| 09:11:48.534 | 60:02:05.28 | 84.7 | 97 | 1485 20 | 166 36 | -0.120.08 | 0.000.18 |
| 09:11:48.180 | 60:02:46.95 | 111.1 | 69 | 1457 40 | 197 75 | 0.080.10 | 0.070.09 |
| 09:11:46.500 | 60:01:52.47 | 80.8 | 108 | 1465 16 | 155 33 | -0.080.07 | 0.030.15 |
| 09:11:44.879 | 60:02:19.45 | 57.9 | 86 | 1460 9 | 172 18 | -0.050.05 | 0.000.08 |
| 09:11:17.066 | 60:03:14.92 | 191.6 | 291 | 1264126 | 118144 | 0.020.10 | -0.050.12 |
| 09:11:14.309 | 60:02:18.90 | 173.3 | 271 | 1237 82 | 225 76 | 0.110.09 | 0.030.12 |
| 09:11:12.873 | 60:02:39.49 | 187.5 | 278 | 1197128 | 122120 | 0.040.09 | 0.020.11 |
| 09:11:11.256 | 60:02:01.23 | 201.8 | 266 | 1132115 | 28122 | -0.010.04 | -0.010.03 |
| 09:11:10.340 | 60:01:53.13 | 213.4 | 264 | 1215 39 | 123 60 | 0.010.07 | -0.030.07 |
| 09:11:05.861 | 60:02:33.21 | 237.2 | 274 | 1099170 | 135107 | -0.050.08 | 0.010.10 |
| 09:12:35.618 | 59 58:53.58 | 591.3 | 115 | 1382 99 | 38102 | -0.010.03 | -0.020.03 |
| 09:11:06.573 | 60:02:29.59 | 231.4 | 274 | 1173173 | 49136 | 0.030.09 | -0.010.09 |
| 09:10:56.037 | 60:03:10.99 | 323.9 | 280 | 1227163 | 76129 | 0.010.09 | -0.010.10 |
| Mask Z | |||||||
| 09:11:31.966 | 60:01:38.66 | 92.4 | 228 | 1305 11 | 140 15 | 0.150.05 | 0.020.13 |
| 09:11:28.467 | 60:02:51.46 | 98.9 | 298 | 1256 9 | 157 12 | 0.080.05 | -0.010.07 |
| 09:11:35.293 | 60:02:03.77 | 30.6 | 234 | 1290 5 | 181 8 | 0.030.01 | 0.000.03 |
| 09:11:38.698 | 60:02:57.40 | 93.1 | 13 | 1357 14 | 138 26 | -0.020.07 | -0.060.07 |
| 09:11:25.602 | 60:01:31.53 | 135.6 | 244 | 1292 32 | 169 42 | 0.150.11 | -0.030.19 |
| 09:11:32.622 | 60:03:11.46 | 124.3 | 328 | 1301 20 | 148 26 | 0.000.06 | 0.020.06 |
| 09:11:39.464 | 60:01:47.13 | 61.5 | 151 | 1354 5 | 143 8 | -0.020.03 | 0.000.03 |
| 09:11:33.276 | 60:01:18.27 | 130.1 | 208 | 1328 20 | 140 26 | -0.020.06 | -0.070.07 |
| 09:11:37.061 | 60:01:52.67 | 49.2 | 186 | 1336 5 | 154 8 | -0.020.02 | 0.050.08 |
| 09:11:40.642 | 60:02:09.32 | 26.5 | 104 | 1426 5 | 179 8 | -0.020.01 | -0.020.01 |
| 09:11:35.163 | 60:03:04.31 | 106.5 | 341 | 1315 13 | 124 16 | -0.030.06 | -0.080.10 |
| 09:11:30.339 | 60:01:11.08 | 153.4 | 220 | 1310 25 | 140 33 | 0.060.08 | -0.090.17 |
| 09:11:35.188 | 60:02:16.80 | 16.7 | 276 | 1271 5 | 196 8 | 0.020.01 | -0.010.05 |
| 09:11:36.263 | 60:02:33.27 | 39.4 | 335 | 1311 5 | 187 8 | 0.020.01 | 0.020.02 |
| 09:11:36.492 | 60:02:45.93 | 66.5 | 348 | 1318 5 | 153 11 | 0.020.03 | 0.070.06 |
| 09:11:28.833 | 60:01:58.16 | 77.2 | 255 | 1241 8 | 148 8 | 0.040.05 | -0.120.22 |
| 09:11:23.563 | 60:02:23.41 | 104.1 | 275 | 1153 12 | 106 23 | 0.110.12 | -0.020.25 |
| 09:11:51.197 | 60:01:24.50 | 144.5 | 116 | 1459 47 | 186 81 | 0.010.11 | 0.010.08 |
| 09:11:50.773 | 60:02:39.11 | 117.4 | 77 | 1466 36 | 158 62 | -0.050.12 | 0.020.12 |
| 09:11:48.366 | 60:03:22.15 | 173.5 | 51 | 1370131 | 197127 | 0.030.12 | 0.040.11 |
| 09:11:48.434 | 60:06:57.22 | 625.4 | 16 | 1464189 | 461161 | -0.120.11 | 0.010.14 |
| PA | |||||||
|---|---|---|---|---|---|---|---|
| (hh:mm:ss) | (o:’:”) | (arcsec) | (degree) | (km s-1) | (km s-1) | ||
| (1) | (2) | (3) | (4) | (5) | (6) | (7) | (8) |
| 09:11:47.948 | 60:00:43.29 | 208.1 | 139 | 1409165 | 147125 | -0.090.14 | 0.020.13 |
| 09:11:46.978 | 60:03:32.05 | 187.7 | 43 | 1380110 | 139112 | 0.010.13 | -0.020.11 |
| 09:11:41.350 | 59:59:59.26 | 294.0 | 168 | 1351173 | 163112 | -0.020.06 | 0.010.07 |
| 09:11:38.908 | 59:59:13.61 | 393.5 | 176 | 1381220 | 145137 | -0.040.08 | -0.010.08 |
| 09:11:38.953 | 60:04:21.25 | 275.1 | 5 | 1297193 | 166126 | -0.050.08 | -0.010.07 |
| 09:11:34.378 | 60:04:34.25 | 300.8 | 351 | 1300185 | 153131 | -0.010.08 | -0.010.08 |
| 09:11:41.428 | 60:07:25.39 | 677.0 | 6 | 1221211 | 190147 | -0.050.10 | -0.060.10 |
| 09:11:26.564 | 60:12:28.29 | 326.6 | 352 | 1229152 | 108127 | -0.020.07 | -0.030.08 |