The Suppression of Star Formation and the Effect of Galaxy Environment in Low-Redshift Galaxy Groups⋆
Abstract
Understanding the interaction between galaxies and their surroundings is central to building a coherent picture of galaxy evolution. Here we use GALEX imaging of a statistically representative sample of 23 galaxy groups at to explore how local and global group environment affect the UV properties and dust-corrected star formation rates of their member galaxies. The data provide star formation rates out to beyond in all groups, down to a completeness limit and limiting galaxy stellar mass of yr-1 and , respectively. At fixed galaxy stellar mass, we find that the fraction of star-forming group members is suppressed relative to the field out to an average radius of Mpc , mirroring results for massive clusters. For the first time we also report a similar suppression of the specific star formation rate within such galaxies, on average by 40% relative to the field, thus directly revealing the impact of the group environment in quenching star formation within infalling galaxies. At fixed galaxy density and stellar mass, this suppression is stronger in more massive groups, implying that both local and global group environment play a role in quenching. The results favor an average quenching timescale of Gyr and strongly suggest that a combination of tidal interactions and starvation is responsible. Despite their past and ongoing quenching, galaxy groups with more than four members still account for at least % of the total UV output in the nearby universe.
Subject headings:
galaxies: evolution — galaxies: groups: general — galaxies: star formation — ultraviolet: galaxies1. Introduction
Galaxies may evolve from star-forming late-types to passive early-types either via internal, secular processes or through mechanisms induced by their environment. Disentangling these two pathways and understanding the nature and impact of various environmental processes on galaxy evolution is a major goal of contemporary astrophysics. While the overall star formation density of the universe has declined significantly since a redshift of (Madau et al., 1996; Hopkins & Beacom, 2006), this evolution appears to be accelerated in dense environments, with groups and clusters of galaxies containing a lower fraction of star-forming galaxies at fixed stellar mass and redshift than the general field (e.g., Kauffmann et al. 2004; McGee et al. 2011).
Recent work has demonstrated that the effect of secular evolution in quenching star formation, primarily driven by galaxy stellar mass, can be separated from that of the galaxy environment (Peng et al., 2010). The former effect dominates at high galaxy masses, whereas environmental quenching of star formation becomes increasingly important at lower masses. Possible mechanisms for a more rapid quenching of low-mass galaxies in dense environments include tidal interactions, harassment, ram pressure stripping, starvation, and major and minor mergers.
Groups of galaxies are particularly interesting in this respect. Containing around half of all galaxies and most of the stellar mass in the local universe (Eke et al., 2004, 2005), they represent a key environment in the hierarchical build-up of cosmic structure. The galaxy population within groups has evolved significantly since , with the fraction of emission-line galaxies having declined substantially (Wilman et al., 2005). Interestingly, however, the emerging picture is one in which star formation in star-forming galaxies of a given stellar mass is similar in groups and the field, whereas the fraction of such galaxies is not (e.g., Balogh et al. 2004; Baldry et al. 2006; Iovino et al. 2010). For example, Balogh et al. (2004) used inferred H equivalent widths of galaxies within a large sample of low-redshift groups in the Sloan Digital Sky Survey (SDSS) and 2dF Galaxy Redshift Survey (2dFGRS) catalogs to show that the fraction of star-forming galaxies depends systematically on local density, but the actual star formation rate in such galaxies does not. This has recently been shown to apply also at intermediate redshifts, and at fixed stellar mass (McGee et al., 2011), and the result has further been extended to galaxies in both nearby (Haines et al., 2011) and distant (; Muzzin et al. 2012) clusters and superclusters.
This has been interpreted as evidence that the truncation of star formation is accomplished on short timescales, rapidly enough to leave the average star formation properties of star-forming galaxies largely unaffected. This would be true even in groups of fairly low mass, and support for this comes from recent studies based on UV star formation rates in Hickson Compact Groups which are generally relatively sparse systems. Such work has revealed a pronounced deficit of galaxies with moderate specific (i.e., stellar-mass-normalized) star formation rates (Tzanavaris et al., 2010; Walker et al., 2012), consistent with a rapid, environment–driven transition from (perhaps temporarily enhanced) star formation to quiescence. Although the dominant responsible mechanism(s) have yet to be unambiguously identified, it is clear that galaxy–galaxy interactions could play a prominent role both in compact and more typical groups, given the relatively low velocity dispersions characteristic of these environments.
Recognizing that a detailed multi-wavelength characterization of the coupling between global group properties and those of the group members themselves could offer important new insights, we initiated the XI Groups Survey, a study of a statistically representative sample of 25 redshift-selected groups at (Rasmussen et al., 2006b). In this framework, we have previously presented star formation rates (SFRs) from Spitzer/MIPS 24 m data for a subset of nine groups (Bai et al., 2010). Results revealed star-forming galaxy fractions that bridge those of the field and massive clusters, being everywhere higher than those in cluster outskirts but lower than in the field by % on average. The fractions showed no systematic dependence on global group properties such as velocity dispersion or total stellar mass. In addition, and in line with the above previous studies, specific SFRs were generally found to be similar to those in the field.
One limitation of our Spitzer study was the narrowness of the rectangular region (, equivalent to Mpc radius at the sample redshift) covered by our MIPS observations. To fully understand the suppression of star formation in groups requires establishing the star-forming properties of group members out to larger radii, and including galaxies that are encountering the group environment for the first time. For example, simulations (Kawata & Mulchaey, 2008) and isolated observations (Rasmussen et al., 2006a) suggest that gaseous stripping and starvation can suppress star formation in disk galaxies on their first passage through even low-mass groups. In more massive clusters, star formation rates appear suppressed out to (Balogh et al. 1998; here is the radius enclosing a mean overdensity of 200 relative to the critical density). Recent studies have extended this conclusion to even larger radii (Chung et al., 2011), revealing a suppression in the fraction of star-forming galaxies out to Mpc from cluster cores (Lu et al., 2012). However, other works have also shown that star formation can be locally enhanced well outside the cluster virial radius for galaxies within the filaments feeding these structures (Porter & Raychaudhury, 2007; Fadda et al., 2008; Porter et al., 2008; Pereira et al., 2010), with galaxy–galaxy interactions among infalling galaxies providing a possible explanation. Testing the general validity of these results for low-mass groups requires full coverage of the group environment out to the field and infall regions.
Here we extend our previous Spitzer study by presenting GALEX data for most of the full XI sample. Apart from providing improved statistics due to the increased sample size, the GALEX field-of-view of also allows coverage of each group field out to Mpc, corresponding to at least for these systems. This continuous coverage of all regions from the general ”field” through the infall regions to the dense group cores enables a complete census of the star-forming properties of group galaxies, including those only now encountering the group environment.
We assume km s-1 Mpc-1, , and . At the sample median redshift of , corresponds to 69 kpc and the total GALEX field to Mpc diameter. All uncertainties are quoted at the level.
2. Observations and Analysis
2.1. Sample and Optical Observations
Details of the XI sample selection are given in Rasmussen et al. (2006b), but we repeat here that the sample comprises 25 groups selected from systems identified by Merchán & Zandivarez (2002) in the 100-K data release of the 2dFGRS (Colless et al., 2001). Groups with at least five members and having velocity dispersion km s-1 were selected randomly within the redshift range –0.062 to span the full parameter space in , galaxy richness, and estimated virial radii. Barring any inherent biases in the friends-of-friends algorithm used to build the parent group catalog, the sample is intended to be unbiased and truly representative of the low-redshift group population.
An extensive imaging and spectroscopic campaign with the IMACS spectrograph at the 6.5-m Baade/Magellan telescope at Las Campanas has more than doubled the number of spectroscopically identified group members compared to the original Merchán & Zandivarez (2002) catalog. This has enabled highly reliable estimates of velocity dispersion and luminosity centroid for each group. In the present work, we adopt as group centers the location of the brightest group galaxy within a projected distance of 0.5 Mpc of the -band luminosity-weighted center, and with velocity within of the group mean. A forthcoming paper (L. Bai et al., in preparation) will provide the full details and results of our optical spectroscopy and Spitzer 24 m imaging of the full XI sample, along with the individual galaxy redshifts, stellar mass estimates, UV photometric measurements, and SFR estimates used in the present work.
Following the procedure in Bai et al. (2010), we have here complemented our optical spectroscopy within the IMACS field-of-view with redshift measurements from existing catalogs out to from the center of each group. These redshifts come mainly from the 2dFGRS (see Bai et al. 2010 for further details). Galaxies were included in the present study if having recession velocities within of the group mean, as determined from the galaxies within the central Mpc. Some fraction of these objects are likely to represent a population of infalling galaxies that are only now encountering the group environment, and some may represent true “field” galaxies. This allows us to probe the impact of the group environment on the UV properties of galaxies out to well beyond the group virial radii. However, we emphasize that this auxiliary sample is more heterogeneous than the one covered by our IMACS spectroscopy, and that some of these galaxies should be considered candidate rather than bona fide group members. We will comment on the potential impact of this whenever relevant.
A subset of the group members has five-band photometry from the SDSS. For these galaxies, we used the kcorrect package (Blanton & Roweis, 2007), to derive a relation between their –band stellar mass-to-light ratio and their – color. This relation was then used to estimate stellar masses for the full group sample, with a typical uncertainty for individual galaxies of % (cf. Bell et al. 2003). For 17 of the 833 galaxies discussed in this paper (2%), only magnitudes are available, and for these was determined in a similar fashion from their magnitudes alone.
2.2. GALEX Observations and Photometry
Of the 25 groups within the XI sample, 22 were imaged by GALEX in both bands (NUV: 1770–2830 Å; FUV: 1340–1790 Å) as part of GI Cycle 4 (PI: Mulchaey). The median exposure in both bands was 1600 s. One further group (MZ 5383) was covered in the GALEX Medium Imaging Survey to comparable depth. The final two XI groups, MZ 3849 and MZ 9994, suffer from bright stars within the field above the allowed GALEX limit and so are not considered here. In addition, one of the groups, MZ 770, was only partially covered by GALEX, with the group center lying outside the GALEX field-of-view. This group is excluded whenever considering group-wide quantities derived from the GALEX data.
The GALEX exposure times were motivated by the need to match the depth of our IMACS spectroscopy and Spitzer/MIPS data, requiring reliable (signal-to-noise ratio S/N ) UV flux measurements down to in the NUV band, corresponding to a star formation rate of M⊙ yr-1. For each group, the effective NUV and FUV exposure times are identical, except for MZ 5383 which has a significantly longer NUV exposure of 2894 s. Table 1 summarizes the available GALEX observations of the 23 group fields.
| Group | R.A | Decl. | Ext. | ||||||||
|---|---|---|---|---|---|---|---|---|---|---|---|
| (J2000) | (J2000) | (s) | (mag) | (km s-1) | (log ) | ||||||
| (1) | (2) | (3) | (4) | (5) | (6) | (7) | (8) | (9) | (10) | (11) | (12) |
| MZ 770 | 1,245 | 0.14 | 0.0606 | 215 | 11.21 | 15 | 12 | 9 | 2 | ||
| MZ 1766 | 1,658 | 0.11 | 0.0611 | 222 | 11.62 | 15 | 40 | 30 | 10 | ||
| MZ 3067 | 1,333 | 0.18 | 0.0602 | 160 | 11.49 | 16 | 32 | 29 | 8 | ||
| MZ 3182 | 1,563 | 0.15 | 0.0611 | 258 | 11.14 | 8 | 22 | 18 | 5 | ||
| MZ 3541 | 1,586 | 0.30 | 0.0627 | 121 | 11.30 | 11 | 21 | 16 | 10 | ||
| MZ 3698 | 1,600 | 0.31 | 0.0609 | 215 | 11.53 | 14 | 21 | 12 | 7 | ||
| MZ 4001 | 1,593 | 0.27 | 0.0593 | 325 | 11.73 | 36 | 60 | 45 | 15 | ||
| MZ 4548 | 1,565 | 0.25 | 0.0625 | 157 | 10.86 | 12 | 24 | 19 | 7 | ||
| MZ 4577 | 2,609 | 0.44 | 0.0621 | 232 | 11.35 | 20 | 44 | 31 | 9 | ||
| MZ 4592 | 1,656 | 0.51 | 0.0616 | 206 | 11.50 | 18 | 37 | 24 | 10 | ||
| MZ 4881 | 2,885 | 0.19 | 0.0613 | 510 | 12.12 | 34 | 52 | 42 | 21 | ||
| MZ 4940 | 3,171 | 0.37 | 0.0620 | 64 | 11.12 | 8 | 13 | 11 | 5 | ||
| MZ 5293 | 1,666 | 0.33 | 0.0620 | 104 | 11.32 | 9 | 10 | 5 | 4 | ||
| MZ 5383 | 1,186 | 0.30 | 0.0595 | 190 | 11.39 | 17 | 31 | 24 | 3 | ||
| MZ 5388 | 1,670 | 0.33 | 0.0598 | 144 | 11.33 | 14 | 19 | 16 | 8 | ||
| MZ 8816 | 1,564 | 0.14 | 0.0608 | 291 | 11.48 | 25 | 68 | 34 | 16 | ||
| MZ 9014 | 1,750 | 0.11 | 0.0608 | 283 | 11.49 | 24 | 46 | 40 | 6 | ||
| MZ 9069 | 1,584 | 0.13 | 0.0615 | 361 | 11.43 | 29 | 64 | 45 | 14 | ||
| MZ 9137 | 1,596 | 0.19 | 0.0601 | 329 | 11.15 | 13 | 22 | 17 | 6 | ||
| MZ 9307 | 1,704 | 0.10 | 0.0598 | 384 | 11.02 | 20 | 41 | 34 | 2 | ||
| MZ 10167 | 1,599 | 0.14 | 0.0606 | 201 | 11.30 | 20 | 29 | 27 | 11 | ||
| MZ 10300 | 1,624 | 0.15 | 0.0618 | 271 | 11.44 | 29 | 50 | 29 | 8 | ||
| MZ 10451 | 1,607 | 0.14 | 0.0610 | 455 | 11.64 | 40 | 75 | 44 | 18 |
Note. — Column 2+3: GALEX pointing coordinates. Column 4: effective FUV exposure time. Column 5: mean Galactic FUV extinction across the GALEX field. Column 6–8: mean group redshift, velocity dispersion, and total stellar mass of the group members within Mpc of the group center. Column 9: number of group members used to compute , , and . Column 10: total number of spectroscopically identified group member candidates within the GALEX field. Column 11: number of group members within the GALEX field detected in both NUV and FUV bands. Column 12: number of group members within the GALEX field detected at 24 m.
For source identification, the SExtractor–generated source catalog provided by the GALEX pipeline was employed. Only sources detected at S/N in at least one of the two bands were considered for further analysis. The adopted source positions are based on an S/N–weighted average of the NUV and FUV positions. For each group, the UV source catalog was cross-correlated with a list of spectroscopically identified group members, flagging for each member the nearest UV source within a maximum separation of as a match. This separation roughly corresponds to the full-width at half maximum of the NUV point spread function (PSF). Table 1 lists for each group the number of spectroscopic (including candidate) members within the GALEX field, and the subset of those detected in both UV bands and at 24 m. Out of a total of 833 group members within the GALEX fields, 721 (622) are detected in NUV (FUV), and 601 (72%) are detected in both UV bands.
We focus here exclusively on the integrated UV properties of the group galaxies, since the majority of the group members are only slightly, if at all, resolved by GALEX. We adopted NUV and FUV total magnitudes measured within elliptical apertures scaled to 2.5 times the Kron diameter, as provided by the GALEX pipeline on the basis of sky-subtracted and response-corrected images. For resolved sources, these apertures are generally comparable to the aperture obtained from -band photometry (Donas et al., 2007).
All magnitudes were corrected for Galactic extinction using the reddening maps of Schlegel et al. (1998) and the results of Wyder et al. (2005). These corrections range from 0.1–0.5 mag, with a median extinction of 0.15 mag in both bands. Magnitudes were also -corrected, by using the galev stellar evolutionary synthesis code (Kotulla et al., 2009) to construct a grid of galaxy spectral models that cover the region occupied by the group members in FUV–NUV vs. NUV–R color space. The models assumed a Salpeter initial mass function (IMF) along with various star formation histories and levels of intrinsic extinction. For each observed group galaxy, predicted -corrections from the code associated with the nearest match in color space was then applied. With the exception of very red early-types and strongly star-bursting spirals, the corrections are generally mag in both bands for all group members. As mentioned, all UV photometry for individual galaxies will be presented in a forthcoming paper (L. Bai et al., in preparation).
With most of our group members remaining unresolved, we cannot directly estimate the contribution of any active galactic nucleus (AGN) activity to the UV flux. However, the fraction of AGN identifiable on the basis of their optical emission lines or their X-ray properties is small for the XI sample, at the few per cent level (Shen et al., 2007; Bai et al., 2010), so AGN contamination in the UV is generally unlikely to be important. In addition, the dependence of the AGN fraction on global environment is generally inferred to be weak (Arnold et al., 2009), so we do not expect environmental variations in AGN activity to significantly impact our results.
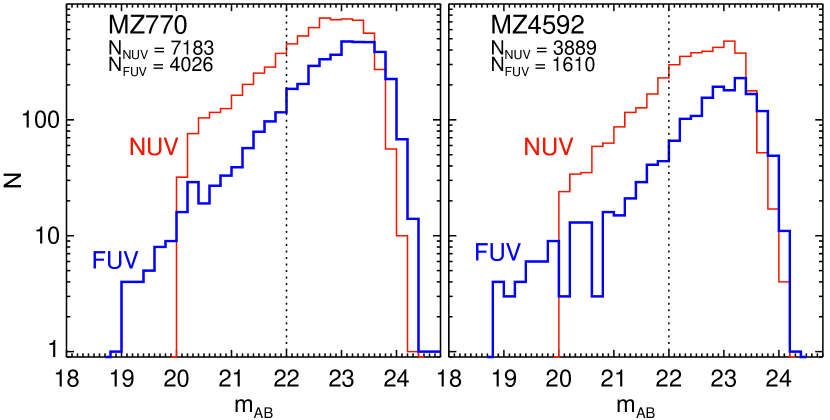
The approximate 100% completeness limit for our GALEX observations in either band can be estimated from the apparent (i.e. not extinction-corrected) magnitude histograms of all sources detected in the field of MZ 770, the group with the shortest identical exposure in FUV and NUV, and MZ 4592, the group field suffering the strongest Galactic extinction (cf. Table 1). As can be seen from Figure 1, incompleteness in the NUV becomes apparent for the MZ 4592 field below . We therefore adopt this value as our sample-wide UV completeness limit in the following. Taking a more conservative limit, e.g., , would result in slightly poorer statistics without affecting any of our conclusions. For comparison, Haines et al. (2011) estimate a 90% FUV completeness limit of for GALEX observations of similar duration and Galactic extinction.
2.3. Dust-corrected UV Star Formation Rates
The UV light from star-forming galaxies is dominated by emission from intermediate-mass stars younger than yr (Kennicutt, 1998). Assuming that the SFR has remained roughly constant over this timescale, it should be proportional to the intrinsic galaxy UV luminosity . Estimates of UV SFRs are model-dependent, however, in part because they need to be corrected for attenuation by dust (potentially by an order of magnitude), and in part because the conversion of the dust-corrected to an SFR depends on the assumed stellar metallicity and IMF, along with the geometry of the distribution of dust and stars.
To estimate these dust corrections, we utilize our existing 24 m photometry wherever possible and follow the approach of Buat et al. (2005) to derive the FUV attenuation as a function of FUV and total infrared luminosity (see Bai et al. 2010), using
| (1) |
where , Hz is the effective frequency of the GALEX FUV band, and is the measured specific FUV luminosity (in erg s-1 Hz-1). Dust-corrected star formation rates were then obtained as (Salim et al., 2007)
| (2) |
where is the dust-corrected specific FUV luminosity. Equation (2) is valid for a Salpeter IMF and a mean stellar metallicity of .
For the galaxies without a Spitzer detection, FUV magnitudes were first corrected according to equation (6) in Salim et al. (2007), based on UV magnitudes of normal (NUV–R) star-forming galaxies:
| (3) |
where = (FUV–NUV) is the rest-frame UV color. The associated dust-corrected SFRs were then compared to those derived on the basis of equation (1) for all galaxies detected at both NUV, FUV, and 24 m. This comparison is shown in Figure 2, as a function of the SFR from FUVIR data [i.e., equations (1) and (2)] and of galaxy stellar mass. Using UV data alone on average tends to overestimate the SFR relative to the result when combining UV and IR data, and this is more prominent for galaxies with low SFR and high (see also, e.g., Iglesias-Páramo et al. 2006; Cortese et al. 2008a).
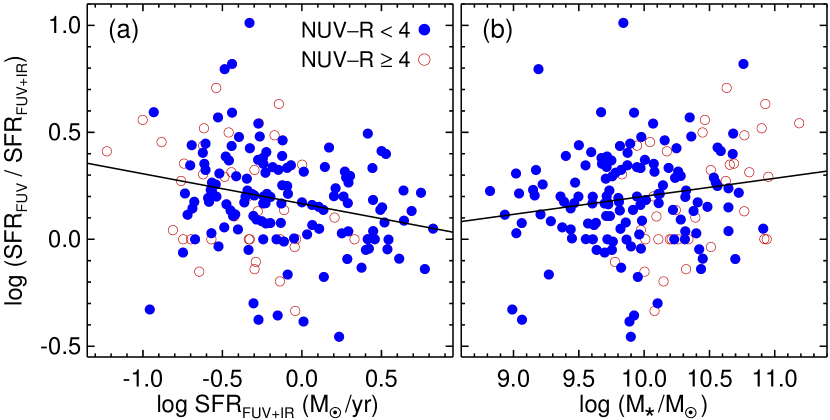
To bring our UV–only estimates into better agreement with those obtained from the combined use of UV and 24 m data, we performed a linear fit to the full data in Figure 2(b), implying
| (4) |
with a mean absolute deviation of 0.18 dex (which is comparable to the typical uncertainty on ). This result, shown as a solid line in the Figure, is consistent with that obtained for the blue galaxies only (NUV–R, for which equation (3) is valid). We use it to correct the inferred SFR for galaxies without a Spitzer detection at a given . As will be discussed in Section 3.3, the resulting SFRs are, on average, in very good agreement with those obtained in other similar studies. For our adopted UV completeness limit and a minimum Galactic extinction of 0.1 mag (cf. Table 1), equation (2) would imply that we are complete to SFR yr-1 in all groups before correction for dust.
2.4. Quantifying Galaxy Environment
The inferred UV and star formation properties of the group members are here presented with a focus on their dependence on galaxy environment, using total group stellar mass and/or velocity dispersion as main indicators of global group environment. One further indicator, discussed below, is obtained by dividing the groups into ones containing UV–optical red and blue central galaxies, respectively.
Local galaxy environment is quantified by projected distance to the adopted group center, optionally normalized by . The latter values were estimated for each group from the radial velocity dispersion and mean redshift using
| (5) |
(Finn et al., 2004). Results range from –1200 kpc (median of 520 kpc), implying that all groups are covered by GALEX to at least .
Another commonly used indicator of local environment is the galaxy surface density , where is the projected distance of each galaxy to its fifth nearest neighbor. This can be reliably used across different systems, provided these are globally broadly similar. However, our groups spans a wide range in richness and estimated , so at fixed 3–D galaxy density , projection effects would act to boost progressively more in the larger systems. To compensate for this, we employ instead an estimate of , derived by normalizing by a characteristic radius for each group. Noting that self-similarity would require , we simply take . All results reported here are qualitatively similar though if plotted against instead of .
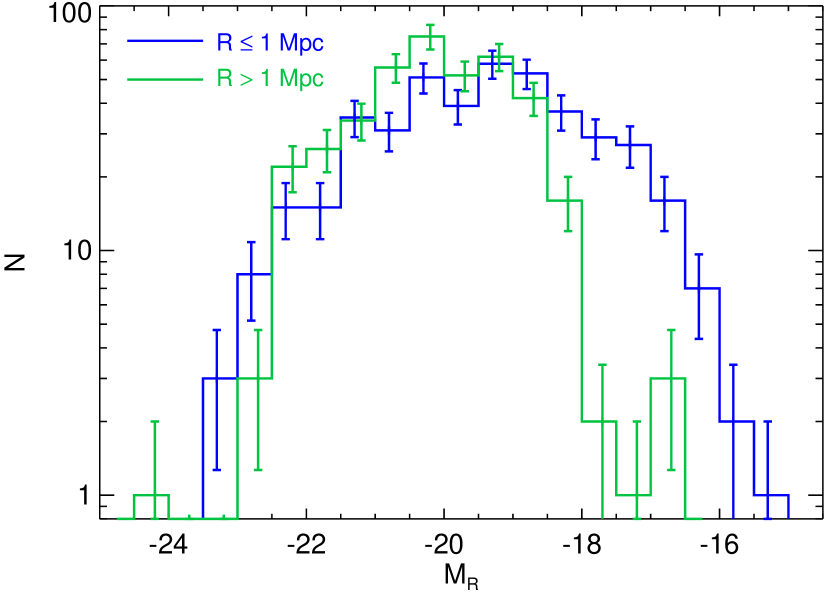
One further issue is our lower spectroscopic completeness outside the Mpc IMACS field-of-view, which could act to systematically bias low at large radii. However, we find no evidence for a break around in the distribution of vs. for all group members. Furthermore, the distributions of for the spectroscopically identified members within and outside the IMACS field are broadly similar down to at least , as shown in Figure 3. We find that all our results are quantitatively similar, and all conclusions unaffected, if computing by only including galaxies brighter than this magnitude. Hence, to fully exploit our extensive IMACS spectroscopy, which extends beyond for all groups and to for % of them, we compute and using all available members.
3. Results
3.1. Galaxy Colors
The UV–optical color, specifically NUV–R, is a useful diagnostic of a galaxy’s recent level of star formation (Salim et al., 2007). A UV–optical color–magnitude diagram for all groups is presented111As is customary, NUV magnitudes have here been corrected for Galactic extinction but not for any intrinsic reddening. in Fig. 4, with each data point color-coded according to its FUV–NUV color. The galaxy sample is seen to split into a dominant population of star-forming blue-cloud members joined by a smaller number of predominantly optically bright red galaxies. Also shown is the region below the NUV sensitivity limit of our data; this assumes a typical NUV limiting sensitivity of after correction for Galactic extinction (cf. Figure 1). This limit prevents the UV detection of optically faint, passive galaxies, so Figure 4 alone may not provide a full picture of the extent of the passive population in these groups. Incompleteness of the UV data will generally be taken into account in the analysis which follows.
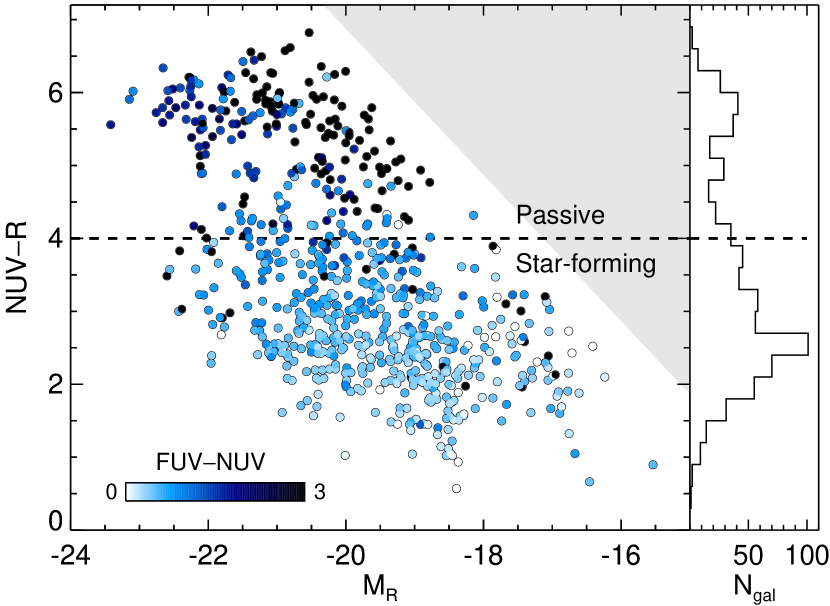
An orthogonal regression fit to the NUV–R color as a function of specific SFR (sSFR = SFR/) shows that a value of NUV–R 4 corresponds to SFR/ yr-1. As will be shown in Section 3.3, considering galaxies above this sSFR cleanly isolates the star-forming population that dominates these groups. In the following, we will therefore use NUV–R 4 to separate ”star-forming” galaxies from ”passive” ones, noting that this is also the limit to which equation (3) remains valid. Using this color cut, Figure 4 confirms that star-forming galaxies are generally relatively FUV bright, as anticipated from equation (2). In contrast, a large fraction of the passive red galaxies have red FUV–NUV colors, with almost half (%) of them remaining undetected in the FUV.
Despite this, we note that bright, central early-type galaxies in massive galaxy clusters can display blue colors and excess UV light beyond that expected from old stars, indicating ongoing star formation (Mahajan & Raychaudhury, 2009; Donahue et al., 2010; Hicks et al., 2010). This could potentially be induced by cooling of the intracluster medium onto the massive galaxy at the center of the cluster potential. As such, the color of the central group galaxy might provide another indicator of the global nature of the host environment. To examine this, Figure 5 shows the distribution of NUV–R colors for the 22 central galaxies covered by GALEX, illustrating that the majority (16) are clearly ”passive”, NUV–R , and drawn from the red-sequence population within the groups. Visual inspection of our IMACS -band images, taken in sub-arcsec seeing, confirms that these 16 are all early-type galaxies.

However, a minority of the central galaxies have bluer colors, and all but the reddest one of these are late-type galaxies. These could potentially represent chance projections of blue galaxies situated at large radii, rather than galaxies physically associated with the group cores. They all have and are situated Mpc from the group luminosity centroid. Based on the projected density of equally bright, blue galaxies at larger radii, –2 Mpc, we would expect a total of only such galaxies to be projected onto this central region of the relevant groups. Thus, most of these six blue centrals are likely to be physically situated in the group core. On average, they have lower stellar masses than do the red, passive ones, and they also reside further from the group luminosity centroid and in groups of lower total stellar mass (log vs. within Mpc), velocity dispersion ( vs. km s-1), and richness ( vs. ) than do red central galaxies. This suggests that our blue, late-type centrals reside in group halos that are relatively less massive and dynamically younger, consistent with the finding that the fraction of central group galaxies that are ellipticals is a strong function of group halo mass (Wilman & Erwin, 2012). Hence, these blue centrals likely represent ordinary bright star-forming galaxies, rather than objects with recent (dust-obscured) star formation fueled by cooling of intragroup gas.
3.2. Star-Forming Galaxy Fractions
Given equation (2), the fraction of group members detected in the FUV is equivalent to the fraction of galaxies forming stars above a certain rate. To explore how this quantity depends on galaxy properties and environment, we first apply our cut at in the FUV (i.e., SFR yr-1 before dust correction) to homogenize UV completeness across the sample. The resulting sample was also split at its median stellar mass of , to elucidate any dependence on galaxy mass. Figure 6 shows the resulting mean FUV fractions as a function of local galaxy environment. The results reveal a clear rise toward group outskirts, out to the largest radii and lowest galaxy densities probed. This trend is robust in both galaxy stellar mass bins when plotted against , but is generally much stronger for low-mass galaxies. These display lower UV fractions in group cores than do high-mass ones, reversing the situation at large radii where the higher UV fraction of low-mass galaxies simply reflects the standard dependence of sSFR on galaxy mass (see Section 3.3).
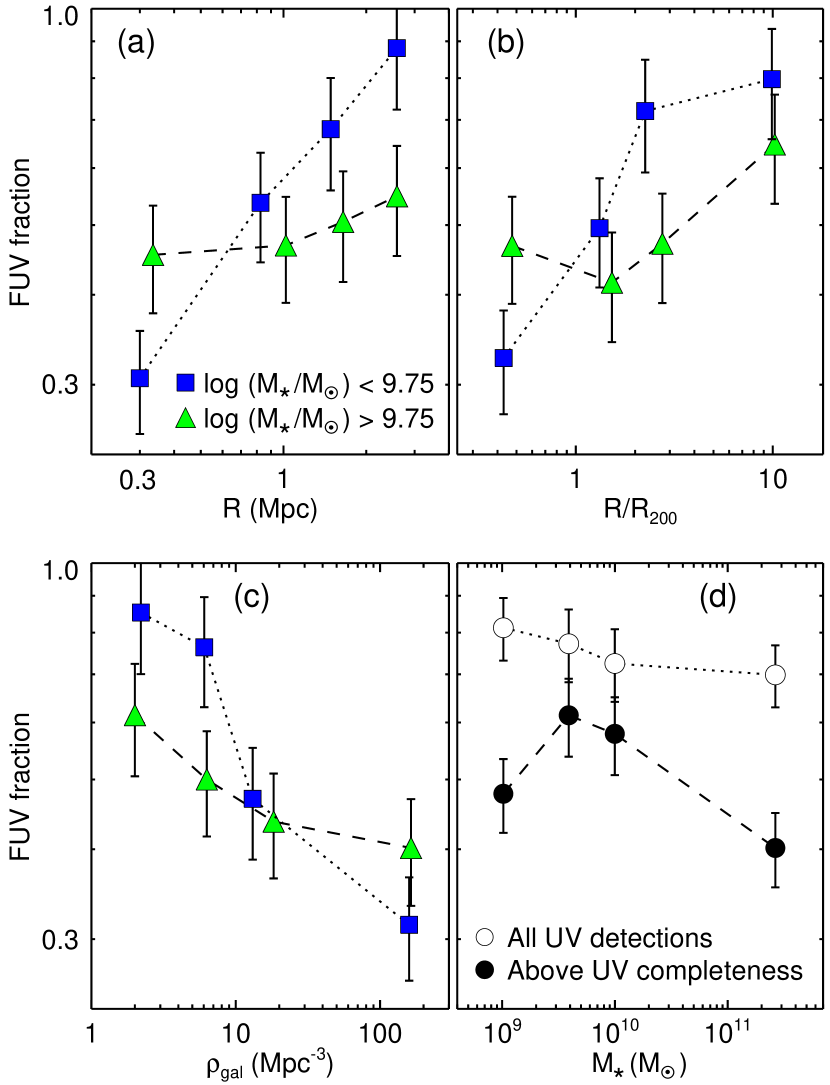
On average, the star-forming fraction among low-mass galaxies is suppressed out to at least Mpc and , thus mirroring results for much more massive clusters (Balogh et al., 1998). This implies that the group environment is influencing galaxy properties out to similar overdensity radii as in much more massive structures. If separating group and field/infall environments at these radii, we find average star-forming (SF) fractions above the UV completeness limit of % in groups and % in the field. This implies a decrease in mean SF fraction by % in groups relative to the field, in agreement with the 30% decline found from our Spitzer data of nine of the groups (Bai et al., 2010).
These trends could potentially just reflect an underlying variation in average galaxy stellar mass, with high-density group cores being dominated by more massive, red, and generally UV-faint galaxies. However, any residual mass dependence from bin to bin in panels (a)–(c) is limited to a non-systematic variation in mean with environment of dex. Furthermore, the decline in FUV fraction with is weaker than that with environmental parameters, as shown in Figure 6(d), even when including the UV detections below our completeness limit. The implication is that the observed trends are indeed environment–driven rather than reflecting environmental variations in mean .
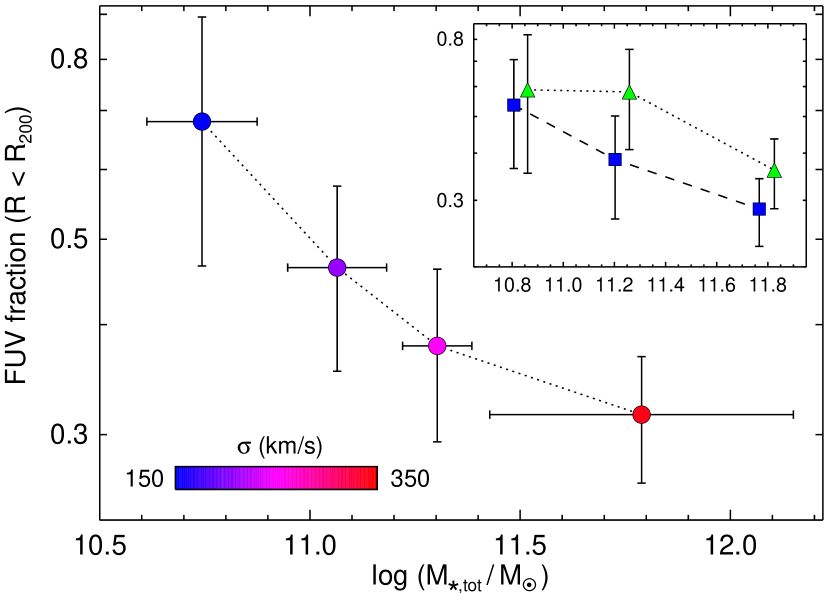
To explore any dependence on global group environment, Figure 7 displays the total FUV fractions within as a function of total group stellar mass , in four stellar mass bins containing a similar number of groups. The data show a systematic decline in average star-forming galaxy fraction with group stellar mass and velocity dispersion, from % in the lowest-mass bin to % for the most massive systems. Although subject to larger errors, the overall trend persists if subdividing the galaxy population into a low- and high-mass half (see figure inset), and so is not driven by systematic differences in average galaxy with total group stellar mass. Hence, even across the range of relatively low host halo masses considered here, the overall star formation activity is systematically modulated by global environment.
3.3. Star Formation Rates
For comparing dust-corrected SFRs of the 601 galaxies detected in both UV bands, we bring all objects on an equal footing by presenting their specific SFR in Figure 8.
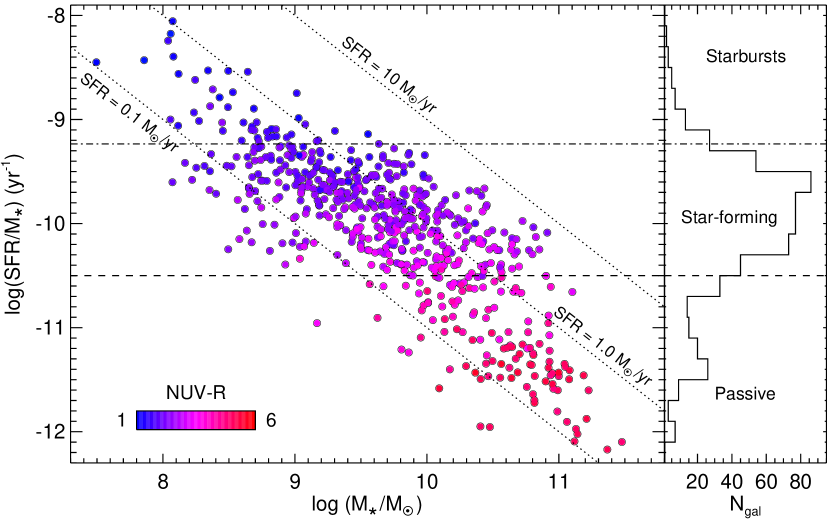
Above our approximate completeness limit, there is a clear decline in the average sSFR with across three orders of magnitude in stellar mass, and a corresponding increase in the UV–optical color. The dashed line in the Figure shows the value of sSFR = yr-1 that corresponds to the adopted distinction between passive and star-forming galaxies at NUV–R = 4, as suggested by a regression fit between the two quantities; this is a reliable and robust criterion, with only 3% of the bluer group members having estimated sSFRs below this value. The distribution of sSFR values also mirrors the bimodality seen for the NUV–R colors, and both distributions are clearly continuous, with no gap at intermediate colors or sSFRs.
For the star-forming galaxies with log , an outlier-resistant least-squares fit222Using the ladfit routine in the Interactive Data Language (idl) to the data in Figure 8 suggests a scaling relation of the form
| (6) |
with a mean absolute deviation of 0.24 dex. The result implies SFR . This is nominally slightly flatter than, but broadly consistent with, the relation obtained from GALEX data of much larger samples of the global low-redshift galaxy population, SFR (Salim et al., 2007; Schiminovich et al., 2007). Some flattening of this relation in groups relative to the field may in fact be expected, if the SFR of low-mass galaxies is suppressed in groups. Indeed, at the median log of the relevant galaxies, equation (6) would predict a mean sSFR which is 38–45% lower than seen for the field in the above studies (when corrected for differences in the assumed IMF, where necessary). As will be shown, this difference is significant and in excellent agreement with that inferred from the XI data themselves. The important implications are that the mean sSFR of star-forming galaxies is suppressed in groups relative to the field at a given , and that our estimated SFRs are not significantly biased compared to those derived in other similar studies.
To further explore this suppression in sSFR, we plot in Figure 9 the sSFR of star-forming galaxies against local environment in equal-number bins. The sample has further bin equally split into three bins in stellar mass, to test for systematic dependencies for low– and high–mass galaxies separately. Any residual mass dependence within these bins is negligible, as the mean within each bin varies non-systematically with environment by dex in all three diagrams. Environmental trends are clearly present, particularly for the lowest-mass galaxies, where the mean sSFR declines by 0.4 dex across the region probed. At , any systematic trends become negligible, however. Hence, not only does the fraction of SF galaxies vary with environment for our sample, but the actual SFR within star-forming galaxies does so too at fixed galaxy stellar mass . Note that, except for the highest– bin, the suppression of SFR/ is significant out to at least Mpc , similar to what is seen for the SF fractions themselves.
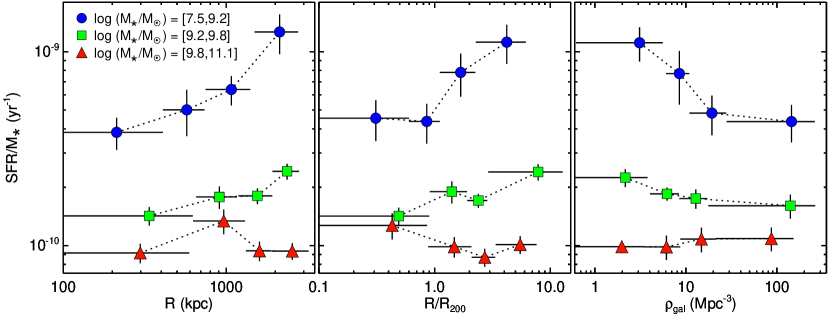
To our knowledge, this is the first time such a trend has been reported. No such trends were noticed in our earlier study (when considering galaxies at ; Bai et al. 2010), plausibly due to poorer statistics, smaller spatial coverage, and the fact that the effect is subtle for galaxies above this mass limit. The result suggests that with the full XI sample, we are now for the first time witnessing the ongoing quenching of star formation within nearby galaxy groups. Hence, such quenching is still taking place in the local universe within the relatively low-mass galaxy structures that dominate galaxy redshift surveys.
3.4. Fraction of Starburst Galaxies
In massive galaxy clusters, infalling galaxies can show enhanced star formation at intermediate radii (e.g., Porter et al. 2008; Pereira et al. 2010), possibly due to interactions with other nearby galaxies. Figure 9 suggests that a similar effect does not occur in smaller groups. To verify this, starburst galaxies were first identified within the groups. In line with our previous analysis of the 24 m data (Bai et al., 2010), starbursts are here defined as galaxies with a current SFR of at least three times their past average, i.e. with birthrate parameters , where
| (7) |
and where and is the typical stellar age and gas recycling fraction, respectively. Assuming and corresponding to a formation redshift , just prior to the peak in the cosmic SFR density, the resulting limit of is shown as a dot–dashed horizontal line in Figure 8.
The spatial variation in starburst galaxy fraction is illustrated in Figure 10. This plot confirms the absence of a characteristic density or radius at which star formation is enhanced, with fractions declining, within the errors, monotonically and significantly toward group cores. Within the uncertainties, there is also no systematic dependence of the starburst fraction within 0–, 1–2, or 2–3 on total group stellar mass. Hence, the enhanced starburst activity reported around galaxy clusters does not persist into the group regime, not even for the most massive groups in the sample. The unlikely alternative is that any localized enhancement in sSFR occurs at Mpc, i.e. partially beyond the -3 Mpc region identified for clusters (Porter et al., 2008).
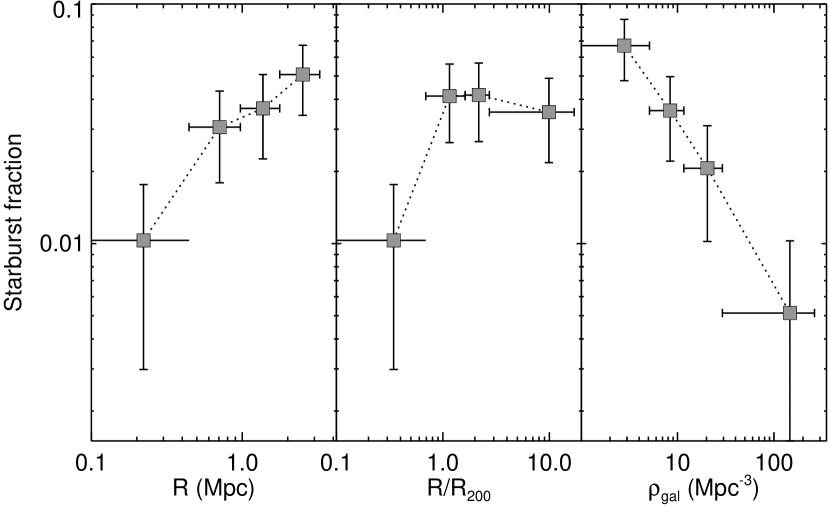
Among the group members with (for which our detection of starburst galaxies should be complete), a small fraction (%) can be classified as starbursts above our UV completeness limit. This is slightly higher than the value of % found for similar-mass galaxies in our 24 m data of a subset of the group sample. As demonstrated in Figure 10, the difference is at least partly explicable on account of the larger physical region probed here; for example, the fraction is reduced to % within and to % within kpc, the region probed by our Spitzer MIPS data in the narrowest direction. The inferred fraction within the full GALEX field is also consistent with the value of % derived for the local universe by Sargent et al. (2012). The absence of starbursts with in Figure 10 is furthermore consistent with the lack of enhanced star formation seen within groups at down to this mass completeness limit (Balogh et al., 2009).
4. Discussion
The inference that SFR/ within star-forming galaxies is environmentally suppressed in groups relative to the field is a novel result, to the best of our knowledge. It suggests that we are directly observing the ongoing quenching of star formation in dense environments. We speculate that this result was not identified in previous group studies for at least three reasons. First, while our group sample is homogeneously selected, the global group properties are very heterogeneous, with groups spanning at least an order of magnitude in velocity dispersion, total stellar mass, richness, and X-ray luminosity (see Table 1 and Rasmussen et al. 2006b, 2010). Combined with the large GALEX field which covers galaxies well into the infall regions, this allows us to self-consistently probe the full range of local and global galaxy environments up to the scale of massive groups. Second, many of these groups are likely dynamically young (Bai et al., 2010) and so contain a significant population of gas-rich star-forming galaxies which have been only mildly, if at all, affected by the group environment. If much of the environmentally induced gas loss from galaxies, e.g., via starvation, occurs when the group or cluster first collapses (Larson et al., 1980), then the inclusion of such dynamically unevolved systems is crucial for observing SF quenching in action. Finally, our deep spectroscopy enables inclusion of numerous low-mass galaxies down to , for which environmental effects are found to be be particularly prominent. This is only feasible for nearby group samples such as this; other systematic multi-wavelength studies of groups focus instead on systems at intermediate redshifts (e.g., Wilman et al. 2005; McGee et al. 2011) for which the limiting galaxy stellar mass is significantly higher.
4.1. Star Formation and Galaxy Environment
Our results show that both the star-forming and starbursting galaxy fractions decline toward dense group cores, in general agreement with results for other group samples at low and intermediate redshifts (Balogh et al., 2004; Wilman et al., 2005; Jeltema et al., 2007; McGee et al., 2011) and with those from our 24 m imaging (Bai et al., 2010). Importantly, the decline in SF fraction is present also at fixed stellar mass, and with galaxies below showing stronger environmental trends than do more massive objects.
Globally, the SF fractions within are 35% lower than seen at the largest radii probed. Comparing this to our corresponding 24 m results for a subset of this sample (Bai et al., 2010) suggests excellent agreement between the UV and mid-IR results, but definitive confirmation of this will have to await the Spitzer results for the full sample (L. Bai et al., in preparation). In contrast, the observed systematic decline in SF fraction with total group stellar mass was not seen in our preliminary Spitzer analysis, possibly due to poorer statistics and the consideration of a fixed metric region for all groups.
For star-forming galaxies alone, a systematic suppression of sSFR with local environmental parameters is further seen, persisting out to the largest radii and lowest galaxy densities probed. This is preferentially observed within low-mass galaxies, with the trend becoming negligible at stellar masses . At fixed, low galaxy stellar mass, the suppression is also modest, amounting to a factor of for SF galaxies in the densest group regions (Figure 9). This is much less than the corresponding variation with stellar mass for the same galaxies ( orders of magnitude; cf. Figure 8). Nevertheless, if taking galaxies at Mpc as representative of the field and infall regions (see Figures 6 and 9), then the mean and error on the sSFR of all SF galaxies in these regions is yr-1, significantly higher than the yr-1 found within the group environment itself. Given that the mean stellar mass of the two sub-populations are similar, this implies an average suppression in star formation activity within all star-forming galaxies in groups by % relative to the “field” value within our data. This is in good agreement with the observed % decline relative to typical values for large local galaxy samples discussed in Section 3.3.
The observed environmental variation in sSFR is at odds with the generally negligible difference between typical sSFRs in groups and the field seen in other studies of group samples at low and intermediate redshifts (Balogh et al., 2004; Vulcani et al., 2010; McGee et al., 2011). The inclusion of galaxies well below the limit of these other studies —afforded by the proximity of our sample— as well as the nature of the XI groups and of the present data (as described above) may all contribute to this difference.
Before interpreting these results, we note that two effects could bias the results in Figures 6 and 9. First, the differences in spectroscopic completeness between the Mpc IMACS data and the auxiliary data employed at larger radii imply a relative shortfall of low-mass (i.e., high-sSFR) galaxies at Mpc in the sample. However, this would only act to suppress the observed trends, which could therefore be even stronger than inferred. Second, the presence of interlopers, unaffected by the group environment, would also dampen any real trends. The importance of this can be assessed by quantifying the projected density of SF background galaxies as determined at large radii. To do so, we take galaxies at and beyond the outermost data points in Figures 6 and 9, ie. those with Mpc-3 or , as belonging to the field. In addition, we only consider galaxies with , in order to homogenize spectroscopic completeness across all radii. This yields a mean Mpc-2 for the projected density of such SF galaxies in the field. Within the group region (), the corresponding value is Mpc-2, rising to Mpc-2 within . These results do not change if only considering galaxies above our UV completeness limit, suggesting that no more than 5–7% of the SF galaxies seen within our groups are interlopers.
For fainter galaxies, a larger interloper fraction cannot be ruled out, due to the lower spectroscopic completeness at large radii. However, we do note that the 5–7% would represent a global upper limit if the fraction of (low-mass, high-sSFR) galaxies fainter than is lower in groups than in the field. This assertion would be in line with the observed decline in the dwarf-to-giant galaxy ratio toward cluster cores (Sánchez-Janssen et al., 2008). The tentative implication is that the great majority of SF galaxies identified within the XI groups are physically associated with the group, even those in the densest regions of our most massive groups. In any case, a larger interloper fraction would only act to suppress the observed trends, which are most prominent for the lowest-mass galaxies, so in that sense our results are conservative.
In summary, the dependence of both SF fractions and the sSFRs of SF galaxies on local group environment is a robust result. While the SFRs depend primarily on stellar mass above our UV completeness limit, with SFR , there is a significant residual dependence on local environment at fixed stellar mass. Local galaxy environment thus plays an important role in regulating both the proportion and actual activity of star-forming galaxies in groups. The fact that the SF galaxy fraction generally declines with increasing total stellar group mass suggests that global group environment may also modulate star formation. To explore this possibility, we plot the star-forming fractions and the sSFR of star-forming galaxies as a function of in Figure 11 while controlling for global group parameters.
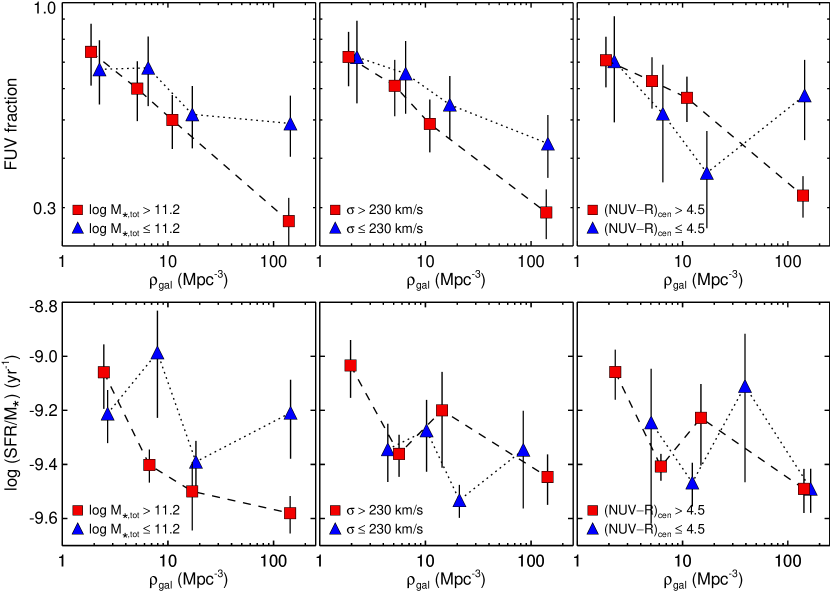
To maximize the strength of any trends, the bottom panel only considers the low-mass half of the star-forming galaxies, for which the dependence of sSFR on local environment is strongest. In this panel, the bin-to-bin variation in mean with environment is dex and not systematically dependent on or . The results indicate that, at fixed , the star-forming galaxy fraction and the sSFR of star-forming galaxies are more heavily suppressed in the cores of high-mass groups with “evolved” central galaxies.
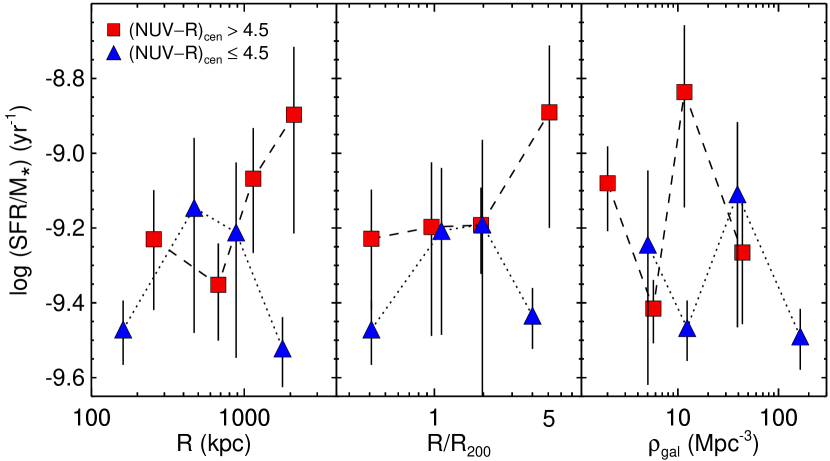
In fact, the trends in Figure 9 are mainly driven by galaxies in the latter groups, since no clear environmental suppression of sSFR is seen for the low-mass groups with blue central galaxies. To understand whether the absence of a trend in the low-mass groups is driven simply by the arguably less evolved systems with blue centrals, we subdivide the low-mass groups according to central galaxy color. Figure 12 shows the resulting mean sSFRs as a function of environment for these two classes of groups. We focus again on the low-mass galaxies only ( ), in order to maximize the strength of any trends. While the low-mass groups with red centrals do show mild evidence of a trend with , the mean specific SFRs of galaxies within the two types of groups are similar within Mpc . Hence within the relevant radii and densities, there is no strong evidence for “less evolved” systems of a given low to behave dramatically different from those containing red centrals.
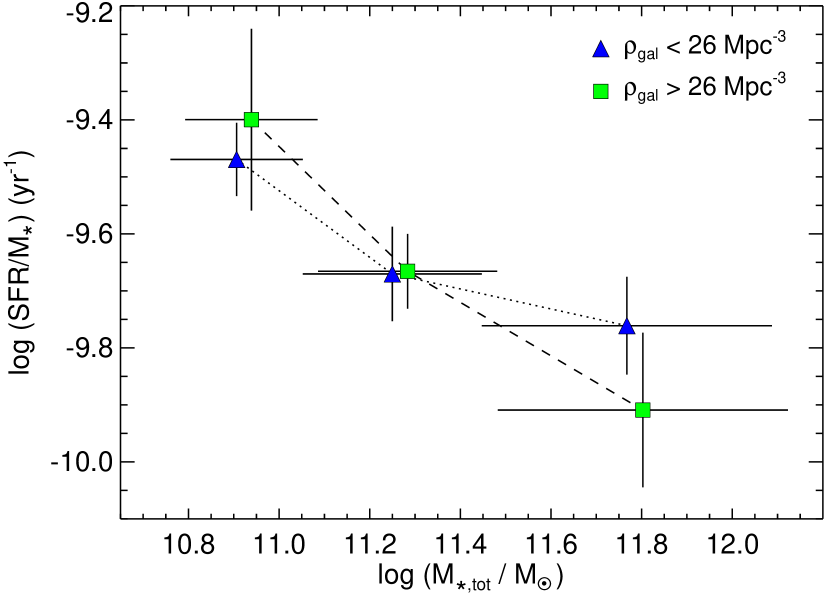
The above results suggest that, at fixed local galaxy environment, a residual contribution to quenching is present whose impact scales with total group stellar mass. One caveat to this interpretation is that (and ) may measure different ”environments” in small and large systems, with a given value of being representative of a relatively larger range in in small systems. However, all trends in Figure 11 are qualitatively similar, and all conclusions unaffected, if instead plotting the results against or . To further verify that the inferred variations in SF activity at fixed (high) are not just reflecting variations in itself with total group stellar mass, we divide the star-forming galaxies according to their median , consider only galaxies within , and control for galaxy stellar mass by only considering the low-mass half of the resulting sample. The average sSFR of these galaxies in the two bins of are shown as a function of in Figure 13. A decline with is seen in both bins of , confirming that the suppression in SF at fixed local environment does scale with total group stellar mass.
4.2. Quenching of Star Formation in Groups
The immediate interpretation of the above results is that the suppression of SF depends on both local and global group environment, and so is possibly modulated by at least two different mechanisms. Galaxy density, or some quantity scaling with it, plays a role in shutting down SF in groups. Tidal interactions and mergers are plausible candidates, as these should be important in these low– environments, especially in regions of high galaxy density. In addition, quenching is more efficient at fixed galaxy density in higher- groups, opposite to what is expected from tidal galaxy–galaxy interactions. If the latter are important, then an additional mechanism whose efficiency is independent of but instead scales with group stellar mass and acts predominantly in the densest regions must also have an impact. Gas-dynamical processes such as ram pressure/viscous stripping and starvation are obvious candidates.
Possible clues to the quenching mechanism emerge from the result that an environmental dependence of sSFR in blue, star-forming galaxies at fixed (low) galaxy mass is mainly observed in the more massive groups with red central galaxies, not within the lowest-mass ones with blue centrals. Nor is such a trend observed in massive low- clusters (Wolf et al., 2009; Chung et al., 2011; Lu et al., 2012), although some evidence is seen when including SF galaxies in km s-1 groups down to sSFR yr-1 (von der Linden et al., 2010). To explain these results, one could hypothesize that the blue SF galaxies observed in low- clusters, which comprise a significantly smaller fraction than in groups (cf. Bai et al. 2010), are strongly dominated by interlopers associated with the general field (as supported by the inference that backsplash galaxies in clusters have essentially no SF left after just a single passage through the cluster; Mahajan et al. 2011). Hence, little difference in sSFR between blue field and “cluster” SF galaxies should be expected. On the other hand, in the smallest and youngest groups (some of which are perhaps collapsing only now) most SF galaxies will be real group members in which star formation may not yet have been strongly suppressed. Only in relatively massive, evolved groups below the scale of clusters can we directly observe the ongoing environmental quenching of SF.
This raises the possibility of constraining the timescales for quenching SF in groups. In order to see a correlation between sSFR and clustercentric radius one needs a coincidence between and the crossing timescale . Conversely, if (“case A”) then all SF will be shut down near the virial radius, so there will be little radial trend further in (where SF galaxies will mainly be interlopers, and the radial trend in SF fraction will reflect that of the interloper fraction). In contrast, if (“case B”) then galaxies will perform multiple crossings as SF is quenched, so again there will be little radial trend. For virialized systems which have collapsed at the same epoch, is independent of system mass, since and . Hence, the interpretation suggested here is that the quenching timescale is generally shorter in more massive systems, with rich clusters falling under case A above, the poorest (and/or youngest) groups under case B, and with relatively massive groups (–500 km s-1) as the only systems in between.
For the half of our group sample, the mean linear crossing time (Rood & Dickel, 1978) is in the range –1.6 Gyr, depending on the maximum radius considered (, 2, or Mpc). Since SF is not completely shut down after a single crossing, this would suggest a typical quenching timescale of Gyr in these systems. This result provides strong independent confirmation of recent estimates of –3 Gyr based on simple models for the accretion of galaxies onto groups (McGee et al., 2009, 2011).
If galaxy–galaxy interactions alone induce quenching through rapid consumption of gas associated with an interaction-triggered starburst phase, then the presently observed starburst fraction of inside limits the characteristic timescale of this phase (Bai et al., 2010). The SF fraction in groups has declined relative to that of the field since at least –0.6 (Wilman et al., 2005; McGee et al., 2011), i.e., over the past Gyr. If mergers and interactions have accomplished this with a constant with redshift, then a quenched fraction of today requires a typical quenching timescale Gyr. This timescale is too short in comparison to the crossing times mentioned above. In addition, there is no indication of enhanced SF or starburst activity at small-to-intermediate radii, which could otherwise indicate a temporary boost in SF associated with, or immediately prior to, the actual quenching.
In this context, it is interesting to note the detection of a pronounced bimodality in sSFRs in Hickson Compact Groups (HCGs; Tzanavaris et al. 2010; Walker et al. 2012), with a sparsely populated region separating low– and high-sSFR systems ( yr-1 and yr-1 respectively; see also Figure 8). This feature is more prominent than seen for our groups, other groups, in the field, or in cluster cores (Walker et al., 2012; Wetzel et al., 2012). It favors a rapid transition from SF to quiescence, perhaps preceded by a period of enhanced SF activity in at least some galaxies. The lack of such a clear bimodality within the XI sample may indicate a slower transition from SF to quiescence than in HCGs, or that SF is not similarly enhanced prior to the transition. The latter possibility may help to explain the lack of a clear enhancement in average sSFR or starburst fraction at intermediate radii for our SF population. Since galaxy–galaxy interactions should be particularly efficient in HCGs, this further supports the idea that other quenching mechanisms are playing a relatively more important role in the XI groups.
In summary, the results inferred from Figure 11, the required quenching timescales in comparison to that associated with an interaction–induced starburst phase, and the comparison to HCGs, all point to galaxy–galaxy interactions being complemented by a more slowly acting quenching mechanism within our groups. Ram pressure stripping and starvation are both likely to act over Gyr timescales in these relatively low-mass environments. The latter process seems particularly promising, as it can still remove hot galactic halo gas even within fairly small groups (Kawata & Mulchaey, 2008). Although starvation alone is not expected to act efficiently out to such large radii and low galaxy densities as inferred here, the presence of backsplash galaxies returning to the apocenter of their orbit would help to explain our results. Such galaxies comprise as much as half of all galaxies beyond the virial radius in massive clusters (Balogh et al., 2000). The observed dependence on galaxy stellar mass arises naturally under the assumption that low-mass galaxies are relatively more gas-rich to begin with and have lower gravitational restoring forces, making them more susceptible to gas removal.
4.3. UV Luminosity Density in Groups
As a final point, we consider the total UV luminosity density in the local universe provided by groups similar to those in the XI sample. This is relevant for understanding the contribution of these environments to the local SFR density and hence the general importance of the results presented. To first evaluate the space density of such groups, we consider the catalog of Eke et al. (2004). This is a statistically more robust catalog of groups compiled from the entire 2dFGRS, of which the Merchán & Zandivarez (2002) catalog, from which our groups were drawn, is a subset. As the statistics of the group population in the two catalogs are completely consistent (Rasmussen et al., 2006b), we can reliably use the Eke et al. (2004) catalog for this exercise, benefiting from its superior statistics. Within the full catalog (avoiding the 2dF survey edges and regions of poor completeness), we select groups with , km s-1, and –0.07, to mimic the XI selection criteria within a sufficiently wide redshift interval to obtain useful statistics. For the resulting total of 395 systems, we infer a space density of Mpc-3 ( statistical error).
Within Mpc of the 22 fully covered groups in the present sample, we derive average specific rest-frame luminosities (prior to dust-correction) of (NUV) and erg s-1 Hz-1 (FUV) per group. With the space density inferred above, this implies total UV luminosity densities of (NUV) and erg s-1 Hz-1 Mpc-3 for such groups. These are factors of 4.2 (4.6) below the total spatially averaged output in NUV (FUV) at (Wyder et al., 2005), implying that XI–like groups account for % (%) of the total NUV (FUV) luminosity density in the local universe. In contrast to the Wyder et al. (2005) results, these numbers do not incorporate corrections for incompleteness below our limit and so should be considered lower limits. Hence, despite the enhanced SF quenching in groups relative to the field, at least % of all UV star formation at low redshift still takes place within friends-of-friends redshift-selected groups similar to the XI systems.
For the 22 groups combined, we further estimate a total FUV SFR of SF galaxies within Mpc of 180 yr-1, of which 54 yr-1 (30%) is unobscured. This corresponds to an average , in broad agreement with results for both field (Wyder et al., 2005) and cluster samples (Cortese et al., 2008b; Haines et al., 2011). This implies similar levels of mean UV obscuration for galaxies across all types of global environment.
5. Summary and Conclusions
Using GALEX imaging, we have presented dust-corrected star formation rates and general UV properties of the galaxy population within 23 redshift-selected groups at . The data cover a radius of 2.5 Mpc around each group, allowing us to establish UV properties of group members from group cores into the general field, down to an SFR completeness level of 0.06 yr-1 before dust corrections. Our conclusions may be summarized as follows.
The fractions of UV star-forming galaxies show a clear, systematic decline toward the dense group cores. The fractions are suppressed by 35% on average relative to the field, and the suppression is significant out to at least Mpc . This implies that the group environment is modifying galaxy properties out to similar overdensity radii as are much more massive clusters (Balogh et al., 1998). This remains true at fixed galaxy stellar mass but is most pronounced for galaxies within the low-mass half of our UV–detected sample ( ). The star-forming fractions within also decline with total group stellar mass, from an average of % in the lowest-mass groups to only % within the most massive systems ( km s-1).
In a minority of the groups, the central galaxy is a late-type object with NUV–R colors consistent with ongoing star formation. These groups tend to be of lower total stellar mass and richness, and are possibly dynamically younger than the rest, as also suggested by the larger average projected distance between their central galaxy and the group luminosity centroid.
The star formation rates of group galaxies depend primarily on galaxy stellar mass, in a manner broadly agreeing with results for the global low-redshift galaxy population, SFR . There is no evidence for enhanced star formation at intermediate radii or galaxy densities, as otherwise reported for galaxies in the filaments connecting massive clusters. At stellar masses , the global fraction of starburst galaxies within the groups is %, consistent with, but at the low end of, the range inferred globally for the nearby universe. The fraction declines significantly with local galaxy density, however, from 5–7% in the lowest-density regions to % in the dense group cores.
For the first time, we report a dependence on local galaxy environment of not only star-forming galaxy fractions but also of specific SFRs within blue star-forming galaxies at fixed . The latter trend is strongest for low-mass galaxies ( ), in which the mean specific SFR declines by a factor from the field to the dense group cores. This effect becomes insignificant at galaxy stellar masses , plausibly explaining why it has not been detected in other detailed studies of groups at higher redshift. On average, specific star formation rates of star-forming galaxies in groups are suppressed by % relative to the field, taking results for the field either from our own analysis or from other GALEX results for large, low-redshift galaxy samples.
At fixed galaxy mass and local density, the suppression of both specific SFRs and star-forming galaxy fractions is stronger in more massive groups, especially in the dense group cores. The decline in both quantities with local density is in fact largely driven by the high-mass groups with red central galaxies, whereas most galaxies in lower-mass groups with blue centrals may have yet to be significantly affected by their environment. Both local and global group environment thus play a role in quenching star formation, suggesting a combination of at least two underlying mechanisms: One whose efficiency depends primarily on radius or local galaxy density, and one which scales with total group mass and acts primarily in the group cores. Galaxy–galaxy interactions and gas-dynamical processes, respectively, are the obvious candidates.
The observed decline in specific SFRs toward group cores implies a characteristic timescale for shutting down star formation which is comparable to the crossing times, Gyr. This timescale is in good agreement with other independent estimates. Based on the observed starburst fraction in the groups, we demonstrate that gas consumption associated with starbursts triggered by galaxy–galaxy interactions proceed too quickly to be compatible with this timescale. Combined with the absence of a bimodality in the distribution of specific SFRs, this result confirms that a more slowly acting mechanism also contributes significantly to quenching in groups. We argue that starvation is the most likely candidate, acting in concert with galaxy–galaxy interactions.
The generality of these results for the global low-redshift galaxy population is attested by the finding that the total UV luminosity density provided by typical groups with more than four members is at least 25% in the local universe. This is in spite of the accelerated quenching of star formation relative to the field still taking place within these systems at present. We also find that % of the UV star formation in such group environments is obscured, in good agreement with results obtained for field and cluster samples.
References
- Arnold et al. (2009) Arnold, T. J., Martini, P., Mulchaey, J. S., Berti, A., & Jeltema, T. E. 2009, ApJ, 707, 1691
- Bai et al. (2010) Bai, L., Rasmussen, J., Mulchaey, J. S., et al. 2010, ApJ, 713, 637
- Baldry et al. (2006) Baldry, I. K., Balogh, M. L., Bower, R. G., et al. 2006, MNRAS, 373, 469
- Balogh et al. (1998) Balogh, M. L., Schade, D., Morris, S. L., et al. 1998, ApJ, 504, L75
- Balogh et al. (2004) Balogh, M., Eke, V., Miller, C., et al. 2004, MNRAS, 348, 1355
- Balogh et al. (2009) Balogh, M. L., McGee, S. L., Wilman, D., et al. 2009, MNRAS, 398, 754
- Balogh et al. (2000) Balogh, M. L., Navarro, J. F., & Morris, S. L. 2000, ApJ, 540, 113
- Bell et al. (2003) Bell, E. F., McIntosh, D. H., Katz, N., & Weinberg, M. D. 2003, ApJS, 149, 289
- Blanton & Roweis (2007) Blanton, M. R., & Roweis, S. 2007, AJ, 133, 734
- Buat et al. (2005) Buat, V., Iglesias-Páramo, J., Seibert, M., et al. 2005, ApJ, 619, L51
- Buat et al. (2007) Buat, V., Takeuchi, T. T., Iglesias-Páramo, J., et al. 2007, ApJS, 173, 404
- Chung et al. (2011) Chung, S. M., Eisenhardt, P. R., Gonzalez, A. H., et al. 2011, ApJ, 743, 34
- Colless et al. (2001) Colless, M., Dalton, G., Maddox, S., et al. 2001, MNRAS, 328, 1039
- Cortese et al. (2008a) Cortese, L., Boselli, A., Franzetti, P., et al. 2008a, MNRAS, 386, 1157
- Cortese et al. (2008b) Cortese, L., Gavazzi, G., & Boselli, A. 2008b, MNRAS, 390, 1282
- Donahue et al. (2010) Donahue, M., Bruch, S., Wang, E., et al. 2010, ApJ, 715, 881
- Donas et al. (2007) Donas, J., Deharveng, J.-M., Rich, R. M., et al. 2007, ApJS, 173, 597
- Eke et al. (2004) Eke, V. R., Baugh, C. M., Cole, S., et al. 2004, MNRAS, 348, 866
- Eke et al. (2005) Eke, V. R., Baugh, C. M., Cole, S., et al. 2005, MNRAS, 362, 1233
- Fadda et al. (2008) Fadda, D., Biviano, A., Marleau, F. R., Storrie-Lombardi, L. J., & Durret, F. 2008, ApJ, 672, L9
- Finn et al. (2004) Finn, R. A., Zaritsky, D., & McCarthy, D. W., Jr. 2004, ApJ, 604, 141
- Haines et al. (2011) Haines, C. P., Busarello, G., Merluzzi, P., et al. 2011, MNRAS, 412, 127
- Hicks et al. (2010) Hicks, A. K., Mushotzky, R., & Donahue, M. 2010, ApJ, 719, 1844
- Hopkins & Beacom (2006) Hopkins, A. M., & Beacom, J. F. 2006, ApJ, 651, 142
- Iglesias-Páramo et al. (2006) Iglesias-Páramo, J., Buat, V., Takeuchi, T. T., et al. 2006, ApJS, 164, 38
- Iovino et al. (2010) Iovino, A., Cucciati, O., Scodeggio, M., et al. 2010, A&A, 509, A40
- Jeltema et al. (2007) Jeltema, T. E., Mulchaey, J. S., Lubin, L. M., & Fassnacht, C. D. 2007, ApJ, 658, 865
- Kauffmann et al. (2004) Kauffmann, G., White, S. D. M., Heckman, T. M., et al. 2004, MNRAS, 353, 713
- Kawata & Mulchaey (2008) Kawata, D., & Mulchaey, J. S. 2008, ApJ, 672, L103
- Kennicutt (1998) Kennicutt, R. C., Jr. 1998, ARA&A, 36, 189
- Kotulla et al. (2009) Kotulla, R., Fritze, U., Weilbacher, P., & Anders, P. 2009, MNRAS, 396, 462
- Larson et al. (1980) Larson, R. B., Tinsley, B. M., & Caldwell, C. N. 1980, ApJ, 237, 692
- Lu et al. (2012) Lu, T., Gilbank, D. G., McGee, S. L., Balogh, M. L., & Gallagher, S. 2012, MNRAS, 420, 126
- McGee et al. (2009) McGee, S. L., Balogh, M. L., Bower, R. G., Font, A. S., & McCarthy, I. G. 2009, MNRAS, 400, 937
- McGee et al. (2011) McGee, S. L., Balogh, M. L., Wilman, D. J., et al. 2011, MNRAS, 413, 996
- Madau et al. (1996) Madau, P., Ferguson, H. C., Dickinson, M. E., et al. 1996, MNRAS, 283, 1388
- Mahajan & Raychaudhury (2009) Mahajan, S., & Raychaudhury, S. 2009, MNRAS, 400, 687
- Mahajan et al. (2011) Mahajan, S., Mamon, G. A., & Raychaudhury, S. 2011, MNRAS, 416, 2882
- Merchán & Zandivarez (2002) Merchán, M., & Zandivarez, A. 2002, MNRAS, 335, 216
- Muzzin et al. (2012) Muzzin, A., Wilson, G., Yee, H. K. C., et al. 2012, ApJ, 746, 188
- Peng et al. (2010) Peng, Y.-j., Lilly, S. J., Kovač, K., et al. 2010, ApJ, 721, 193
- Pereira et al. (2010) Pereira, M. J., Haines, C. P., Smith, G. P., et al. 2010, A&A, 518, L40
- Porter & Raychaudhury (2007) Porter, S. C., & Raychaudhury, S. 2007, MNRAS, 375, 1409
- Porter et al. (2008) Porter, S. C., Raychaudhury, S., Pimbblet, K. A., & Drinkwater, M. J. 2008, MNRAS, 388, 1152
- Rasmussen et al. (2006a) Rasmussen, J., Ponman, T. J., & Mulchaey, J. S. 2006a, MNRAS, 370, 453
- Rasmussen et al. (2006b) Rasmussen, J., Ponman, T. J., Mulchaey, J. S., Miles, T. A., & Raychaudhury, S. 2006b, MNRAS, 373, 653
- Rasmussen et al. (2010) Rasmussen, J., Mulchaey, J. S., Bai, L., et al. 2010, ApJ, 717, 958
- Rieke et al. (2009) Rieke, G. H., Alonso-Herrero, A., Weiner, B. J., et al. 2009, ApJ, 692, 556
- Rood & Dickel (1978) Rood, H. J., & Dickel, J. R. 1978, ApJ, 224, 724
- Sánchez-Janssen et al. (2008) Sánchez-Janssen, R., Aguerri, J. A. L., & Muñoz-Tuñón, C. 2008, ApJ, 679, L77
- Salim et al. (2007) Salim, S., Rich, R. M., Charlot, S., et al. 2007, ApJS, 173, 267
- Sargent et al. (2012) Sargent, M. T., Béthermin, M., Daddi, E., & Elbaz, D. 2012, ApJ, 747, L31
- Schlegel et al. (1998) Schlegel, D. J., Finkbeiner, D. P., & Davis, M. 1998, ApJ, 500, 525
- Schiminovich et al. (2007) Schiminovich, D., Wyder, T. K., Martin, D. C., et al. 2007, ApJS, 173, 315
- Shen et al. (2007) Shen, Y., Mulchaey, J. S., Raychaudhury, S., Rasmussen, J., & Ponman, T. J. 2007, ApJ, 654, L115
- Tzanavaris et al. (2010) Tzanavaris, P., Hornschemeier, A. E., Gallagher, S. C., et al. 2010, ApJ, 716, 556
- von der Linden et al. (2010) von der Linden, A., Wild, V., Kauffmann, G., White, S. D. M., & Weinmann, S. 2010, MNRAS, 404, 1231
- Vulcani et al. (2010) Vulcani, B., Poggianti, B. M., Finn, R. A., et al. 2010, ApJ, 710, L1
- Walker et al. (2012) Walker, L. M., Johnson, K. E., Gallagher, S. C., et al. 2012, AJ, 143, 69
- Wetzel et al. (2012) Wetzel, A. R., Tinker, J. L., & Conroy, C. 2012, MNRAS, 424, 232
- Wilman & Erwin (2012) Wilman, D. J., & Erwin, P. 2012, ApJ, 746, 160
- Wilman et al. (2005) Wilman, D. J., Balogh, M. L., Bower, R. G., et al. 2005, MNRAS, 358, 88
- Wolf et al. (2009) Wolf, C., Aragón-Salamanca, A., Balogh, M., et al. 2009, MNRAS, 393, 1302
- Wyder et al. (2005) Wyder, T. K., Treyer, M. A., Milliard, B., et al. 2005, ApJ, 619, L15