Coplanar circumbinary debris disks
Abstract
We present resolved Herschel images of circumbinary debris disks in the CrB (HD 139006) and Tri (HD13161) systems. By modelling their structure, we find that both disks are consistent with being aligned with the binary orbital planes. Though secular perturbations from the binary can bring the disk into alignment, in both cases the alignment time at the distances at which the disk is resolved is greater than the stellar age, so we conclude that the coplanarity was primordial. Neither disk can be modelled as a narrow ring, requiring extended radial distributions. To satisfy both the Herschel and mid-IR images of the CrB disk, we construct a model that extends from 1-300AU, whose radial profile is broadly consistent with a picture where planetesimal collisions are excited by secular perturbations from the binary. However, this model is also consistent with stirring by other mechanisms, such as the formation of Pluto-sized objects. The Tri disk is modelled as a disk that extends from 50-400AU. A model with depleted (rather than empty) inner regions also reproduces the observations and is consistent with binary and other stirring mechanisms. As part of the modelling process, we find that the Herschel PACS beam varies by as much as 10% at 70m and a few % at 100m. The 70m variation can therefore hinder image interpretation, particularly for poorly resolved objects. The number of systems in which circumbinary debris disk orientations have been compared with the binary plane is now four. More systems are needed, but a picture in which disks around very close binaries ( CrB, Tri, and HD 98800, with periods of a few weeks to a year) are aligned, and disks around wider binaries (99 Her, with a period of 50 years) are misaligned, may be emerging. This picture is qualitatively consistent with the expectation that the protoplanetary disks from which the debris emerged are more likely to be aligned if their binaries have shorter periods.
keywords:
circumstellar matter — stars: individual: Trianguli, Coronae Borealis, 99 Herculis, HD 988001 Introduction
The Herschel Key Program DEBRIS (Dust Emission via a Bias free Reconnaissance in the Infrared/Submillimeter) has observed a large sample of nearby stars to discover and characterise extrasolar analogues to the Solar System’s asteroid and Edgeworth-Kuiper belts, collectively known as “debris disks.” The 3.5m Herschel mirror diameter provides 6-7” resolution at 70-100m (Pilbratt et al., 2010), and as a consequence our survey has resolved many disks around stars in the Solar neighbourhood for the first time (Matthews et al., 2010; Churcher et al., 2011; Kennedy et al., 2012, Wyatt et. al. 2012).111Herschel is an ESA space observatory with science instruments provided by European-led Principal Investigator consortia and with important participation from NASA.
Here we present resolved images of circumbinary disks in the CrB and Tri systems. These systems are interesting because unlike most debris disk+binary systems, the binary orbits are well characterised. The combination of a known orbit and resolved disk means we can compare their relative inclination.
Our observations of a disk around the binary 99 Her (Kennedy et al., 2012) were a step toward building on the binary debris disk study of Trilling et al. (2007). Their Spitzer study found that debris disks are generally as common in binary systems as in single systems, but are less likely to reside in systems with binary separations in the 3-30AU range (see also Rodriguez & Zuckerman, 2012). However, only some of their systems had detections at multiple wavelengths to constrain the disk location and none were reported as resolved, making the true dust location uncertain. Even in the case of dust detection at multiple wavelengths, the true dust location is unknown because grains of different compositions and sizes can have the same temperature at different stellocentric distances. In addition to uncertainty in the dust location, only the projected sky separation of the binary (not the binary semi-major axis) was generally known, adding further uncertainty.
Systems with resolved disks and well characterised binary orbits, such as 99 Her, CrB, Tri, and HD 98800 (Andrews et al., 2010) remove these ambiguities. The dust location and structure can be inferred within the context of the binary orbit, leading to robust conclusions about whether the dust resides on stable orbits. One can also consider whether perturbations from the binary play an important role in setting the dust dynamics. For example, in the 99 Her system the disk position angle appears misaligned with the binary line of nodes. This misalignment is best explained with particles on polar orbits because these are stable for the stellar lifetime (Kennedy et al., 2012). Another question is whether binary perturbations can “stir” the disk particles by increasing their inclinations and eccentricities, eventually resulting in high enough relative velocities that collisions are destructive. This process is analogous to the planet stirring model proposed by Mustill & Wyatt (2009), though may rely on vertical (inclination) stirring because companions of comparable mass induce lower forced eccentricities than companions that are much less massive than the star (Kennedy et al., 2012; Moriwaki & Nakagawa, 2004).
An additional link can be made to star and planet formation. Young binary systems with small to medium (100AU) separations are thought to form coplanar with their protoplanetary disks, because the disk torque aligns the binary orbit on timescales short relative to the disk lifetime (e.g. Bate et al., 2000). Testing this prediction is difficult because it is difficult to ascertain disk and binary orientations at the distances of the nearest star forming regions (e.g. Monin et al., 2007). Because debris disks around older main-sequence binaries should retain the same orientation as the protoplanetary disks from which they emerged, these disks yield information on the outcome of star formation. The advantage is that compared to star-forming regions, these systems are much closer to Earth and hence larger on the sky and brighter, making disk and binary characterisation much easier.
Though planet formation may be hindered to some degree by high collision velocities induced by binary perturbations (e.g. Moriwaki & Nakagawa, 2004; Scholl et al., 2007), the discovery of several circumbinary planets shows that planets do indeed form around binary stars (e.g. Doyle et al., 2011; Welsh et al., 2012). Few such systems are known because binaries are generally avoided by radial velocity surveys (see Konacki, 2005; Konacki et al., 2009). However, the very existence of circumbinary debris disks provides evidence that planet formation around binaries can proceed to form at least 10-100km sized objects, which must exist to feed the observed dust through collisions (e.g. Wyatt, 2008; Krivov, 2010). Further, circumbinary disks are relatively common (Trilling et al., 2007), suggesting that circumbinary planets may be no less unusual than their circumstellar equivalents.
This paper is laid out as follows. We first consider the stellar and orbital properties, along with previous IR observations of the CrB and Tri systems (§2). We then show the Herschel data (§3) and simple models (§4), and then interpret these within the context of the expected dynamics (§5). We discuss the results and conclude in §§6 & 7.
2 The binary systems
2.1 Coronae Borealis
Among the “alpha” stars, CrB (HD 139006, HIP 76267) is the only known eclipsing binary (Stebbins, 1914; Tomkin & Popper, 1986). Though some properties of this binary have been known for over a century (e.g. Jordan, 1910), only recently has the orientation of the orbit on the sky been constrained by the Hipparcos mission (which also provides a system distance of 23pc, Perryman & ESA, 1997; van Leeuwen, 2007). The orbital elements are given in Table 1. The primary is an A0 dwarf, orbited by a G5 secondary (Tomkin & Popper, 1986). The age of the system is about 350Myr (Song et al., 2001; Rieke et al., 2005; Vican, 2012).
This system was discovered to have an IR excess with IRAS (Aumann, 1985), and the disk has subsequently been detected with the Spitzer MIPS222Multi-band Imaging Photometer for Spitzer (Werner et al., 2004; Rieke et al., 2004) and IRS333Infra-Red Spectrograph (Houck et al., 2004) instruments (Chen et al., 2006; Rieke et al., 2005; Su et al., 2006). The proximity and brightness mean this system has also been the target of high resolution mid-IR imaging campaigns, with resolution of the disk at 11m (Moerchen et al., 2010). They may have resolved the disk at 18m, but ambiguity arising from artefacts of the observing procedure meant that the results at this wavelength were unclear. The position angle of the extension in the 11m and first 18m images is roughly 350∘, so consistent with the (rather uncertain) binary line of nodes. The images also suggest that the disk is edge on, so the inner part of the disk appears to be aligned with the binary orbital plane.
| Parameter | Symbol (unit) | Value | Uncertainty |
|---|---|---|---|
| Semi-major axis | a (mas) | 8.66 | 0.09 |
| Semi-major axis | a (AU) | 0.2 | 0.002 |
| Eccentricity | e | 0.37 | 0.01 |
| Inclination | i (∘) | 88.2 | 0.1 |
| Ascending node | (∘) | 330 | 20 |
| Longitude of pericenter | (∘) | 311 | 2 |
| Period | P (days) | 17.3599 | 0.0005 |
| Distance | d (pc) | 23.0 | 0.15 |
| 2.58 | 0.045 | ||
| 0.92 | 0.025 | ||
| 59.4 | 1 | ||
| 0.6 | 0.15 |
2.2 Trianguli
The Tri (HD 13161, HIP 10064) system was first recognised as a double lined spectroscopic binary over a century ago (Mitchell, 1909). The orbital period was then found to be 37 days, based on 12 radial velocity measurements. Further study has refined the orbit (Struve & Pogo, 1928; Ebbighausen, 1960) and modern instruments have since resolved the pair allowing a visual orbit to be derived (Hummel et al., 1995). The orbit is now well characterised,444The Washington Double Star Catalogue (WDS, Mason et al., 2001) lists the orbit as “definitive” (grade 5) with the orbital elements given in Table 2. The primary star has a A5IV spectral type (Gray et al., 2003), and as the class IV indicates has probably reached the end of the main-sequence. The spectral type of the secondary is not known, but the mass suggests a mid F-type. There remain uncertainties in this system; as discussed by Hummel et al. (1995), the A5 spectral type is at odds with the mass, and the mass ratio is inconsistent with the luminosity ratio. The system is simply classed as ’Old’ by Trilling et al. (2007). Vican (2012) derive an isochrone age of 730Myr, though this figure is systematically uncertain both due to a relatively small luminosity ratio (so the age may be overestimated) and because Tri lies outside the range encompassed by some isochrone models. The exact age is not particularly important for our purposes here, so we assume it is 730Myr.
Like CrB, this system was first discovered to have an IR excess with IRAS (Sadakane & Nishida, 1986). It was observed with Spitzer MIPS as part of a sample of main-sequence binaries (Trilling et al., 2007), and also observed with IRS in the two longer wavelength modules (14-38m).
| Parameter | Symbol (unit) | Value | Uncertainty |
| Semi-major axis | a (mas) | 8.03 | 0.06 |
| Semi-major axis | a (AU) | 0.312 | 0.002 |
| Eccentricity | e | 0.433 | 0.004 |
| Inclination | i (∘) | 130 | 0.52 |
| Ascending node | (∘) | 245.2 | 0.67 |
| Longitude of pericenter | (∘) | 118.1 | 0.66 |
| Period | P (days) | 31.3900 | 0.0002 |
| Distance | d (pc) | 38.9 | 0.5 |
| 3.5 | 0.25 | ||
| 1.4 | 0.1 | ||
| 74 | 1.4 |
3 Observations
3.1 Herschel
| Target | ObsId | Date | Instrument | Duration (s) |
|---|---|---|---|---|
| CrB | 1342213794 | 7 Feb 2011 | PACS 100/160 | 445 |
| CrB | 1342213795 | 7 Feb 2011 | PACS 100/160 | 445 |
| Tri | 1342223650 | 4 July 2011 | PACS 100/160 | 445 |
| Tri | 1342223651 | 4 July 2011 | PACS 100/160 | 445 |
| CrB | 1342223846 | 9 July 2011 | PACS 70/160 | 445 |
| CrB | 1342223847 | 9 July 2011 | PACS 70/160 | 445 |
| Tri | 1342237390 | 12 Jan 2012 | PACS 70/160 | 445 |
| Tri | 1342237391 | 12 Jan 2012 | PACS 70/160 | 445 |
| Tri | 1342237504 | 14 Jan 2012 | SPIRE 250/350/500 | 721 |
Herschel Photodetector and Array Camera & Spectrometer (PACS, Poglitsch et al., 2010) data were taken for both CrB and Tri at 100 and 160m during routine DEBRIS observations. Subsequently, a Spectral and Photometric Imaging Receiver (SPIRE, Griffin et al., 2010) observation of Tri was triggered by the large PACS excess indicating a likely sub-mm detection. For both targets we also obtained 70m PACS images to better resolve the disks. Because every PACS observation includes the 160m band, we have two images at this wavelength for each target. All observations were taken in the standard scan-map modes for our survey; mini scan-maps for PACS data and small maps for SPIRE. Data were reduced using a near-standard pipeline with the Herschel Interactive Processing Environment (HIPE Version 7.0, Ott, 2010). We decrease the noise slightly by including some “turn-around” data taken as the telescope is accelerating and decelerating at the start and end of each scan leg.
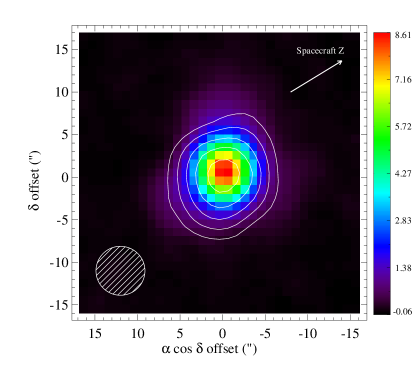
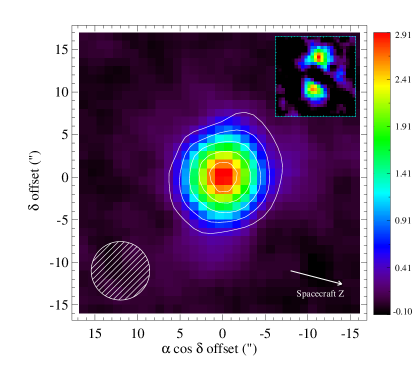
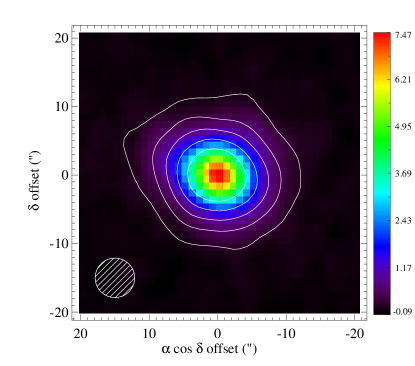
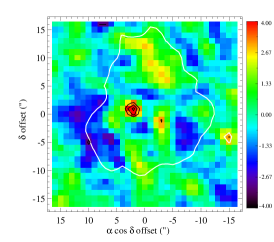
Figure 1 shows the Herschel PACS images of CrB. The disk is not obviously resolved, so the inset shows the residuals from a point-spread function (PSF) fit to the 100m data (an observation of Herschel calibrator Dra generated using the same data reduction method was used as a PSF, see below). The residual emission in the inset is symmetric about the stellar position along a position angle of about 350∘, showing that the disk is most likely resolved with a near edge-on geometry. The emission extends to around 10” (230AU) from either side of the stellar position, suggesting a disk diameter of several hundred AU. The disk does not appear to be resolved along the minor axis, so is consistent with the disk being edge on and aligned with the (eclipsing) binary plane. A PSF fit to the 70m image shows similar results, while the 160m image is unresolved.
Because the CrB disk is not well resolved, it is possible that this extension is affected by variation in the PACS PSF (or beam). Further, a key difference between our method and that used for beam characterisation by the PACS team is that because they are much fainter than the calibration stars our data cannot be re-centered on a frame-by-frame basis, resulting in a slightly larger beam size. Thus, comparison of the Gaussian size in our images with those reported by the PACS team could lead to the conclusion that the disk is slightly more extended than it really is. To characterise the beam variation we have obtained two observations each of the five PACS calibration stars at both 70 and 100m. These observations were nearly all taken using the same mini scan-map mode used by DEBRIS. These data are reduced in the same way as all DEBRIS data, so allow a realistic comparison. The expectation is that each calibration PSF will be slightly different, with the differences across all ten being representative of the uncertainty in the PSF specific to a given science observation.
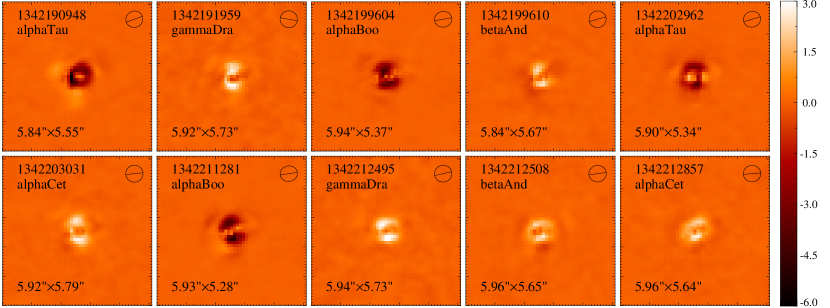
The 70m calibration observations are shown in Figure 2, where each image shows the residuals when the average of all ten observations is subtracted (after the peak is scaled to the same as the observation). All images have been rotated so that spacecraft “Z” is up (spacecraft “Y” is to the right). Each panel shows the observation number (ObsID), star name, and Gaussian major and minor FWHM. The ellipse shows the Gaussian FWHM and the line shows the major axis orientation. Because the expectation is that each observation is independent, the panels are ordered chronologically (i.e. by ObsID). It is clear that the beam width varies at about the 10% level along the minor axis, between 528 for Boo and 579 for Cet. The variation along the major axis is much smaller at about 2%. The beam variation appears to be systematically different for two stars; both the Boo and Tau images show similarly small minor FWHM despite being observed about six months apart. This variation cannot be attributed to circumstellar material because none of the calibration stars have IR excesses. It may be difficult to confirm this possible systematic effect, for example as a function of Solar elongation or declination, as there are only five PACS calibration stars.
The major and minor FWHM of the average 70m PACS beam are 591 and 559, so similar to, but slightly larger than, the values of 576 and 546 found by the PACS team (for a scan speed of 20”/sec).555See PACS Observer’s Manual Based on the variation seen in Figure 2, the uncertainties on these values are about 005 in the major axis (approximately along the spacecraft “Y” direction) and 02 in the minor axis (approximately along the spacecraft “Z” direction).
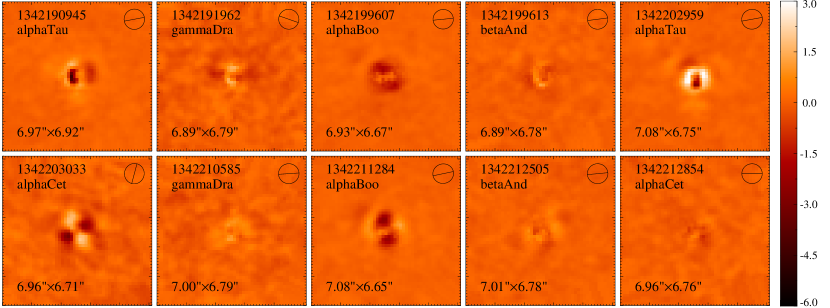
A similar analysis for the 100m beam is shown in Figure 3. The panels are again in chronological order, so the order of the stars is not the same as at 70m. The variation is smaller at this wavelength (2-4%), but some systematic difference for Tau and Boo is still seen. The average major and minor beam FWHM are 695 and 678 (compared to 689 and 669 found by the PACS team), with uncertainties of about 01 in both axes. The lower left panel ( Cet, ObsID:1342203033) shows rather different residuals compared to all others, arising because the observation comprises only one scan direction. This difference shows that aside from variation, the beam is also a function of the observing strategy, and that the strategy should be the same when using calibration stars to analyse science data (e.g. for PSF fitting and image modelling).
Having quantified the beam characteristics specific to our data, we now compare them to the CrB observations. A Gaussian fit to the star-subtracted 70m image finds a position angle of , which is consistent with the ascending node of for the binary. The major and minor FWHM are and . Figure 2 shows that a major axis of the beam is typically perpendicular to the spacecraft Z axis, so the disk position angle is between the major and minor axes, where the beam has a FWHM of about . Therefore, the disk is clearly resolved along the direction of the PA, but at only about 2 significance in the perpendicular direction. Simple deconvolution suggests a disk diameter of about 100AU. This size is much smaller than suggested by the residuals in the inset in Figure 1, indicating that the bulk of the emission is poorly resolved. This structure is perhaps consistent with the mid-IR imaging if CrB hosts warm and cold components that both contribute to the Herschel fluxes but only the cold component is resolved with Herschel. Though the minor Gaussian FWHM is slightly larger than expected, variation in the 70m beam means that the disk is consistent with being edge-on, and therefore aligned with the (eclipsing) binary orbital plane. This analysis also shows that the outer component resolved by Herschel is consistent with being aligned with the inner component resolved in the mid-IR (Moerchen et al., 2010). At 100m the major and minor FWHM are and , yielding a size of about 100AU and a position angle (PA) of . Therefore, at this wavelength the disk is resolved along the disk PA, but not in the perpendicular direction, so is again consistent with being edge-on, and aligned with the binary plane. We return to the issue of beam variation when creating resolved models of the CrB disk in §4.2.
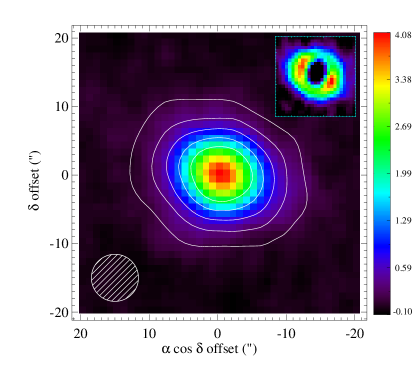
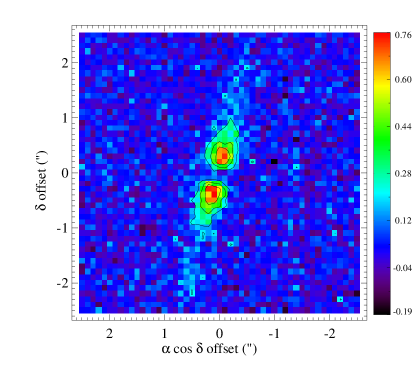
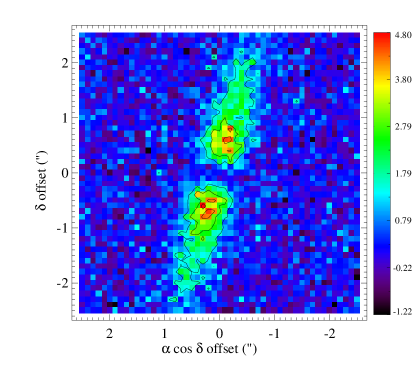
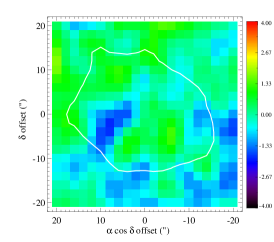
The Tri images are shown in Figure 4. Compared to the beam size, the disk around Tri is clearly resolved at 70 and 100m. The disk is also resolved at 160m, but not at the SPIRE wavelengths of 250-500m. A Gaussian fit to the star-subtracted image at 70m finds major and minor FWHM of and at a PA of . Simple Gaussian deconvolution suggest a disk size of about 270AU, and an inclination of about . At 100m the FWHM are and at a PA of , suggesting a size of about 300AU and inclination of . At 160m the FWHM are and at a PA of (the 160m beam is elongated and about 107 by 121). The 160m image is therefore poorly resolved, but suggests an approximate size of 300-370AU. Taken together, these angles mean that in this system the disk is again consistent with being aligned with the binary plane. The increasing disk size with wavelength suggests that the disk may be extended.
The flux density in the PACS images for both CrB and Tri is measured using apertures and the SPIRE fluxes with PSF fitting. The measurements are given in Table 4. The uncertainties include both statistical and systematic uncertainties due to repeatability and calibration (see Kennedy et al., 2012, for further comments on calibration).
| Target | Band | Flux (mJy) | Uncertainty (mJy) | Method |
|---|---|---|---|---|
| CrB | PACS70 | 515 | 26 | 15” aperture |
| CrB | PACS160 | 69 | 5 | PSF fit |
| CrB | PACS100 | 235 | 12 | 15” aperture |
| CrB | PACS160 | 66 | 5 | PSF fit |
| Tri | PACS70 | 641 | 32 | 20” aperture |
| Tri | PACS160 | 264 | 17 | 25” aperture |
| Tri | PACS100 | 481 | 23 | 20” aperture |
| Tri | PACS160 | 264 | 16 | 25” aperture |
| Tri | SPIRE250 | 87 | 7 | PSF fit |
| Tri | SPIRE350 | 35 | 5 | PSF fit |
| Tri | SPIRE500 | 5 | 5 | PSF fit |
3.2 Spitzer
As noted above, both systems were observed by Spitzer with the MIPS and IRS instruments. The MIPS photometry is taken from Phillips (2011), and the IRS spectra retrieved from the Cornell Atlas of Spitzer/Infrared Spectrograph Sources (CASSIS, Lebouteiller et al., 2011). The PACS and MIPS 70m measurements are consistent (mJy for CrB and mJy for Tri). Though we instead use the PACS images, Tri is clearly resolved at 70m with Spitzer.
4 Models
4.1 SEDs
We first model the stellar and disk photometry to derive approximate disk temperatures and fractional luminosities. This photometry is collected from numerous catalogues (Morel & Magnenat, 1978; Moshir et al., 1993; Hauck & Mermilliod, 1997; Perryman & ESA, 1997; Høg et al., 2000; Cutri et al., 2003; Mermilliod, 2006; Ishihara et al., 2010; Phillips, 2011; Lebouteiller et al., 2011). Photometry and colours at wavelengths up to 9m are used to model the stellar photosphere, using the PHOENIX Gaia grid (Brott & Hauschildt, 2005). The best fit model is found by least squares minimisation. At wavelengths longer than 9m we model the excess emission above the photosphere with a simple modified blackbody function; at wavelengths beyond the blackbody is multiplied by .
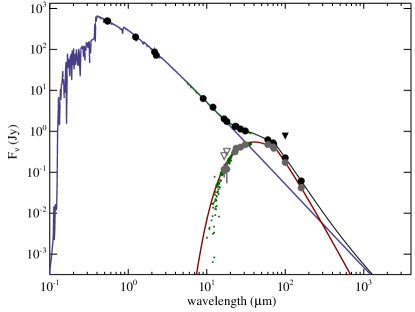
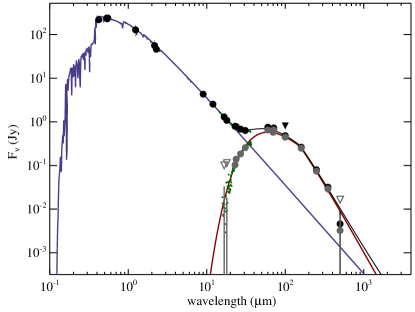
The spectral energy distributions (SEDs) are shown in Figure 5. The best fitting stellar model for CrB has K, , and , and for Tri has K, , and . Because no photometry resolves either binary, these parameters simply describe what the total stellar emission spectra look like, and are not physical. The CrB disk model has temperature K, fractional luminosity , corresponding to a total grain surface area AU2 for blackbody grains, and m and . The Tri model has temperature K, , total grain surface area AU2 for blackbody grains, and m and .
Despite the suggestion of warm dust by mid-IR imaging (Moerchen et al., 2010), the CrB disk SED, most notably the IRS spectrum, does not require dust at multiple temperatures. The inferred disk radius assuming blackbody properties for the single component fit to the SED is 40AU, well beyond the few AU scale of the mid-IR emission. The SED does not strongly preclude the existence of warm dust however, because it is limited by the 2% level that is achievable with typical photometric calibration, and a similar uncertainty for the IRS spectrum. Therefore, at 10-20m an excess of 100mJy could be present yet not confidently detected. How this limit converts to a limit on the fractional luminosity depends on the dust temperature (e.g. Wyatt, 2008). In the case of 300K dust the limit on the fractional luminosity is about , so only about a factor of two lower than derived from the 124K disk SED above.
For Tri the blackbody radius is larger at around 95AU. This size is somewhat smaller than the 150AU derived from the Gaussian fitting, but as noted above the disk could be extended. Aside from being marginally resolved with MIPS, there are no constraints on the structure from other observations.
4.2 Images
The main goal of modelling the resolved images is to derive the orientation of the disk in space, for comparison with the orientation of the binary orbital plane. Though alignment is already suggested by Gaussian fitting in both cases, the PACS beam is not azimuthally symmetric so resolved modelling provides a worthwhile check. To achieve this goal, we must find a spatial structure that reproduces the images satisfactorily. The models are generated using the method described in Wyatt et al. (2012) (see also Kennedy et al., 2012). Basically, a high resolution model of the structure is generated and multiplied by the grain emission properties at each wavelength. The structure is the spatial distribution of dust, implemented as the cross-sectional area as a function of radial distance from the star. The distribution is disk-like with a small range of particle inclinations and the dust’s face-on optical depth () is parameterised as a function of radius by one or more power laws. The grain emission properties are simply described with a modified blackbody whose temperature decreases with radial stellocentric distance as a power-law. The high resolution models are then created with some spatial orientation and convolved with the instrument beam for comparison with the observed images. The large number of model parameters, as well as different possible configurations (e.g. extended disks vs. multiple rings) means that we do not undertake a grid search of possible parameter spaces. The final models are found by a combination of by-eye fitting and least-squares minimisation.
Our general approach to modelling is to use the simplest model possible to explain the data in hand, increasing the model complexity as required. Here, we find that the simplest model, a narrow ring, is not sufficient to reproduce the PACS images for either system. As a second step we use extended dust distributions, though two discrete narrow rings is also a possibility (e.g. Wyatt et al. 2012), as is the inclusion of an unresolved component. Because we do not use a grid approach, estimating uncertainties on model parameters, many of which are highly degenerate, is made more difficult, However, we find that multiple different configurations can reasonably reproduce the data, which gives an idea of how well the data constrain the disk structure given the relatively poor resolution compared to the disk sizes. Similarly, we find no requirement for the temperature distribution to deviate from a simple blackbody relation (K, where is the binary luminosity in Solar units, and is the disk radius in AU). We do not claim this is the true temperature distribution, given that grain temperatures are expected to be somewhat different (hotter) than the blackbody relation suggests, but that there is insufficient information to quantify this difference.
4.2.1 CrB

We first model CrB, for which about half to two thirds of the Herschel emission is unresolved, with the remainder more distant from the stellar position and resolved (see Fig. 6). This large level of unresolved flux means that different models of the system can satisfy the observations, with the main constraint being that mid-IR emission must be detected only within a few AU of the star. Because this detection could be the Wein side of the emission, it does not preclude the existence of material just beyond a few AU. That is, the mid-IR emission does not indicate that no dust exists where it was not detected, because it could be cool enough to evade detection.
The size of the 11m images (described in §2.1, Moerchen et al., 2010) compared to the reference PSF suggests a disk radius of about 2.3AU. Given that this warm emission cannot be resolved by Herschel, there must either be (at least) two separate disk components (i.e. inner and outer components), or a continuous disk that extends from a few to a few hundred AU, whose structure appears different at different wavelengths due to the changing temperature with radial distance.
As an example, the Herschel data and SED can be modelled with an outer disk that extends from 45-195AU with a decreasing face-on optical depth , and an unresolved inner component at a temperature of 120K. The outer component has a position angle of 345∘ and is edge-on, so consistent with being aligned with the binary orbital plane. The interpretation of this model is that the unresolved emission is distributed such that some dust is close enough to the star to provide the mid-IR emission and structure, while most of it lies distant enough from the star so that overall it appears to have a temperature of 120K. However, the distance inferred for a blackbody at 120K around CrB is 40AU, or 18, which is relatively large given the 6-7” FWHM PACS beam at 70-100m, and should be detectable in the images.
We therefore use a more complex two power-law model, in which the disk extends continuously from very near the star to several hundred AU. The surface density increases from the inner edge to some break radius, beyond which it decreases to the outer edge. This model has the advantage that it is extended near the binary, so may be able to explain the mid-IR emission without invoking a separate warm component. Such a surface density structure may be expected, because debris disk decay (and stirring in some models) is an inside out process (e.g. Kenyon & Bromley, 2004; Wyatt et al., 2007a; Kennedy & Wyatt, 2010; Mustill & Wyatt, 2009).
Figure 6 shows the results of implementing this model, where the dust extends from 1AU to 300AU, with the break radius at 50AU. The inner edge of 1AU corresponds to the inner limit of stability for particles orbiting the CrB binary (e.g. Holman & Wiegert, 1999). The optical depth of the inner component is . For the outer component . The disk temperature has a blackbody dependence, with K. As can be seen from the SED (Fig. 5), some modification of the blackbody function is needed, with m and for the inner component and m and for the outer component. The poor resolution relative to the disk size means that these parameters are poorly constrained with strong degeneracies. There is a factor of eight drop in surface density at the break radius; attempts to keep the dust distribution continuous within the two power-law model were unsuccessful because the outer component is fairly extended but with low surface brightness. Joining the outer component smoothly to the inner component results in too much flux just beyond the break radius. Such a drop is an expected feature of some disk evolution models (e.g. Kennedy & Wyatt, 2010), a point we return to in §6. The extent of the outer component is not very well constrained because the surface brightness decreases strongly with radius. The disk model has a position angle of 345∘ so is consistent with the binary line of nodes. The disk is edge on, so again consistent with being coplanar with the binary orbit. The images show significant residuals for changes of 10-20∘ in both inclination and PA, giving an indication of their uncertainties.
The two models considered above show similar residual structure when the model is subtracted from the observations. The only sizeable (3) residual related to the star+disk is located on one side of the stellar position at 70m. With the simple models considered here, similar residuals remain for a range of PSFs (i.e. those shown in Fig. 2), even if the opening angle of the inner disk component is allowed to vary (as might be expected if this component was misaligned with the outer component, see §5 below). Our inability to construct a model that accounts for these residuals leads us to conclude that they are likely due to the beam variations discussed in §3. Alternatively, there may be additional structure unaccounted for by our model, which would have a scale of a few arcseconds to leave such small residuals. While the mid-IR images suggest that our coplanar configuration is representative, these observations should be repeated, specifically at 18m, as a further test of disk coplanarity and structure near the star.
To compare the extended model with the resolved structure seen in the mid-IR by Moerchen et al. (2010), Figure 7 shows synthetic images at 11 and 18m, where we have convolved the star+disk models with appropriately sized Gaussian PSFs, added noise, and then subtracted the PSFs scaled to the image peak (i.e. the same method used by Moerchen et al., 2010, to detect extension). The background noise level is calculated from the photometric uncertainties of 2 and 15mJy at 11 and 18m respectively, assuming aperture radii of 20. In these images we have multiplied our model by a factor of two at 11m, and five at 18m to make them appear similar to the mid-IR observations, and show how the observed mid-IR structure could arise from an extended disk. A factor of two at 11m results in a disk flux of 65mJy, so is reasonable given the uncertainty in the disk flux at this wavelength, which is limited by the calibration of the photosphere and IRS spectrum. The factor five at 18m results in a disk flux of 1000mJy, which is less reasonable and would make the disk flux inconsistent with the IRS and AKARI measurements. Our disk model is therefore fainter at 18m than could be detected with the mid-IR imaging. That the 18m observations suffer from artefacts due to the observing procedure is the likely explanation, providing further motivation for repeating these observations.
4.2.2 Tri
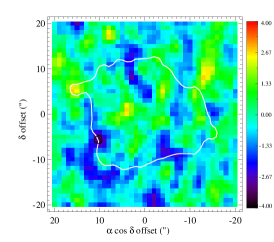
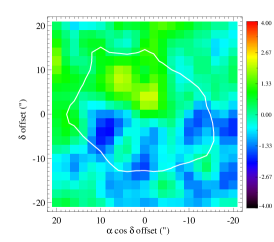
The simplest Tri model is shown in the top row of Figure 8. We found that the images could not be modelled as a single narrow ring, so first allowed the inner and outer disk edges to vary with a power-law surface density profile in between. This model extends from 50-400AU with an optical depth of . The temperature dependence is again that for a blackbody (K), with m and . The disk outer edge is not well constrained by the PACS images, but is constrained to some degree by not being resolved with SPIRE at 250m. The position angle and inclination are 67∘ and 46∘ respectively. Variation of the inclination by 10∘ leaves significant residuals compared to the data, as does a similar change in the position angle. The position angle of the binary plane is 65∘ so is easily consistent with that found for the disk. The inclination of the binary plane is 40∘, so not significantly different to that found for the disk. While the inclination is fairly well constrained the disk opening angle is not, with values between 0-50∘ giving similarly good fits (though lower disk opening angles are preferred). As we discuss in detail below in §5, this ambiguity can be resolved by considering circumbinary particle dynamics.
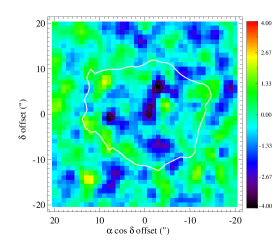
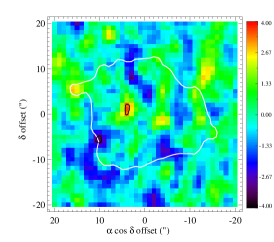
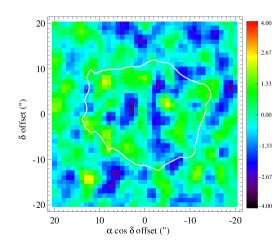
As with CrB, we also tried a continuous surface density profile by adding an inner component to the first model. This continuous model extends from the innermost stable orbit at about 4AU Holman & Wiegert (1999) out to 500AU with the surface density peaking at 100AU and is equally successful at reproducing the Herschel images (bottom row of Fig 8). In this model we restricted the inner component to join smoothly to the outer component; without this restriction the inner component can be arbitrarily small and the model no different to the extended one above. The inner component has an optical depth of , and the outer component decreases with an index of -1.7. The temperature is for a blackbody as above, with m and for the inner component and m and for the outer component. As with CrB, these parameters are poorly constrained and highly degenerate.
While these two models show that the radial and vertical disk structure is poorly constrained, both suggest that the disk optical depth decreases beyond a maximum that lies around 60-100AU. Interior regions may be depleted as in the continuous model, or completely empty. Despite these uncertainties, our main conclusion that the disk is consistent with being aligned with the binary orbital plane is robust.
5 Dynamics
The main result of the resolved modelling is that the disks are both consistent with being aligned with the orbital planes of the host binaries. Whether this alignment simply reflects the initial debris disk+binary configuration at the end of the protoplanetary disk phase, or subsequent evolution requires some study of the expected dynamics.
Disk particles exterior to a pair of orbiting bodies (in our case a binary star system) are subject to secular perturbations that modify the particle orbits on long timescales. How the particle orbits are modified depends on the properties of the binary, particularly the mass ratio and binary eccentricity, but also depends on the particle orbits themselves (Verrier & Evans, 2009; Farago & Laskar, 2010; Doolin & Blundell, 2011). If the stars in the binary have similar masses, the effect on particle eccentricities is smaller than for larger mass ratios (Moriwaki & Nakagawa, 2004; Kennedy et al., 2012). In contrast, the changes in particle inclinations and nodes can be significant. If the angle between the particle and binary orbital planes is small (i.e. particles have low inclinations with respect to the binary plane, we quantify “small” and “large” inclinations below), particle inclinations oscillate about the binary plane. Therefore, while a disk of such particles will have an opening angle double the initial misalignment, it will also appear to be aligned with the binary plane. The best example is the warp in the Pictoris disk, which was proposed to be due to perturbations by a planet misaligned with the disk plane (Mouillet et al., 1997; Augereau et al., 2001) that was subsequently discovered (Lagrange et al., 2009, 2010). For large differences between the particle and binary planes (i.e. high inclinations with respect to the binary plane), particle inclinations are coupled to the evolution of their line of nodes, and oscillate around a polar orbit. In the context of a debris disk these particles evolve into various structures depending on the degree of initial misalignment (Kennedy et al., 2012). Within the high-inclination family of orbits, only disks that are initially misaligned by about 90∘ and have their line of nodes perpendicular to the binary pericenter will not be strongly perturbed and continue to appear disk-like.
The dividing line between “large” and “small” relative inclinations, and thus the different families of disk structures, was quantified by Farago & Laskar (2010). For CrB with the critical angle is 48∘, for Tri with the critical inclination is 43∘ (for an ascending node of 90∘). Thus, if the disk inclination relative to the binary plane was initially larger than 48 and 43∘ respectively for these systems, it could not become aligned with the binary plane.
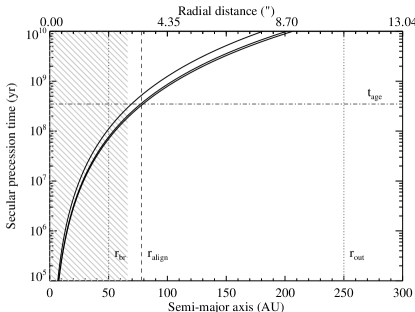
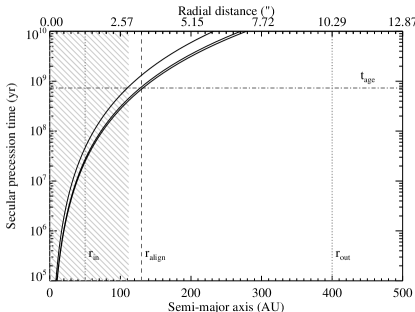
While particles with initial inclinations lower than the critical angle can become aligned, the finite secular precession time means that they will only be aligned if they have been perturbed over a sufficiently long period. The timescale for alignment is given by Farago & Laskar (2010), and is shown for an arbitrarily small initial disk-binary plane inclination, and for initial misalignments of 20 and 40∘ for CrB and Tri in Figure 9. Particles with semi-major axes that lie to the left of where the curves intersect a given system age (i.e. less than ) have completed at least one cycle of secular evolution. The hatched region indicates the region where PACS cannot resolve the disk at 70m, so shows where the disk structure is poorly constrained by Herschel observations.
The CrB system is about 350Myr old, so the inclinations of particles within about 80AU will be symmetric about the binary orbital plane. Beyond this distance however, particles have not yet had time to undergo a complete cycle of secular precession and will retain their original orbital inclinations. The transition between these regions is not sharp due to the finite secular precession time (see Fig. 1 of Augereau et al., 2001). Figure 9 also shows that the alignment distance is about the same as the inner extent of the PACS resolution at 70m. Thus, the disk structure that is constrained by the PACS images lies beyond , and the alignment with the binary plane cannot arise due to secular perturbations. This conclusion is strengthened by the finding that the orientation as seen by Herschel is consistent with the inner disk as seen in the mid-IR.
In the Tri disk, particles beyond AU are too distant to be significantly affected by secular perturbations from the binary, assuming an age of 730Myr. Because we find that the disk extends well beyond this distance, the alignment of the binary orbital and disk planes are again most likely primordial. Though we could not constrain the disk opening angle well, the assumption that it is small is reasonable based on i) observations that edge-on debris disks typically have small opening angles (e.g. Krist et al., 2005; Golimowski et al., 2006), and ii) that secular perturbations could not have increased the scale height at the distances resolved by the Herschel observations.
6 Discussion
By considering the resolved models and expected dynamics, we have shown that the circumbinary debris disks in both the CrB and Tri systems probably formed coplanar with their parent binaries. A corollary is that because the disks were primordially aligned, there should be little vertical structure inside the alignment radius. Both disks were successfully modelled as disks with a single plane of symmetry, but are too poorly resolved with Herschel to strongly verify this statement. However, for CrB the low-level contours from the 11 and 18m mid-IR imaging suggest that the inner disk has a similar position angle to the binary and outer disk. Only one of the 18m images shows the same position angle, though the fact that the other is actually narrower than the PSF in the same direction makes this extension questionable, as discussed by Moerchen et al. (2010).
While there appears to be no need or evidence for vertical disk structure induced by perturbations to disk particles’ inclinations, an indirect signature could exist from inclination and eccentricity variations imposed on disk particles. These variations “stir” the disk, where we are defining “stirring” to be any mechanism that increases relative velocities between particles sufficiently that collisions become catastrophically destructive, thus initiating a collisional cascade. In stirred regions mass at the small end of the collisional cascade is removed by radiation forces, thus depleting the disk. In unstirred regions the mass remains constant. The size distribution in stirred regions has many more small grains for a given mass in large objects, so is more easily detected due to the larger emitting surface area.666Once catastrophic collisions are occurring, the level of stirring is also important. An increase in stirring does not have a significant effect on the collision rate between particles of similar sizes because higher velocities are accompanied by a lower volume density of particles (e.g. the scale height and/or radial disk extent increases with the velocities). However, particles are typically destroyed in a collision with a much smaller particle, whose size is set by the collision velocity. Thus, higher levels of stirring mean that smaller particles are capable of destroying objects. In standard collisional size distributions (e.g. Dohnanyi, 1969) the number of particles, and therefore the number of potential destructive impactors, increases strongly with decreasing size, so the disk depletion rate due to collisions increases with increased stirring.
Though the structure of the inner disk is not well constrained, we have shown that a plausible model that satisfies both the Herschel and mid-IR data for CrB has a continuous optical depth profile that peaks around 50AU. Because the typical expectation from Solar System and protoplanetary disk studies is for the surface density to decrease with distance from the star (e.g. Weidenschilling, 1977; Andrews et al., 2009), this profile can be interpreted as a depletion of material inside 50AU. Such a depletion is expected in standard models of collisional evolution, where the disk decay rate is faster at smaller semi-major axes (e.g. Dominik & Decin, 2003; Wyatt et al., 2007a). This 50AU turn-over distance is similar to shown in Figure 9, so it is therefore plausible that the depletion inside here is due to increased velocities imposed by binary perturbations.
Considering this binary stirring picture in more detail, vertical (inclination) stirring is probably more important than radial (eccentricity) stirring in circumbinary disks, particularly when the disk lies at large distances relative to the binary separation. As the binary mass ratio decreases (i.e. the stars’ masses become more similar), the eccentricities imposed on an exterior particle decrease. For example, using the expression derived by Moriwaki & Nakagawa (2004), the “forced” eccentricity of particles at 50AU around CrB is about 0.001, at least an order of magnitude lower than the eccentricities thought to exist in observed debris disks (e.g. Kenyon & Bromley, 2004; Krivov et al., 2008). In contrast, for inclination stirring to be effective the initial disk plane would only need to be a few degrees different to the binary plane (though some non-zero eccentricity is needed to ensure crossing orbits). For example, with an initial misalignment of 1∘, collision velocities are stirred to about 0.02 times the Keplerian velocity (150m s-1 at 50AU), so objects with dispersal thresholds less than roughly J kg-1 (10km) will be disrupted and dispersed in collisions with similar sized objects. Therefore, the disk decays from the inside-out as secular perturbations increase the relative velocities in particle collisions by aligning the disk, and do so on a shorter timescale closer to the central star(s). Assuming that the initial misalignment was large enough, collisions will be destructive inside some radius that will be close to (but not exactly at , Mustill & Wyatt, 2009). Outside this radius, collisions are unaffected by the presence of the binary and therefore not destructive, providing a possible explanation for the drop in optical depth in our model beyond 50AU.
While the CrB disk is consistent with being stirred by the binary, we also consider two alternative stirring mechanisms. The first is “pre-stirring” in which objects are assumed to have been stirred at some very early time by an unspecified mechanism that does not necessarily still operate (e.g. a stellar flyby or the result of gas disk dispersal). A potential issue with such a scenario is that collisional damping may reduce the velocities sufficiently that collisions are not catastrophic for a significant fraction of the stellar main-sequence lifetime (e.g. Kenyon & Bromley, 2002; Goldreich et al., 2004). Whether collisional damping is important depends on the relative sizes of the objects and their destructive impactors, which in turn depends on the relative velocities. If pre-stirred objects can reach sufficiently high eccentricities (0.1, though the value depends on object strength and stellocentric distance), then the disk can remain stirred for the stellar lifetime (Shannon & Wu, 2011). Such a disk is depleted radially from the inside-out, again because the depletion rate is a strong function of radius. The type of structure that is expected is therefore a radially increasing optical depth profile, which turns over and decreases where collisions have yet to deplete the disk significantly (e.g. Kennedy & Wyatt, 2010). Using equation (6) from Kennedy & Wyatt (2010) we find for the best fit planetesimal properties from (Wyatt et al., 2007b) that the CrB disk would be depleted within 50AU if the disk was stirred from an arbitrarily early time (e.g. pre-stirred) and was about 5-15 times less massive than the solid component of the minimum-mass Solar nebula (MMSN, Weidenschilling, 1977, when scaled linearly with the binary mass).777We are not necessarily suggesting that the solid mass in the primordial protoplanetary disk was similarly depleted relative to the MMSN, as the mass could for example have gone into building planets. However, given the large observed dispersion in protoplanetary disk masses in star forming regions, such a depletion is easily possible (e.g. Andrews & Williams, 2005)
The second mechanism is “self-stirring”, where random velocities are initially slow enough that collisions result in accretion and growth. Once the largest objects reach roughly Pluto-size, they increase the velocities of smaller planetesimals and initiate a collisional cascade, and the production of visible levels of dust (Kenyon & Bromley, 2004). Again, this process works in a radially inside-out fashion, so a self-stirred disk looks similar to a pre-stirred one, with one key difference. Because planetesimals have not been stirred outside where Pluto-sized objects have formed, collisions do not result in a collisional cascade and the disk should show a drop in optical depth beyond this distance (Kennedy & Wyatt, 2010). Using equation (9) from Kennedy & Wyatt (2010), for Pluto-sized objects to stir the disk to only 50AU by 350Myr, the disk would have to be 2000 times less massive than a scaled MMSN (see also Kenyon & Bromley, 2008, from which the Pluto-formation and stirring times were derived). A disk with such low mass would not be visible in a self-stirring scenario (e.g. Kenyon & Bromley, 2008), which appears to disfavour this scenario. However, this calculation assumed that the planetesimals started out with 1m-1km sizes. If the planetesimals were initially much larger, the time to form Pluto-sized objects would also be longer (e.g. Kenyon & Bromley, 2010). This longer formation time would mean that a more massive disk, which would be correspondingly brighter and therefore more consistent with the observations, could form Pluto-sized objects and stir the disk only as far as 50AU by 350Myr.
Therefore all stirring models appear consistent with the observed peak in surface density at 50AU. However, the model derived in §4.2 required a drop in surface density beyond 50AU, a feature expected in self-stirred and binary-stirred disks, which would appear to disfavour a pre-stirred interpretation, but not discern between self and binary-stirring. A caveat on this conclusion is that the disk structure is poorly constrained by the low resolution of the observations, and the dust observed with Herschel may not trace the parent body locations, particularly in the outer regions. For example, the peak at 50AU may simply represent the outer edge of a parent body disk that is pre-stirred, and the (decreased) emission beyond 50AU could arise from small grains originating at 50AU forced onto larger eccentric orbits by radiation pressure (e.g. Thébault et al., 2003; Krivov et al., 2006).
Regardless of the stirring mechanism, we can compare the disk structures with those expected if they decayed from some arbitrarily large level. In this picture the face-on geometrical optical depth (with the same assumptions used above) is
| (1) |
where is the stellar mass in Solar units and is the system age in Myr (Kennedy & Wyatt, 2010, equation 8). The dependence gives the expected radial profile of a disk whose planetesimal properties are the same everywhere. With these assumptions, for CrB the expected optical depth at 350Myr is at 1AU, which is somewhat smaller than the model value of . Given that there is considerable uncertainty in the planetesimal properties and the true dust distribution, we do not consider this difference a cause for concern. The model does not increase as strongly with radius as Equation (1), so is below the expected level outside a few AU anyway. That the disk model has a dependence rather than could indicate that the planetesimal properties have a radial dependence, for example that they become smaller or weaker at larger distances (the model parameters are very uncertain however, so such a dependence is not required).
The Tri data are consistent with a continuous optical depth profile that peaks around 100AU. Given that the secular precession time depends strongly on semi-major axis, and that the stellar age is uncertain, this distance is not significantly inside and the disk is therefore plausibly binary stirred. The expected optical depth at 730Myr is at 1AU, which is smaller than the model value of . Again, the discrepancy is not particularly large given the model assumptions and uncertainty. Using the same equations as above, the Tri disk would be depleted out to 100AU by 730Myr for a disk 1-5 times less massive than a scaled MMSN if it were stirred from the outset. Stirring by Pluto-formation out to this distance only requires a disk 400 times less massive than a scaled MMSN (but again could be more massive if planetesimals are larger). Thus, the disk could be depleted out to 100AU by collisional evolution, but the stirring mechanism is unclear. Unlike CrB, which has a mid-IR detection, there is no evidence for warm emission in the Tri system. Such a detection could break the degeneracy in our models, which cannot tell whether the regions inside 50-100AU are devoid of debris (e.g. due to dynamical clearing by planets), or simply depleted by collisional evolution.
This “standard” picture of debris disk stirring and evolution is not the only possibility. For example, catastrophic collisions may be caused due to crossing orbits in a disk where self-gravity is important, with the additional possibility that such disks may appear non-axisymmetric (Jalali & Tremaine, 2012). It is also possible that some observed debris disks are not stirred to catastrophic collision velocities at all. Heng & Tremaine (2010) show that long-lived “warm” planetesimal disks could exist, in which collisions are not typically disruptive. They suggest that a test for such a scenario is that the disk spectrum should look like a blackbody, because the disk particles required for such warm disks to survive are large enough that they act like blackbodies (i.e. absorb and emit light efficiently). For the two systems considered here the disk spectra appear to rule out such a scenario because they lie significantly below pure blackbodies beyond wavelengths of about 100m (Fig. 5), suggesting that the particles are emitting inefficiently at long wavelengths and are predominantly smaller than 1mm. However, we do not exclude the possibility that the disks are “warm”, because the small grains that are observed could have been created in erosive and bouncing collisions. Modelling the size distribution would make more quantitative predictions to test this possibility.
Though both disks have extended or continuous dust distributions as observed by Herschel, the parent bodies may (or may not) be more localised. All the models we considered find that the dust optical depth decreases with distance in the outer regions. Qualitatively, this structure is expected when the parent bodies occupy a narrow “birth” ring and small grains are placed on eccentric and hyperbolic orbits (e.g. Strubbe & Chiang, 2006; Müller et al., 2010). However, it is also possible that the observed extent reflects the underlying parent body distribution, as might be argued for CrB, which has dust detected both near and far from the star. Alternatively, the drop in optical depth beyond 50AU required by the continuous CrB model may be a sign that the parent planetesimals lie relatively close to the star and that the more distant dust comprises small grains on eccentric and hyperbolic orbits.
Whether debris disks are typically rings or more extended structures is an open question (e.g. Kalas et al., 2006), in part because obtaining sufficiently high resolution sub-mm observations, those most sensitive to larger grains, is challenging. This ambiguity has only been overcome in a few nearby systems, where a parent body ring has been resolved at sub-mm wavelengths and is seen to be narrower than the radial extent of small grains (Kalas et al., 2004; Wilner et al., 2012; Boley et al., 2012; Acke et al., 2012). With the development of facilities such as the Atacama Large Millimeter Array (ALMA) and the Northern Extended Millimeter Array (NOEMA), the detection and resolution of larger parent body populations will become possible and will provide insight into the processes that set where planetesimals form and reside.
Looking at the issue of alignment from a wider perspective, coplanarity is the expected outcome for debris disks and planetary systems emerging from the protoplanetary disk phase for small to medium binary separations (e.g. Bate et al., 2000). However, only a few examples where the outcome can be tested actually exist. Three systems with transiting circumbinary planets, in which the stars are also eclipsing binaries, show that well aligned systems are a possible outcome (Doyle et al., 2011; Welsh et al., 2012). Further, Welsh et al. (2012) find that the occurrence rate of aligned circumbinary planets is probably consistent with the rate for circumstellar planets with similar properties, suggesting that alignment is the typical outcome. However, they acknowledge significant biases exist, and that further work is needed to understand the implications of these discoveries for circumbinary planetary system alignment and frequency.
In the case of circumbinary debris disks, only four systems where the disk and binary alignment can be tested exist; CrB, Tri, 99 Herculis (Kennedy et al., 2012), and HD 98800888A weak accretion signature has recently been detected for 10Myr old HD 98800 (Yang et al., 2012), suggesting that it lies somewhere between the protoplanetary and debris disk phases. (Boden et al., 2005; Andrews et al., 2010). Of these, CrB and Tri are close binaries with periods of several weeks and HD 98800 has a period of 314 days, while 99 Her has a semi-major axis of 16.5AU and a 56 year period. With only these systems we cannot yet be sure of what trends will emerge. As hinted by the disk-binary alignment of CrB, Tri, and HD 98800, and the misalignment for 99 Her, it may be that more widely separated systems are more likely to be misaligned. It will also be interesting to test whether stirring by secular perturbations from binaries is important for disk evolution. This hypothesis could be tested by comparing disk sizes (and structure where possible) with the radii at which secular perturbations can have reached within the system lifetime for a larger sample.
7 Summary
We have presented resolved images of debris disks around the nearby close binary systems CrB and Tri. These systems are relatively unusual among binaries because their orbital configurations are relatively well known, allowing a test for (mis)alignment between the disk and binary orbital planes. In both cases we find that the disk and binary are most likely aligned. Though secular perturbations can align systems over time, the bulk of the resolved disk structure in these systems is too distant to be affected. Therefore, the alignment is most likely primordial, suggesting that the binary + protoplanetary disk system from which the debris disk emerged was also aligned. These initial conditions are consistent with expectations of alignment in protoplanetary disk+binary systems where the binary has a separation less than about 100AU (Bate et al., 2000).
Secular perturbations from the binary could provide the stirring mechanism in circumbinary disks, and both CrB and Tri are consistent with such a picture. However, they are also consistent with other stirring mechanisms. While binary stirring may happen, it cannot be the only mechanism because debris disks are observed with a similar frequency in both single and multiple star systems (Trilling et al., 2007).
These two systems bring the number in which debris disk-binary alignment can be tested to four. Three of these ( CrB, Tri, and HD 98800) have orbital periods of several weeks to a year and appear to be aligned, while 99 Her has a period of 50 years and is strongly misaligned. It is too early to draw conclusions about typical outcomes in such systems, but the results so far suggest that misalignment cannot be extremely rare, and may be preferred in systems with wider binary separations.
Acknowledgments
Our thanks to Jonti Horner for his comments on a draft of this article, and to the referee for comments that improved the discussion and overall clarity. This research has made use of the Washington Double Star Catalog maintained at the U.S. Naval Observatory. This work was supported by the European Union through ERC grant number 279973.
References
- Acke et al. (2012) Acke, B. et al. 2012, A&A, 540, A125
- Andrews et al. (2010) Andrews, S. M., Czekala, I., Wilner, D. J., Espaillat, C., Dullemond, C. P., & Hughes, A. M. 2010, ApJ, 710, 462
- Andrews & Williams (2005) Andrews, S. M. & Williams, J. P. 2005, ApJ, 631, 1134
- Andrews et al. (2009) Andrews, S. M., Wilner, D. J., Hughes, A. M., Qi, C., & Dullemond, C. P. 2009, ApJ, 700, 1502
- Augereau et al. (2001) Augereau, J. C., Nelson, R. P., Lagrange, A. M., Papaloizou, J. C. B., & Mouillet, D. 2001, A&A, 370, 447
- Aumann (1985) Aumann, H. H. 1985, PASP, 97, 885
- Bate et al. (2000) Bate, M. R., Bonnell, I. A., Clarke, C. J., Lubow, S. H., Ogilvie, G. I., Pringle, J. E., & Tout, C. A. 2000, MNRAS, 317, 773
- Boden et al. (2005) Boden, A. F. et al. 2005, ApJ, 635, 442
- Boley et al. (2012) Boley, A. C., Payne, M. J., Corder, S., Dent, W. R. F., Ford, E. B., & Shabram, M. 2012, ApJ, 750, L21
- Brott & Hauschildt (2005) Brott, I. & Hauschildt, P. H. 2005, in ESA Special Publication, Vol. 576, The Three-Dimensional Universe with Gaia, ed. C. Turon, K. S. O’Flaherty, & M. A. C. Perryman, 565
- Chen et al. (2006) Chen, C. H. et al. 2006, ApJS, 166, 351
- Churcher et al. (2011) Churcher, L. J. et al. 2011, MNRAS, 417, 1715
- Cutri et al. (2003) Cutri, R. M. et al. 2003, 2MASS All Sky Catalog of point sources.
- Dohnanyi (1969) Dohnanyi, J. S. 1969, J. Geophys. Res., 74, 2531
- Dominik & Decin (2003) Dominik, C. & Decin, G. 2003, ApJ, 598, 626
- Doolin & Blundell (2011) Doolin, S. & Blundell, K. M. 2011, ArXiv e-prints, (1108.4144)
- Doyle et al. (2011) Doyle, L. R. et al. 2011, Science, 333, 1602
- Ebbighausen (1960) Ebbighausen, E. G. 1960, Publications of the Dominion Astrophysical Observatory Victoria, 11, 277
- Farago & Laskar (2010) Farago, F. & Laskar, J. 2010, MNRAS, 401, 1189
- Goldreich et al. (2004) Goldreich, P., Lithwick, Y., & Sari, R. 2004, ARA&A, 42, 549
- Golimowski et al. (2006) Golimowski, D. A. et al. 2006, AJ, 131, 3109
- Gray et al. (2003) Gray, R. O., Corbally, C. J., Garrison, R. F., McFadden, M. T., & Robinson, P. E. 2003, AJ, 126, 2048
- Griffin et al. (2010) Griffin, M. J. et al. 2010, A&A, 518, L3
- Hauck & Mermilliod (1997) Hauck, B. & Mermilliod, M. 1997, VizieR Online Data Catalog, 2215, 0
- Heng & Tremaine (2010) Heng, K. & Tremaine, S. 2010, MNRAS, 401, 867
- Høg et al. (2000) Høg, E., Fabricius, C., Makarov, V. V., Urban, S., Corbin, T., Wycoff, G., Bastian, U., Schwekendiek, P., & Wicenec, A. 2000, A&A, 355, L27
- Holman & Wiegert (1999) Holman, M. J. & Wiegert, P. A. 1999, AJ, 117, 621
- Houck et al. (2004) Houck, J. R. et al. 2004, ApJS, 154, 18
- Hummel et al. (1995) Hummel, C. A., Armstrong, J. T., Buscher, D. F., Mozurkewich, D., Quirrenbach, A., & Vivekanand, M. 1995, AJ, 110, 376
- Ishihara et al. (2010) Ishihara, D. et al. 2010, A&A, 514, A1
- Jalali & Tremaine (2012) Jalali, M. A. & Tremaine, S. 2012, MNRAS, 421, 2368
- Jordan (1910) Jordan, F. C. 1910, Publications of the Allegheny Observatory of the University of Pittsburgh, 1, 85
- Kalas et al. (2006) Kalas, P., Graham, J. R., Clampin, M. C., & Fitzgerald, M. P. 2006, ApJ, 637, L57
- Kalas et al. (2004) Kalas, P., Liu, M. C., & Matthews, B. C. 2004, Science, 303, 1990
- Kennedy & Wyatt (2010) Kennedy, G. M. & Wyatt, M. C. 2010, MNRAS, 405, 1253
- Kennedy et al. (2012) Kennedy, G. M. et al. 2012, MNRAS, 421, 2264
- Kenyon & Bromley (2002) Kenyon, S. J. & Bromley, B. C. 2002, AJ, 123, 1757
- Kenyon & Bromley (2004) —. 2004, AJ, 127, 513
- Kenyon & Bromley (2008) —. 2008, ApJS, 179, 451
- Kenyon & Bromley (2010) —. 2010, ApJS, 188, 242
- Konacki (2005) Konacki, M. 2005, ApJ, 626, 431
- Konacki et al. (2009) Konacki, M., Muterspaugh, M. W., Kulkarni, S. R., & Hełminiak, K. G. 2009, ApJ, 704, 513
- Krist et al. (2005) Krist, J. E. et al. 2005, AJ, 129, 1008
- Krivov (2010) Krivov, A. V. 2010, Research in Astronomy and Astrophysics, 10, 383
- Krivov et al. (2006) Krivov, A. V., Löhne, T., & Sremčević, M. 2006, A&A, 455, 509
- Krivov et al. (2008) Krivov, A. V., Müller, S., Löhne, T., & Mutschke, H. 2008, ApJ, 687, 608
- Lagrange et al. (2009) Lagrange, A.-M. et al. 2009, A&A, 493, L21
- Lagrange et al. (2010) —. 2010, Science, 329, 57
- Lebouteiller et al. (2011) Lebouteiller, V., Barry, D. J., Spoon, H. W. W., Bernard-Salas, J., Sloan, G. C., Houck, J. R., & Weedman, D. W. 2011, ApJS, 196, 8
- Mason et al. (2001) Mason, B. D., Wycoff, G. L., Hartkopf, W. I., Douglass, G. G., & Worley, C. E. 2001, AJ, 122, 3466
- Matthews et al. (2010) Matthews, B. C. et al. 2010, A&A, 518, L135
- Mermilliod (2006) Mermilliod, J. C. 2006, VizieR Online Data Catalog, 2168, 0
- Mitchell (1909) Mitchell, S. A. 1909, ApJ, 30, 239
- Moerchen et al. (2010) Moerchen, M. M., Telesco, C. M., & Packham, C. 2010, ApJ, 723, 1418
- Monin et al. (2007) Monin, J.-L., Clarke, C. J., Prato, L., & McCabe, C. 2007, Protostars and Planets V, 395
- Morel & Magnenat (1978) Morel, M. & Magnenat, P. 1978, A&AS, 34, 477
- Moriwaki & Nakagawa (2004) Moriwaki, K. & Nakagawa, Y. 2004, ApJ, 609, 1065
- Moshir et al. (1993) Moshir, M., Copan, G., Conrow, T., McCallon, H., Hacking, P., Gregorich, D., Rohrbach, G., Melnyk, M., Rice, W., & Fullmer, L. 1993, VizieR Online Data Catalog, 2156, 0
- Mouillet et al. (1997) Mouillet, D., Larwood, J. D., Papaloizou, J. C. B., & Lagrange, A. M. 1997, MNRAS, 292, 896
- Müller et al. (2010) Müller, S., Löhne, T., & Krivov, A. V. 2010, ApJ, 708, 1728
- Mustill & Wyatt (2009) Mustill, A. J. & Wyatt, M. C. 2009, MNRAS, 399, 1403
- Ott (2010) Ott, S. 2010, in Astronomical Society of the Pacific Conference Series, Vol. 434, Astronomical Data Analysis Software and Systems XIX, ed. Y. Mizumoto, K.-I. Morita, & M. Ohishi, 139
- Perryman & ESA (1997) Perryman, M. A. C. & ESA, eds. 1997, ESA Special Publication, Vol. 1200, The HIPPARCOS and TYCHO catalogues. Astrometric and photometric star catalogues derived from the ESA HIPPARCOS Space Astrometry Mission
- Phillips (2011) Phillips, N. M. 2011, PhD thesis, The University of Edinburgh
- Pilbratt et al. (2010) Pilbratt, G. L. et al. 2010, A&A, 518, L1
- Poglitsch et al. (2010) Poglitsch, A. et al. 2010, A&A, 518, L2
- Pourbaix (2000) Pourbaix, D. 2000, A&AS, 145, 215
- Rieke et al. (2004) Rieke, G. H. et al. 2004, ApJS, 154, 25
- Rieke et al. (2005) —. 2005, ApJ, 620, 1010
- Rodriguez & Zuckerman (2012) Rodriguez, D. R. & Zuckerman, B. 2012, ApJ, 745, 147
- Sadakane & Nishida (1986) Sadakane, K. & Nishida, M. 1986, PASP, 98, 685
- Scholl et al. (2007) Scholl, H., Marzari, F., & Thébault, P. 2007, MNRAS, 380, 1119
- Shannon & Wu (2011) Shannon, A. & Wu, Y. 2011, ApJ, 739, 36
- Song et al. (2001) Song, I., Caillault, J.-P., Barrado y Navascués, D., & Stauffer, J. R. 2001, ApJ, 546, 352
- Stebbins (1914) Stebbins, J. 1914, ApJ, 39, 459
- Strubbe & Chiang (2006) Strubbe, L. E. & Chiang, E. I. 2006, ApJ, 648, 652
- Struve & Pogo (1928) Struve, O. & Pogo, A. 1928, ApJ, 67, 336
- Su et al. (2006) Su, K. Y. L. et al. 2006, ApJ, 653, 675
- Thébault et al. (2003) Thébault, P., Augereau, J. C., & Beust, H. 2003, A&A, 408, 775
- Tomkin & Popper (1986) Tomkin, J. & Popper, D. M. 1986, AJ, 91, 1428
- Trilling et al. (2007) Trilling, D. E., Stansberry, J. A., Stapelfeldt, K. R., Rieke, G. H., Su, K. Y. L., Gray, R. O., Corbally, C. J., Bryden, G., Chen, C. H., Boden, A., & Beichman, C. A. 2007, ApJ, 658, 1289
- van Leeuwen (2007) van Leeuwen, F. 2007, A&A, 474, 653
- Verrier & Evans (2009) Verrier, P. E. & Evans, N. W. 2009, MNRAS, 394, 1721
- Vican (2012) Vican, L. 2012, AJ, 143, 135
- Weidenschilling (1977) Weidenschilling, S. J. 1977, Ap&SS, 51, 153
- Welsh et al. (2012) Welsh, W. F. et al. 2012, Nature, 481, 475
- Werner et al. (2004) Werner, M. W. et al. 2004, ApJS, 154, 1
- Wilner et al. (2012) Wilner, D. J., Andrews, S. M., MacGregor, M. A., & Hughes, A. M. 2012, ApJ, 749, L27
- Wyatt (2008) Wyatt, M. C. 2008, ARA&A, 46, 339
- Wyatt et al. (2007a) Wyatt, M. C., Smith, R., Greaves, J. S., Beichman, C. A., Bryden, G., & Lisse, C. M. 2007a, ApJ, 658, 569
- Wyatt et al. (2007b) Wyatt, M. C., Smith, R., Su, K. Y. L., Rieke, G. H., Greaves, J. S., Beichman, C. A., & Bryden, G. 2007b, ApJ, 663, 365
- Wyatt et al. (2012) Wyatt, M. C. et al. 2012, MNRAS, 424, 1206
- Yang et al. (2012) Yang, H., Herczeg, G. J., Linsky, J. L., Brown, A., Johns-Krull, C. M., Ingleby, L., Calvet, N., Bergin, E., & Valenti, J. A. 2012, ApJ, 744, 121