Spectral and timing properties of the accreting X-ray millisecond pulsar IGR J17498–2921
Abstract
Context. IGR J17498–2921 is the third X-ray transient accreting millisecond pulsar discovered by INTEGRAL. It was in outburst for about 40 days beginning on August 08, 2011.
Aims. We analyze the spectral and timing properties of the object and the characteristics of X-ray bursts to constrain the physical processes responsible for the X-ray production in this class of sources.
Methods. We studied the broad-band spectrum of the persistent emission in the 0.6–300 keV energy band using simultaneous INTEGRAL, RXTE, and Swift data obtained in August-September 2011. We also describe the timing properties in the 2–100 keV energy range such as the outburst lightcurve, pulse profile, pulsed fraction, pulsed emission, time lags, and study the properties of X-ray bursts discovered by RXTE, Swift, and INTEGRAL and the recurrence time.
Results. The broad-band average spectrum is well-described by thermal Comptonization with an electron temperature of keV, soft seed photons of keV, and Thomson optical depth in a slab geometry. The slab area corresponds to a black body radius of km. During the outburst, the spectrum stays remarkably stable with plasma and soft seed photon temperatures and scattering optical depth that are constant within the errors. This behavior has been interpreted as indicating that the X-ray emission originates above the neutron star (NS) surface in a hot slab (either the heated NS surface or the accretion shock). The INTEGRAL, RXTE, and Swift data reveal the X-ray pulsation at a period of 2.5 milliseconds up to 65 keV. The pulsed fraction is consistent with being constant, i.e. energy independent and has a typical value of 6–7%. The nearly sinusoidal pulses show soft lags that seem to saturate near 10 keV at a rather small value of s with those observed in other accreting pulsars. The short burst profiles indicate that there is a hydrogen-poor material at ignition, which suggests either that the accreted material is hydrogen-deficient, or that the CNO metallicity is up to a factor of about two times solar. However, the variation in the burst recurrence time as a function of (inferred from the X-ray flux) is much smaller than predicted by helium-ignition models.
Key Words.:
pulsars: individual (IGR J17511–3057) – stars: neutron – X-ray: binaries – X-ray: bursts1 Introduction
IGR J17498–2921 was discovered with INTEGRAL on August 11, 2011 (Gibaud et al. 2011). Pulsations at a frequency of 401 Hz (Papitto et al. 2011b) observed from the source, make it the fourteenth known accreting millisecond X-ray pulsar (AMXP). The orbital period is about 3.8 hours (Markwardt et al. 2011). IGR J17498–2921 also shows X-ray bursts (Ferrigno et al. 2011). The source is located at and , with an associated uncertainty of at the 90% c.l. (Bozzo et al. 2011; Chakrabarty et al. 2011), at a most likely distance of kpc (Linares et al. 2011).
Using Chandra archival data, IGR J17498–2921 has also been observed in quiescence at a luminosity level of erg cm-2 s-1 (for the source distance of 8 kpc, see Jonker et al. 2011). The near IR and optical counterpart has also been found to be very faint (Greiss et al. 2011; Russell et al. 2011; Torres et al. 2011; van den Berg et al. 2011). More details about this source can be found in Papitto et al. (2011a).
The AMXPs are rapidly spinning, old, recycled neutron stars (NSs) hosted in low-mass X-ray binaries. For reviews of the properties of these objects, we refer the reader to the papers by Wijnands (2010) and Poutanen (2006).
In this paper, we report on INTEGRAL, Swift, and Rossi X-ray Timing Explorer (RXTE) observations of IGR J17498–2921 during its August–September 2011 outburst, as well as simultaneous observations by the same satellites during the period August 17–20, 2011 (modified Julian date MJD 55790–55793). We study the lightcurves, broad-band spectra, outburst spectral evolution, and timing properties of the source. The properties of the largest set of X-ray bursts from this source are investigated as well.
2 Observations and data
2.1 INTEGRAL
We analyzed all the INTEGRAL (Winkler et al. 2003) pointings available in the direction of the source. The observations during satellite revolutions 1078–1083 started on August 11 (MJD 55784.948) and ended on August 27 (MJD 55800.051). This also includes a target of opportunity observation during satellite revolution 1080, beginning on August 17 (MJD 55790.9242) and ending on August 20, 2011 (MJD 55793.5631), with a total net exposure time of 214 ks. The data from the IBIS/ISGRI coded mask telescope (Ubertini et al. 2003; Lebrun et al. 2003) consist of 168 stable pointings with a source position offset from the center of the field of view with a total net exposure time of 600 ks. The data from the JEM-X monitor modules 1 and 2 (Lund et al. 2003) consist of 92 stable pointings for a total net exposure time of 323 ks, with a source position offset of from the center of the field of view. The data reduction was performed using the standard Offline Science Analysis (OSA)111http://www.isdc.unige.ch/integral/analysis software version 9.0. The algorithms used for the spatial and spectral analysis are described in Goldwurm et al. (2003).
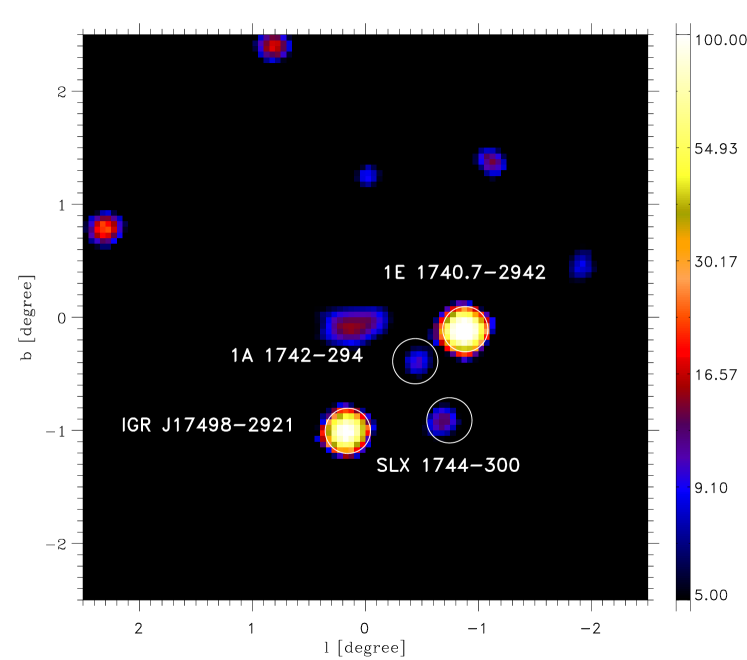
In Fig. 1, we show part of the ISGRI field of view (significance map) around the position of IGR J17498–2921 (in the 20–100 keV energy range). The source is detected at a significance level of . The determined position is and , with an associated uncertainty of at the 90% confidence level. The offset with respect to the Chandra position (Chakrabarty et al. 2011) is .
In the same figure, we also indicate with white circles the position of two burster sources SLX 1744–300/299 and 1A 1742–294, as well as the black hole candidate 1E 1740.7–2942. These sources are detected in the total INTEGRAL/ISGRI mosaic at 13, 11, and 151 and located at , , and , respectively, from the IGR J17498–2921 position (see Fig. 1). Using a simple absorbed power-law model, we determined of the broad-band JEM-X/ISGRI spectra the unabsorbed flux to be 1.610-10, , and erg cm-2 s-1 in the 3–20 keV band, of SLX 1744–300/299, 1A 1742–294, and 1E 1740.7–2942, respectively. We note that in the JEM-X data we clearly distinguish the type-I X-ray bursts emitted by IGR J17498–2921 from the bursts emitted by SLX 1744–300/299 and 1A 1742–294 (see Sect. 2.2).
2.2 RXTE and Swift
We used all the publicly available data from the Proportional Counter Array (PCA, 2–60 keV; Jahoda et al. 1996) on-board the RXTE satellite and the Swift X-Ray Telescope (XRT) (Burrows et al. 2005) data (0.6–10 keV) in window-timing mode. IGR J17498–2921 was observed with Swift and RXTE between August 12 and September 22, 2011 (MJD 55786.1–55826.4) for total net exposure times of ks and ks, respectively. The same dataset was first published by Papitto et al. (2011a), hence we refer the reader to this paper for the Swift/XRT and RXTE/PCA data reduction procedure. However, Fig. 1 shows that the angular separation between different sources, e.g., SLX 1744–300/299 and 1A 1742–294, is smaller than the field of view of the non-imaging instruments on-board RXTE (), thus we were unable to separate the contributions of these objects to the total X-ray flux. In Sect. 2.1, we report from INTEGRAL observations the fluxes of the sources, SLX 1744–300/299 and 1A 1742–294 (and 1E 1740.7–2942), in the same energy band used for RXTE/PCA data.

2.3 Outburst lightcurve
The outburst rise of IGR J17498–2921 was observed from an earlier time, and with a better coverage, than for any previous AMXP. The rise time was shorter than two days. The flux stayed almost constant for five days and decayed afterwards linearly to the quiescence level. The outburst profile shape was similar to those of other AMXPs, e.g., SAX J1808.4–3658 (Gilfanov et al. 1998), XTE J1751–305 (Gierliński & Poutanen 2005), or IGR J17511–3057 (Falanga et al. 2011), and the outburst lasted in total about six weeks. However, since the RXTE/PCA data were contaminated by other sources in the field of view, it is impossible to accurately follow the lightcurve decay, i.e. it is unclear whether the lightcurve decayed exponentially until it reached a break and that the flux then dropped linearly to the quiescence level as observed in other sources (see e.g., Falanga et al. 2011, and references therein). The break may have occurred in the lightcurve around day 30 (see Fig. 2). However, a statistically acceptable fit was a linear relation over the whole outburst as shown in Fig. 2. The lightcurves of AMXPs during their outburst have been modeled in the past using various models (see e.g., Powell et al. 2007; Hartman et al. 2011).
3 Spectral analysis of persistent emission
The analysis of the persistent emission spectra was carried out using xspec version 12.7.0. For the contemporaneous data, we combined the low-energy range 0.6–10 keV Swift data, the 3–22 keV RXTE/PCA data, and the 5–300 keV INTEGRAL/JEM-X/ISGRI data. For each instrument, a multiplication factor was included in the fit to take into account the uncertainty in the cross-calibration of the instruments. This factor was fixed at one for the ISGRI data. To follow the outburst spectra outside the INTEGRAL observation interval, we used the RXTE/PCA and Swift/XRT data. To take into account the contamination by the Galactic ridge emission and emission from the different sources in the RXTE/PCA field of view, we used as background the RXTE/PCA data collected when the pulsar, IGR J17498–2921, was no longer detected (see also Papitto et al. 2011a). All uncertainties in the single spectral parameters are given at a 90% confidence level.

3.1 Broad-band spectrum
We studied in detail the broad-band X-ray spectrum of IGR J17498–2921 in the energy range 0.6–300 keV during the rise, peak, and decay of the outburst using the joint INTEGRAL/ISGRI, RXTE/PCA, and Swift/XRT data. For all the data, we removed the time intervals corresponding to the bursts. We fitted each joint XRT/PCA/ISGRI spectrum with a thermal Comptonization model, compps, in the slab geometry (Poutanen & Svensson 1996). The same model was used to fit the broad-band spectra of previously observed AMSPs (e.g., Gierliński & Poutanen 2005; Falanga et al. 2005a, b, 2007; Ibragimov & Poutanen 2009; Falanga et al. 2011). The main model parameters are the Thomson optical depth across the slab, the electron temperature , the temperature of the soft-seed blackbody photons assumed to be injected at the bottom of the slab, the emission area corresponding to this blackbody, and the inclination angle between the slab normal and the line of sight. The best-fit spectral parameters during the different outburst epochs are reported in Table 2. In Fig. 3, we show the unfolded and absorbed spectra collected during the peak of the outburst over the interval MJD 55790.948–55792.523 and the best-fit compps model. In these fits, the normalizations of the XRT and PCA data relative to ISGRI were 0.7 and 1.1, respectively.
| Parameters | Rise | Peak | Decay |
|---|---|---|---|
| Time interval (55785 MJD) | 1.157–1.682 | 5.948–7.523 | 14.348–14.873 |
| (keV) | |||
| (keV) | |||
| a𝑎aa𝑎aAssuming a source distance of 8 kpc. (km) | |||
| 168/126 | 288/263 | 178/199 | |
| b𝑏bb𝑏bUnabsorbed flux in the 0.1–300 keV energy range. ( erg cm-2 s-1) | 1.70.2 | 2.00.2 | 1.40.2 |
We also studied the spectral evolution (rebinned over one day) during the whole outburst using contemporaneous RXTE/PCA, Swift/XRT, and INTEGRAL/ISGRI (0.8–300 keV) spectra, and the combined or single RXTE/PCA (3–22 keV) and Swift/XRT (0.6–10 keV) observations.
We found that the spectral evolution of the outburst is marked by a nearly constant plasma temperature keV, soft-seed photons emission keV, and the optical depth . No statistically significant variations were measured. Similar stabilities in the spectral shape at different fluxes has been observed for a number of other AMSPs (Gilfanov et al. 1998; Gierliński & Poutanen 2005; Falanga et al. 2005b; Poutanen 2006; Ibragimov & Poutanen 2009; Ibragimov et al. 2011; Falanga et al. 2011). This behavior has been interpreted as evidence that the X-ray emission originates above the NS surface in a hot slab (either the heated NS surface or the accretion shock). The energy dissipation takes place there and the electron temperature is determined by the flux of soft seed photons produced by the reprocessing of the hard X-ray radiation at the NS surface (see e.g. Haardt & Maraschi 1993; Stern et al. 1995; Poutanen & Svensson 1996; Malzac et al. 2001).
The broad-band spectrum has a clear signature of thermal emission below 7 keV (see Fig. 3). Thermal emission can in principle originate from the cool, truncated accretion disk, as observed e.g. in SAX J1808.4–3658 (Patruno et al. 2009; Kajava et al. 2011) and IGR J17511–3057 (Papitto et al. 2010; Ibragimov et al. 2011). However, it normally contributes only below 3 keV. In addition, the rather constant pulsation amplitude as a function of energy (see Sect. 4.3) does not support this interpretation. Thus, this thermal emission is associated with the heated NS surface beneath and around the accretion hotspot.
4 Timing characteristics
4.1 Data
The emission of IGR J17498–2921 was studied in detail using data from RXTE/PCA (3–36 keV), HEXTE (15–250 keV) and INTEGRAL/ISGRI (20–300 keV). Because the flux decays over the course of the outburst, we selected only data from these instruments where the observations had overlapped in time in order to minimize systematic (pulsed) flux offsets between the measurements. This selection yielded the following interval for the overlapping data period from MJD 55786.114 (first RXTE observation; 96435-01-01-00) to 55800.061 (last INTEGRAL observation; Rev. 1083 Scw. 100010).
We adopted standard selection criteria for the PCA screening process, ignoring time intervals in which bursts and detector breakdowns occur, and obtained the exposure times for this data period for the PCU-detectors of 0–4,11.98 ks, 15.74 ks, 73.70 ks, 10.24 ks, and 23.75 ks, respectively. The data were collected in GoodXenon mode allowing high-time resolution (0.9s) analyses in 256 spectral bins. In the timing analysis, data from all PCU detection layers were used to ensure sensitivity to photons with energies in excess of keV.
For HEXTE, we used the cluster-0 data, because only this cluster had operated in ”on-source” staring mode, since July 13, 2006, and we obtained a dead-time corrected exposure of 50.29 ks.
The ISGRI data, collected during INTEGRAL revolutions 1078–1083 with a start science window 310010 of INTEGRAL revolution 1078, were screened for the effects caused by solar flare activity and Earth radiation belt passages, but none of the pointings showed evidence of any effects. Time periods in which burst events occurred from any source in the ISGRI field of view were excluded from further analysis. This screening process yielded a “good” exposure time of 392.4 ks. Furthermore, in the timing analysis we selected only time stamps of events with rise times between channels 7 and 90 (Lebrun et al. 2003) that had been detected in non-noisy detector pixels with an illumination factor of more than 25%.
The selected time stamps of all instruments used in the timing study were converted to arrival times at the solar system barycenter by taking into account the orbital motion of the spacecraft and correcting for acceleration effects along the binary orbit. In this process we used the position of the X-ray counterpart to IGR J17498–2921 reported by Chakrabarty et al. (2011).

4.2 Pulse profiles and time lags
We folded the barycentered arrival times using the ephemeris given in Markwardt et al. (2011). However, we used a different time for the epoch of the ascending node of MJD 55786.18099710 (TDB), because the one reported in Markwardt et al. (2011) actually refers to .
Panels a–d of Fig. 4 show the PCA pulse profiles for the energy intervals, 1.6–4.1, 4.1–8.7, 8.7–18.4, and 18.4–37.0 keV, respectively. In panels e–f, the HEXTE profiles are shown for the bands 15.6–31.0 keV and 31.0–65.1 keV, and panel g–h show the ISGRI profiles for the energy intervals 20–30 keV and 30–65 keV. Above keV, no significant pulsed emission can be detected in either HEXTE or ISGRI data. The mutual alignment of the RXTE/PCA, HEXTE, and INTEGRAL/ISGRI profiles within the equivalent energy bands is better than s.
The global arrival times of the pulses as a function of energy were studied using the PCA profile for PHA channel-9 (3.2–3.6) keV as a reference template. Cross-correlation of the pulse profiles obtained for other energy bands with this template yielded the time lags shown in Fig. 5. Beyond 4 keV, a declining trend sets in, i.e. the hard X-ray photons arrive earlier than the soft ones. The fall is not as steep and pronounced as for e.g. IGR J17511–3057 (Ibragimov et al. 2011; Falanga et al. 2011), IGR J00291+5934 (Falanga et al. 2005b), or SAX J1808.4–3658 (Cui et al. 1998; Ibragimov & Poutanen 2009), but rather similar to the behavior observed in XTE J1751–305 (Gierliński & Poutanen 2005) and XTE J1807–294 (Chou et al. 2008). The time lags here, however, are rather small and seem to saturate near 10 keV at s.
We note that the saturation occurs very close to the energy where thermal emission ceases, thus supporting the interpretation that the time lags are caused by a combination of the Doppler effect and different emission patterns of the thermal emission and the Comptonization tail (Gierliński et al. 2002; Poutanen & Gierliński 2003).

4.3 Spectrum of the pulsed emission and pulsed fraction
The pulsed spectrum and pulsed fraction (defined as pulsed flux/total flux) as a function of energy provide important diagnostic parameters for constraining the parameter space in theoretical modeling (see e.g. Viironen & Poutanen 2004). We derived the pulsed fluxes (3–150 keV) from observations with the (imaging) ISGRI instrument and the non-imaging RXTE/PCA and HEXTE instruments overlapping in time with the INTEGRAL observations. The total fluxes (0.7–300 keV) were determined from instruments with imaging capabilities, namely Swift XRT, and JEM-X and ISGRI aboard INTEGRAL.
Firstly, we derived the pulsed excess counts (=counts above DC level) in a given energy band by fitting a truncated Fourier series, using only the fundamental and two harmonics, to the measured pulse phase distribution. In the case of the PCA data, only data in the 3–32 keV band were used because data below 3 keV and above 32 keV were excluded owing to calibration uncertainties. Furthermore, the pulsed excess counts were converted to photon flux values (ph cm-2 s-1 keV-1) in a forward spectral-folding procedure assuming an underlying power-law model and taking into account the different exposure times (see Sect. 4.1) and energy responses (all three PCU layers were included) of the five active PCUs. We kept the absorbing hydrogen column-density fixed to cm-2, a value obtained from a broad-band (0.7–300 keV) fit of the total emission spectrum adopting the thermal Comptonization model compps using data from Swift/XRT, RXTE/PCA, and INTEGRAL/JEM-X and ISGRI in the overlapping (contemporaneous) data period. This value differs from the value cm-2 reported by Torres et al. (2011) using Chandra HETGS MEG and HEG data over the 1–7 keV energy interval adopting a power-law model. The difference can easily be explained because of the usage of different energy intervals and different (assumed) underlying photon spectral models.
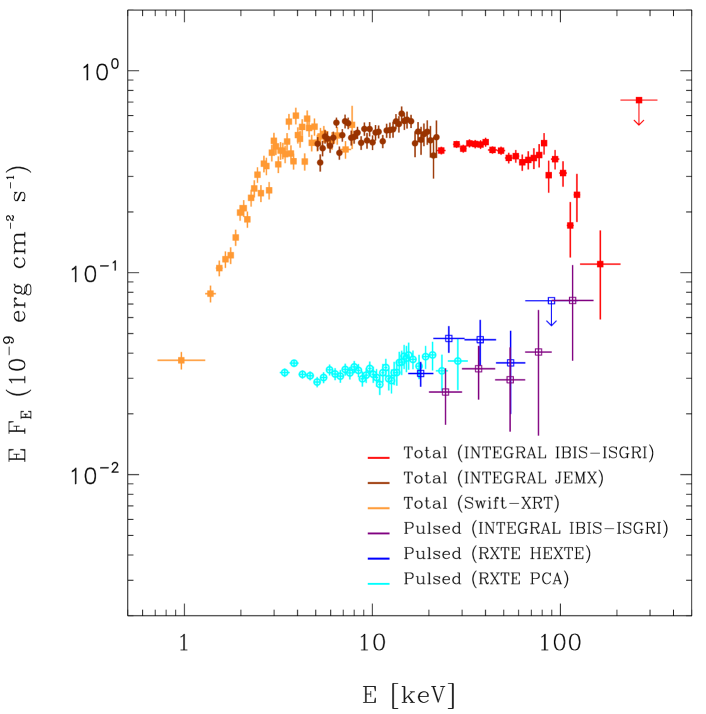
We obtained an unabsorbed 2–10 keV pulsed flux of erg cm-2 s-1 and a photon power-law index of (reduced of the fit over the 3.2–32.2 keV band was 26.84/(362)) using PCA data collected in the INTEGRAL overlapping data period. The power-law index we derived for the pulsed emission is compatible, using the same energy band and observation period, with the total emission spectrum, , which is also within the range of 1.8–2.0 reported by Papitto et al. (2011a). The best-fit compps model to the pulsed emission and the total emission spectra were also found to agree, the same finding also being clearly visible in Fig. 6, suggesting that there is an energy-independent pulsed fraction over the PCA band-pass.
For HEXTE data (15–120 keV), we employed an equivalent method, where the number of pulsed excess counts in a certain energy band (for RXTE observations within the INTEGRAL overlapping data period) were divided by its effective sensitive area assuming a power-law model of index 2, taking into account the energy response and dead-time corrected exposure time (see Sect. 4.1) of detector cluster-0. Finally, the pulsed ISGRI excess counts (20–150 keV) of IGR J17498–2921 were converted to flux values by adopting the method outlined in Section 3.4 of Kuiper et al. (2006).
The (unabsorbed) PCA, HEXTE, and ISGRI pulsed flux measurements are shown in Fig. 6 ( spectral representation), along with the (unabsorbed) total flux measurements derived for the same data period. From these pulsed and total flux measurements, we can easily derive the pulsed fraction as a function of energy. This is shown in Fig. 7. The pulsed fraction is consistent with being constant i.e. energy independent and has a typical value of 6–7%. This behavior is in glaring contrast to that shown by e.g. IGR J00291+5934 and IGR J17511–3057 (see Falanga et al. 2005b, 2011, respectively), where clear energy-dependent variations can be seen. From the physical point of view this means that the emission pattern from the hotspot does not change with energy. Because high-energy photons have undergone more scatterings in the hot electron slab than the low-energy photons, this means that for all observed energies the number of scatterings is rather large and therefore the emission pattern is similar (Viironen & Poutanen 2004).

5 X-ray bursts
5.1 Data
The imaging capabilities of INTEGRAL allow us to separate the X-ray bursts of IGR J17498–2921 from the bursts of other nearby sources, which is impossible with the RXTE/PCA camera. Our analysis shows that among the several bursts detected by the PCA only two are from the IGR J17498–2921 source (see Table LABEL:tab:burst). Chakraborty & Bhattacharyya (2012) reported 12 bursts identified in the RXTE datasets. They classified these bursts as bright, medium, and small type-I X-ray bursts. Using the imaging INTEGRAL/JEM-X capability during the simultaneous INTEGRAL/JEM-X and RXTE/PCA data, we were able to associate the medium bursts with 1A1742–294 and the small bursts with SLX 1744–300/299. The only two bright type-I X-ray bursts were confirmed to have originated from IGR J17498–2921, a result that we consider in greater detal in this work.
For the RXTE detected bursts, where not explicitly stated, the data analysis procedures are as in Galloway et al. (2008). We re-fit the burst spectra over the energy range 2.5–20 keV using the revised PCA response matrices, v11.7333http://www.universe.nasa.gov/xrays/programs/rxte/pca/doc/rmf/pcarmf-11.7 and adopted the recommended systematic error of 0.5%. The fitting was undertaken using xspec version 12.7.0 (Arnaud 1996). To accommodate spectral bins with low count rates, we adopted Churazov weighting. The RXTE/PCUs are subject to a short (s) interval of inactivity following the detection of each X-ray photon. This “dead-time” reduces the detected count rate below the rate of photons incident on the detector (by an estimated 3% for an incident rate of 400 count s-1 PCU-1). We corrected each spectrum for dead-time by calculating an effective exposure, depending upon the measured count rate, which takes into account the dead-time fraction. The peak observed count-rate for burst number 2 was 2920 count s-1 PCU-1 (with data from PCU2 only), giving a dead-time correction of 7.7%444 http://heasarc.nasa.gov/docs/xte/recipes/pca_deadtime.html. For bursts for which suitable data modes were available, time-resolved spectra in the range 2–60 keV covering the burst duration were extracted on intervals as short as 0.25 s during the burst rise and peak. The bin size was gradually increased into the burst tail to maintain roughly the same signal-to-noise level. A spectrum taken from a 16-s interval prior to the burst was adopted as the background.
For the INTEGRAL detected bursts, we fit the spectra collected within 4 s time bin intervals. As background, we used the whole-pointing burst-subtracted spectrum. None of the INTEGRAL/JEM-X detected bursts from IGR J17498–2921 had been observed with the ISGRI instrument at higher energy (18–40 keV).
| # | Observatory | Burst | a𝑎aa𝑎aPre-burst unabsorbed flux in the 0.1–300 keV energy range. | b𝑏bb𝑏bBurst peak flux in the 0.1–40 keV energy band. | c𝑐cc𝑐cBurst fluence in the 0.1–40 keV energy band. | d𝑑dd𝑑dEffective duration . | e𝑒ee𝑒eBurst peak temperature. |
|---|---|---|---|---|---|---|---|
| (UT) | erg cm-2 s-1 | erg cm-2 s-1 | erg cm-2 | s | keV | ||
| 1 | INTEGRAL | 2011-08-14 03:21:26 | |||||
| 2 | RXTE | 2011-08-16 15:21:45 | |||||
| 3f𝑓ff𝑓fBurst also observed in the INTEGRAL/JEM-X data. | Swift | 2011-08-18 11:23:52 | |||||
| 4 | INTEGRAL | 2011-08-19 03:24:26 | |||||
| 5 | INTEGRAL | 2011-08-19 19:59:09 | |||||
| 6g𝑔gg𝑔gBurst analysis using RXTE/PCA standard two mode data with16 sec time resolution, therefore, and are more accurately interpreted as limits, owing to the low time resolution of the source data. | RXTE | 2011-08-20 14:10:08 | |||||
| 7 | INTEGRAL | 2011-08-27 00:35:40 | |||||
| 8 | Swift | 2011-08-28 10:13:22 |
5.2 Burst properties
In Table LABEL:tab:burst, we report the key measurable parameters for the bursts observed from IGR J17498–2921. Thermonuclear (type-I) X-ray bursts are produced by unstable burning of accreted matter on the NS surface. The spectrum from a few keV to higher energies can usually be well-described as a blackbody with temperature 1–3 keV. The energy-dependent decay time of these bursts is attributed to the cooling of the NS photosphere and results in a gradual softening of the burst spectrum (see Lewin et al. 1993; Strohmayer & Bildsten 2006, for a review).
We defined the burst start time as the time at which the X-ray intensity of the source first exceeded 25% of the burst peak flux (above the persistent intensity level). The time-resolved spectral analysis of the eight bursts (two RXTE, five INTEGRAL, and two Swift)666Burst number 3 reported in Table LABEL:tab:burst was observed simultaneously with INTEGRAL/JEM-X, as well as with Swift/XRT. was carried out using the RXTE/PCA and INTEGRAL/JEM-X data in the 2.5–20 keV and 3–20 keV bands, respectively. From these analyses, we determined the bursts’ peak fluxes, temperatures, and radii (see Table LABEL:tab:burst). We fitted each burst spectrum by a simple photoelectrically absorbed blackbody model, bb. The neutral absorption column density was fixed at the value of cm-2 in all fits. However, we checked that leaving free did not significantly affect the results. We extrapolated the unabsorbed fluxes to the 0.1–40 keV band by generating dummy responses (xspec version 12.7.0). This is justifiable for the data because the blackbody temperature is well inside the spectral bandpass. The inferred bb peak temperature, , and unabsorbed bolometric peak flux are also reported in Table LABEL:tab:burst.

When a burst undergoes a photospheric-radius expansion (PRE), the source distance can be determined based on the assumption that the bolometric peak luminosity is saturated at the Eddington limit, (e.g., Lewin et al. 1993). The only burst in our sample that exhibited PRE was burst number 2 (see Fig. 8 for the time-resolved spectral parameters). Assuming a bolometric peak luminosity equal to the Eddington value for a He X-ray burst ( ergs-1, as empirically derived by Kuulkers et al. 2003), we obtained the source distance of kpc. For comparison, the theoretical value of the distance (e.g., Lewin et al. 1993) found by assuming a He atmosphere and canonical NS parameters (1.4 solar mass and radius of 10 km) is kpc. Using the brightest burst (number 5) peak flux reported in Table LABEL:tab:burst, the empirical distance is kpc. However, because the JEM-X statistic are too poor to perform a time-resolved spectral analysis to detect a PRE, we considered 8 kpc to be a fiducial distance derived from burst number 2.
This burst had a temperature of about 2.7 keV at the touchdown, where the blackbody radius was 7.3 km. After the touchdown at the cooling track, the radius slightly increased and then decreased. This evolution of the apparent radius was probably caused by variations of the color-correction factor, . The amplitude of the variations is consistent with the theoretical models (Suleimanov et al. 2011), which predict about 20% changes in , when the flux drops by a factor of three from the peak (Eddington) value.
We calculated the burst fluence, , by integrating the flux over the burst. We estimated the additional contribution to the fluence after the last time bin for which the flux could be measured, by integrating an exponential curve fitted to the last few flux points to infinity. This additional contribution was adopted as the error in the fluence for the cases where it exceeded the statistical error in the fluence calculated from the measured fluxes (e.g. burst number 2). The fluences and peak fluxes for the bursts were roughly constant with time, with , and (excluding burst number 6, for which high-time resolution data were not available, thus the peak flux was underestimated). We also calculated the effective burst duration , which was roughly constant throughout the outburst, at 6–10 s (except burst number 6). The burst rise time was generally shorter than the spectral bin size, which at its shortest was 0.25 s (for burst number 2).
Analysis of a larger sample of type-I bursts observed by RXTE indicate that bursts with short rise times and s are generally consistent with hydrogen-deficient fuel (Galloway et al. 2008, Fig. 21). Thus, on the basis of the burst lightcurves, we expect that this was also the case for the bursts from IGR J17498–2921.
5.3 Physical implications
We now attempt to place more precise constraints on the burst fuel and ignition conditions. At the inferred distance of 8 kpc, the bursts occurred at persistent luminosities between erg s-1 (see Table LABEL:tab:burst), or of (using erg s-1). The local accretion rate per unit area for the pre-burst emission, , is then given by , i.e. g cm-2 s-1. We used here the gravitational redshift for the canonical NS mass, , and radius, km.
Bursts numbers 3–6 occurred during uninterrupted observations with INTEGRAL, so there is little uncertainty about the burst recurrence times for these bursts. The burst number 6 was detected only with RXTE, and occurred during a RXTE/PCA observation that started shortly before the end of our INTEGRAL target of opportunity observation. We calculated the usual ratio of the integrated persistent flux to the burst fluence, , where is the bolometric persistent flux between each burst and is the recurrence time. The -values for bursts 4–6 were consistent with a constant value of . This implies a nuclear energy release MeV nucleon-1. The usual approximation for MeV nucleon-1 (including losses owing to neutrino emission following Fujimoto et al. 1987, where is the mean H-fraction of the fuel layer, see e.g. Galloway et al. 2004 and references therein), implies that the measured is below that of even pure He fuel (i.e. ).
This otherwise unphysical situation may be explained by the anisotropy of the burst and persistent emission. Implicit in the calculation of is a term , which describes the relative beaming of the persistent and burst emission (e.g., Fujimoto 1988; Lapidus et al. 1985). The different geometries of the persistent and burst emission imply that the degree of anisotropy of each, parametrized as (where implies that the emission is beamed preferentially towards the observer) may be different. The true value of may be larger than that inferred from the measurement, if is in turn exaggerated owing to the persistent emission being beamed towards the observer to a greater extent than the burst (i.e. ). Fujimoto (1988) find a minimum value of the ratio for a system inclination of zero. This is sufficient to bring the inferred value of close to 1.6, the expected value for pure He-fuel. We thus infer that the bursts from IGR J17498–2921 are powered by H-poor material, but also that the system is observed at low inclination. The fuel composition at ignition may be modified by steady H-burning prior to the burst. The H-burning proceeds via the -limited hot CNO cycle, and exhausts the available hydrogen fuel in a time of hr (e.g., Galloway et al. 2004), where is the CNO mass fraction, and the H-fraction of the accreted fuel. Thus, the measured recurrence times are sufficiently long to ensure that even for a solar hydrogen mass fraction in the accreted fuel, steady burning can exhaust the hydrogen at the base, producing the requisite short, He-like burst profiles and high -values.
The observed energies of the bursts allow us to estimate the ignition depths. The measured fluences of the bursts are , corresponding to a net burst energy release . The ignition depth is given by . For the inferred pure-helium composition at ignition (i.e. ) the column depth varies little from burst to burst, in the range .
The theoretical recurrence times for all the bursts, calculated with the equation and assuming the values for and reported above, are in the range of 8–20 hr. In particular, for the bursts numbers 3–6 we obtained from this equation recurrence times of , , and hr, respectively. These are significantly shorter than those measured from the observations of 16.01 hr, 16.58 hr, and 18.18 hr (we note that bursts numbers 3–6 occurred during uninterrupted observations). A similar result was obtained when the rotational evolution of a weakly magnetized neutron-star model (Cumming & Bildsten 2000, solar CNO metallicity and a hydrogen mass fraction of 0.7 are assumed) was used instead of the simpler equation above. According to this model, the recurrence time corresponding to a bolometric flux of erg cm-2 s-1 (a mean value between those of the three bursts ) would be 7 hr. In both cases, we thus obtained recurrence times substantially shorter than observed. The inferred low inclination from the burst energetics implies that the isotropic luminosity is overestimated by a factor of , which would reduce the inferred accretion rate by the same factor, and give a recurrence time of just over 12 hr. Although this remains somewhat shorter than predicted, slight decreases in either the CNO or hydrogen mass fraction in the accreted fuel could bring the predicted rates back into agreement with those observed. We defer a more detailed treatment of the burst energetics to a future paper.
6 Summary
We have analyzed simultaneous INTEGRAL, RXTE, and Swift observations to study the broad-band spectrum and timing behavior of IGR J17498–2921. Using all these data, we also studied the outburst profile. The broad-band average spectrum is well-described by thermal Comptonization with an electron temperature of 50 keV, seed photon temperature of 1 keV, and Thomson optical depth in a slab geometry. In addition this object shows remarkable spectral stability during the outburst, as marked by constant plasma and seed photon temperatures at a constant scattering optical depth.
We have shown that the coherent pulsation can be tracked with the HEXTE and ISGRI instruments up to 65 keV. The pulsed fraction was found to be constant, i.e., energy-independent, and has a typical value of 6–7%. The nearly sinusoidal pulses show soft lags beyond keV (hard X-ray photons arrive earlier than the soft ones) that seems to saturate near 10 keV at s. The fall is not as steep and pronounced as for example found for either IGR J17511–3057 or IGR J00291+5934.
Using all observations by INTEGRAL, RXTE, and Swift, we have collected the most comprehensive set of X-ray bursts observed from IGR J17498–2921, which has allowed us to determine the recurrence time as a function of the accretion rate and the ignition depth. The short burst profiles indicate that there is hydrogen-poor material in the process of ignition, which suggests either that the accreted material is hydrogen-deficient or that the CNO metallicity is up to a factor of two times solar. However, the variation in the burst recurrence time as a function of the accretion rate (inferred from the X-ray flux) is much smaller than predicted by helium-ignition models.
Acknowledgements.
The authors thank Chris Winkler and the INTEGRAL team for the rapid scheduling of the observations of IGR J17498–2921 shortly after the onset of its outburst. JP acknowledges financial support from the Academy of Finland grant 127512. MF, JP, and DG thank the International Space Science Institute (ISSI) in Bern for hosting an International Team on type-I X-ray bursts.References
- Arnaud (1996) Arnaud, K. A. 1996, in Astronomical Society of the Pacific Conference Series, Vol. 101, Astronomical Data Analysis Software and Systems V, ed. G. H. Jacoby & J. Barnes, 17
- Bozzo et al. (2011) Bozzo, E., Beardmore, A., Papitto, A., Ferrigno, C., & Gibaud, L. 2011, ATel, 3558
- Burrows et al. (2005) Burrows, D. N., Hill, J. E., Nousek, J. A., et al. 2005, Space Sci. Rev., 120, 165
- Chakrabarty et al. (2011) Chakrabarty, D., Markwardt, C. B., Linares, M., & Jonker, P. G. 2011, ATel, 3606
- Chakraborty & Bhattacharyya (2012) Chakraborty, M. & Bhattacharyya, S. 2012, MNRAS, 2731
- Chou et al. (2008) Chou, Y., Chung, Y., Hu, C.-P., & Yang, T.-C. 2008, ApJ, 678, 1316
- Cui et al. (1998) Cui, W., Morgan, E. H., & Titarchuk, L. G. 1998, ApJ, 504, L27
- Cumming & Bildsten (2000) Cumming, A. & Bildsten, L. 2000, ApJ, 544, 453
- Falanga et al. (2005a) Falanga, M., Bonnet-Bidaud, J. M., Poutanen, J., et al. 2005a, A&A, 436, 647
- Falanga et al. (2005b) Falanga, M., Kuiper, L., Poutanen, J., et al. 2005b, A&A, 444, 15
- Falanga et al. (2011) Falanga, M., Kuiper, L., Poutanen, J., et al. 2011, A&A, 529, A68
- Falanga et al. (2007) Falanga, M., Poutanen, J., Bonning, E. W., et al. 2007, A&A, 464, 1069
- Ferrigno et al. (2011) Ferrigno, C., Bozzo, E., & Belloni, L. G. A. P. T. M. 2011, ATel, 3560
- Fujimoto et al. (1987) Fujimoto, M. Y., Sztajno, M., Lewin, W. H. G., & van Paradijs, J. 1987, ApJ, 319, 902
- Fujimoto (1988) Fujimoto, M. Y. 1988, ApJ, 324, 995
- Galloway et al. (2004) Galloway, D. K., Cumming, A., Kuulkers, E., et al. 2004, ApJ, 601, 466
- Galloway et al. (2008) Galloway, D. K., Muno, M. P., Hartman, J. M., Psaltis, D., & Chakrabarty, D. 2008, ApJS, 179, 360
- Gibaud et al. (2011) Gibaud, L., Bazzano, A., Bozzo, E., et al. 2011, ATel, 3551
- Gierliński et al. (2002) Gierliński, M., Done, C., & Barret, D. 2002, MNRAS, 331, 141
- Gierliński & Poutanen (2005) Gierliński, M. & Poutanen, J. 2005, MNRAS, 359, 1261
- Gilfanov et al. (1998) Gilfanov, M., Revnivtsev, M., Sunyaev, R., & Churazov, E. 1998, A&A, 338, L83
- Goldwurm et al. (2003) Goldwurm, A., David, P., Foschini, L., et al. 2003, A&A, 411, L223
- Greiss et al. (2011) Greiss, S., Steeghs, D., Maccarone, T., et al. 2011, ATel, 3562
- Haardt & Maraschi (1993) Haardt, F. & Maraschi, L. 1993, ApJ, 413, 507
- Hartman et al. (2011) Hartman, J. M., Galloway, D. K., & Chakrabarty, D. 2011, ApJ, 726, 26
- Ibragimov et al. (2011) Ibragimov, A., Kajava, J. J. E., & Poutanen, J. 2011, MNRAS, 415, 1864
- Ibragimov & Poutanen (2009) Ibragimov, A. & Poutanen, J. 2009, MNRAS, 400, 492
- Jahoda et al. (1996) Jahoda, K., Swank, J. H., Giles, A. B., et al. 1996, in SPIE Conference Series 2808, ed. O. H. Siegmund & M. A. Gummin, 59
- Jonker et al. (2011) Jonker, P. G., Torres, M. A. P., Steeghs, D., & Chakrabarty, D. 2011, ATel, 3559
- Kajava et al. (2011) Kajava, J. J. E., Ibragimov, A., Annala, M., Patruno, A., & Poutanen, J. 2011, MNRAS, 417, 1454
- Kuiper et al. (2006) Kuiper, L., Hermsen, W., den Hartog, P. R., & Collmar, W. 2006, ApJ, 645, 556
- Kuulkers et al. (2003) Kuulkers, E., den Hartog, P. R., in’t Zand, J. J. M., et al. 2003, A&A, 399, 663
- Lapidus et al. (1985) Lapidus, I. I., Syunyaev, R. A., & Titarchuk, L. G. 1985, Astrophysics, 23, 663
- Lebrun et al. (2003) Lebrun, F., Leray, J. P., Lavocat, P., et al. 2003, A&A, 411, L141
- Lewin et al. (1993) Lewin, W. H. G., van Paradijs, J., & Taam, R. E. 1993, Space Sci. Rev., 62, 223
- Linares et al. (2011) Linares, M., Altamirano, D., Watts, A., et al. 2011, ATel, 3558
- Lund et al. (2003) Lund, N., Budtz-Jørgensen, C., Westergaard, N. J., et al. 2003, A&A, 411, L231
- Malzac et al. (2001) Malzac, J., Beloborodov, A. M., & Poutanen, J. 2001, MNRAS, 326, 417
- Markwardt et al. (2011) Markwardt, C. B., Strohmayer, T. E., & Smith, E. A. 2011, ATel, 3561
- Papitto et al. (2011a) Papitto, A., Bozzo, E., Ferrigno, C., et al. 2011a, A&A, 535, L4
- Papitto et al. (2011b) Papitto, A., Ferrigno, C., Bozzo, E., et al. 2011b, ATel, 3556
- Papitto et al. (2010) Papitto, A., Riggio, A., di Salvo, T., et al. 2010, MNRAS, 407, 2575
- Patruno et al. (2009) Patruno, A., Rea, N., Altamirano, D., et al. 2009, MNRAS, 396, L51
- Poutanen (2006) Poutanen, J. 2006, Adv. Sp. Res., 38, 2697
- Poutanen & Gierliński (2003) Poutanen, J. & Gierliński, M. 2003, MNRAS, 343, 1301
- Poutanen & Svensson (1996) Poutanen, J. & Svensson, R. 1996, ApJ, 470, 249
- Powell et al. (2007) Powell, C. R., Haswell, C. A., & Falanga, M. 2007, MNRAS, 374, 466
- Russell et al. (2011) Russell, D. M., Lewis, F., Altamirano, D., & Roche, P. 2011, ATel, 3622
- Stern et al. (1995) Stern, B. E., Poutanen, J., Svensson, R., Sikora, M., & Begelman, M. C. 1995, ApJ, 449, L13
- Strohmayer & Bildsten (2006) Strohmayer, T. & Bildsten, L. 2006, in Compact stellar X-ray sources, Cambridge Astrophysics Series, No. 39, ed. Lewin, W. H. G. & van der Klis, M. (Cambridge: Cambridge University Press), 113
- Suleimanov et al. (2011) Suleimanov, V., Poutanen, J., & Werner, K. 2011, A&A, 527, A139
- Torres et al. (2011) Torres, M. A. P., Madej, O., Jonker, P. G., et al. 2011, ATel, 3638
- Ubertini et al. (2003) Ubertini, P., Lebrun, F., Di Cocco, G., et al. 2003, A&A, 411, L131
- van den Berg et al. (2011) van den Berg, M., Grindlay, J., Zhao, P., Hong, J., & Servillat, M. 2011, ATel, 3634
- Viironen & Poutanen (2004) Viironen, K. & Poutanen, J. 2004, A&A, 426, 985
- Wijnands (2010) Wijnands, R. 2010, Highlights of Astronomy, 15, 121
- Winkler et al. (2003) Winkler, C., Courvoisier, T. J.-L., Di Cocco, G., et al. 2003, A&A, 411, L1