A Spallation Model for 44Ti production in Core Collapse Supernovae
Abstract
Current cc-SN models predict overproduction of 44Ti compared to observations. We present a model for an alternative channel where a cc-SN explosion is followed by a neutron star detonation (Quark Nova or QN), resulting in a spallation reaction of SN ejecta that produces 44Ti. We can achieve a 44Ti production of with our model under the right time delay between the QN and the SN. Our model also produces unique signals not found in standard, cc-SN nucleosynthesis models. Some of these unique signals include a significantly large production of 7Be and 22Na. We discuss some of these signals by analyzing the late time light curve and gamma spectroscopy of our model.
keywords:
spallation, core collapse supernovae, cc-SNe, Quark Nova, 44Ti, nucleosynthesis, SN1987A.1 Introduction
Late time light curves of SNe are considered a relatively accessible resource for studying the nature of SNe, yet, the study of these light curves is ridden with challenges. Very few objects have been studied beyond days, because as the SN dims out, the dust and the background noise, makes the signals unreadable (Leibundgut &
Suntzeff, 2003). Even the most extensively documented supernova, SN1987A, is difficult to study at its later stages, because it is very hard to extrapolate directly the bolometric luminosity after days (Leibundgut &
Suntzeff, 2003).
The lack of late time light curve data make it difficult to formulate standard SN models. SN models have their parameters adjusted so that the isotopic yields reflect the abundances inferred from late time light curves (Limongi &
Chieffi, 2006), which makes them dependent on the quality and understanding of our current observations. An example of the problematic nature of standard core collapse SN models, is 44Ti production. Although 44Ti production is assumed to be universal in core collapse SN models (Woosley
et al., 1995), only SN1987A is documented well enough to be able to extrapolate 44Ti from the bolometric light curve. The problem is precipitated by the fact that current -ray telescopes have only been able to detect 44Ti decay lines in Cassiopeia A (The et al., 2006), whereas current models predict more detections.
In this letter, we attempt to solve some of these problems by proposing an alternative channel to the standard cc-SN model. After the SN explosion, neutron stars that undergo an evolution (e.g. matter fallback, or spin-down) evolution towards quark deconfinement densities will transition to a lower energy, strange matter phase and experience an energetic detonation. (Quark Nova or QN) (Ouyed
et al., 2002). The neutron star will release its outer layers as relativistic, neutron rich ejecta, where the ejecta interacts with the SN envelope (double-shock Quark Nova, or dsQN). The time delay (hereafter ) between the two detonations constrains the nature of the interaction, where a time delay on the order of days will cause significant spallation of SN ejecta by QN neutrons. The spallation reaction creates unique signals in the late time light curve due to the modification of radioactive isotope abundances. The time delay between the QN and SN detonations acts as a parameter for the isotopic abundances. The different abundances of isotopes will also create specific gamma spectroscopic signals. Currently, there has been many indirect observations for QN suggested (e.g. Hwang &
Laming (2012); Ouyed
et al. (2012); Leahy &
Ouyed (2008)).
In continuation to Ouyed
et al. (2011), we explain the 44Ti synthesis measured in the late-time light curves of core collapse SN (Woosley &
Hoffman, 1991) as a product of nuclear spallation from the dsQN, in contrast to the traditional view that it is produced by the SN in situ. The conditions necessary for the production of a QN, and the constraints set by the parameter , explains the rarity of observations of 44Ti nuclear decay lines. In contrast to our earlier paper (Ouyed
et al., 2011), we avoid excessive destruction of 56Ni by spallation, by taking into account the mixing of the SN’s layers. Numerical studies have shown that Rayleigh Taylor instabilities can cause considerable mixing in a very short time span (Kifonidis et al., 2000; Hachisu
et al., 1991; Mueller
et al., 1991). Furthermore, observations in 1987A seem to support the picture of thorough mixing (Mueller
et al., 1991). If 56Ni is mixed through the SN envelope, there are less 56Ni atoms in the inner layer. This would lead to QN neutrons hitting less 56Ni, as opposed to the picture where all 56Ni is concentrated in the inner layers (Ouyed
et al., 2011). By avoiding excessive nickel depletion, we can avoid the sub-luminosity characteristic in Ouyed
et al. (2011).
2 Model
We extend the model we presented in Ouyed et al. (2011) by including mixing. In analogy to lab terminology, we divide our model into a beam part, and a target part. The scenario consists of a beam of relativistic QN ejecta that collides with a target that is the expanding, inner layers of the SN envelope. The time delay between the SN denotation and neutron star detonation is the key parameter in our model.
2.1 Beam
2.2 Target
We model the target as an expanding SN envelope of inner radius , where km/s is the velocity of the SN ejecta, and is the time delay between the neutron star detonation and the SN detonation. We assume the exploding star is . In contrast to the original model (Ouyed et al., 2011), we assume mixing. The target is the inner mass of the expanding SN envelope, which is composed of mixed 16O,12C, and 56Ni. We assume that whole SN envelope has a total 56Ni mass of , and O and C have total masses of each (Ouyed, 2012). If the mixing has spread each element homogeneously through whole SN envelope, then we can derive the masses of each element for the interior target. The masses of the isotopes in the target are , and . We treat the target, total number density as constant, where,
| (1) |
where is the thickness containing and is total number of atoms within . Our mean free path is,
| (2) |
where we use the semi-empirical cross section (Letaw et al., 1983), where is mass number. For our model, we use (1) and (2) to divide the thickness into imaginary layers of width ,
| (3) |
where represents the number of collisions an incoming neutron with . The subscript indicates the units, for example, is in units of . The interaction of that neutron with a SN atom will release a multiplicity of nucleons,
| (4) |
where
2.3 Spallation Statistics
At each imaginary layer of radial thickness , an atom will be bombarded by neutrons, resulting in the nucleus (Ouyed et al., 2011),
| (5) |
Each element in the layer has a statistical weight , where is the total number of atoms of isotope , is the inner mass of a specific isotope , is the mass of a proton, and is the atomic number of isotope . The statistical weight signifies the fraction of atoms of that particular element that will be hit by the incoming neutrons.
and are drawn from a Poisson distribution that peaks at,
| (6) |
where is the number of atoms of isotope , and is the spallation cross section for isotope .
For subsequent layers, it follows that.
| (7) |
and the mean nucleon energy for each subsequent layer is,
| (8) |
where spallation ceases at an energy of MeV (Cugnon et al., 1997).
2.4 Light Curve Model
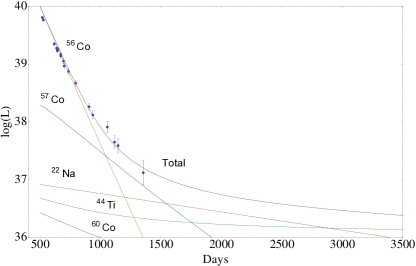
We compute the late time light curve by extending our spallation code with the Cococubed program (Timmes). Our spallation code computes the mass yields of different isotopes using the model in Section 2, and the Cococubed extension computes the bolometric luminosity from the isotope mass yields. We also take into account the contributions of 57Ni, and 60Co to the bolometric light curve, and we take their mass values from Woosley et al. (1995). In our model, we assume the simple case where the bolometric luminosity is entirely caused by the thermalization of nuclear decay radiation.
3 Results
3.1 Photometry
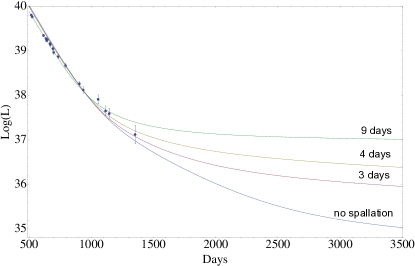
The key isotopes for the light curve (Fig. 1) are 56Ni and 44Ti. For days, our model synthesized of 44Ti, which compares favourably to amounts found by -ray telescopes in Cassiopeia A (Iyudin et al., 1994), and amounts estimated from the light curve of SN1987A (Suntzeff et al., 1992; Woosley & Hoffman, 1991). Furthermore, we notice there is very little nickel that is depleted - indeed most of the original inner is maintained for . If very little 56Ni is depleted from the inner mass, then the total for 56Ni that is spread throughout the whole envelope, is more or less maintained throughout different time delays. The mass for 56Ni compares quite well with what is observed in type II SN light curves (Suntzeff et al., 1992; Woosley & Hoffman, 1991). Another interesting isotope is 22Na, and it is synthesized at a high amount of almost which contrasts with the estimates of (Woosley et al., 1995). This creates a higher contribution to the bolometric luminosity, than normally expected. We see in the upper panel of Fig 1 a dependance of the light curve to . We can see that latter stages of the late time light curve are the most visibly affected by the time delay. This strong dependance in the later days is modulated by the production of 44Ti, because 44Ti yields are very affected by the time delay (Fig. 3). The earlier days of the late time light curve seem to be affected only weakly by the time delay change, because 56Ni destruction stays more or less constant (Fig. 3).
3.2 Isotope Abundance
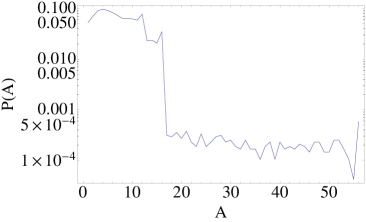
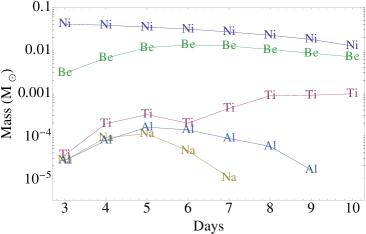
Our spallation model creates isotopes of almost every mass number in the range of . However, very few of the isotopes created can be detected with -ray telescopes, because the SN envelope only becomes transparent to nuclear decay radiation after a time period of at least months (Diehl, 2012), so only isotopes that have a half life of at least in the order of weeks will have detectable nuclear decay lines. Therefore, in Fig 3, we only include the masses of isotopes with half lives of at least in the order of weeks.
In Fig. 2 and 3 we plot some of the trends of these isotopes. We notice that in Fig. 2, the plot heavily leans on light isotopes. This is caused by the spallation of mixed C and O in the inner layer. We also notice that the plot in Fig. 2 is divided in roughly two plateaus, where their boundary is in , which is the atomic mass number of Oxygen. In Fig. 3 we plot the mass of one of the lighter isotopes, 7Be, which has a half life of 76 days, which gives enough time for nuclear decay photons to go through the SN photosphere. Compared to the models of Woosley et al. (1995), we notice that our model produces more 7Be and 22Na. We also notice that 44Ti, 56Ni, and 26Al are in the same order of magnitudes as other models (Woosley et al., 1995). Finally, it seems we can constrain production of 22Na and 26Al at higher , where 22Na production ends at and 26Al production at days.
4 Discussion and Predictions
-
•
44Ti production as a dsQN specificity and SN1987A We argue that the rarity of observations (The et al., 2006) of 44Ti might be related to the fact that 44Ti is not produced by standard cc-SNe, but by dsQNe. In a recent paper (Ouyed et al., 2011), we argued that CasA’s 44Ti lines were produced by a dsQN through a significant 56Ni depletion. Although, it is probably possible to avoid the excessive 56Ni depletion in our original model by adjusting some parameters, and yet still predict a 44Ti mass yield that is compatible with observations, it seems more natural and elegant to extend our model with mixing. Through mixing, we can predict very minimal destruction of 56Ni (Fig. 3) because 56Ni is spread throughout the whole envelope as opposed to the assumption where it is all concentrated in the inner layers. If 56Ni is spread throughout a wider volume, then less 56Ni atoms will be available in the inner layers as targets for QN neutrons. This minimal depletion leaves almost all the of 56Ni intact. In Fig 1 we plotted the data of SN1987A against our model, where SN1987A is a SN where 44Ti has been measured indirectly (Motizuki & Kumagai, 2004; Suntzeff et al., 1992; Woosley & Hoffman, 1991). At lower time delays, QN energy is mostly spent in PdV work (Leahy & Ouyed, 2008), therefore at a time delay of 4 days, our model could reproduce a similar luminosity to SN1987A . Current observations of SN1987A point to thorough mixing of SN layers (Mueller et al., 1991), which compares well to the assumptions about mixing done in our model. Recent papers have provided alternative arguments for the possibility of SN1987A compact remnant being a Quark Star (Chan et al., 2009).
-
•
7Be abundance In Fig. 2 and 3, a very large abundance of 7Be is produced compared to current cc-SN models (Diehl & Timmes, 1998; Woosley et al., 1995). Current core collapse SN models don’t produce enough 7Be to reach the photosphere before 7Be decays. However, our model predicts - for 7Be, which could be enough so that a significant amount of it reaches the photosphere and therefore be detected by -ray telescopes. The 487 keV photon released by the -decay of 7Be into 7Li, is in the detectable energy range of current -ray telescopes (INTEGRAL, NuSTAR, etc.). The large abundance of 7Be is due to the spallation of mixed O and C in the inner SN layers. This high abundance in our model indicates that only core collapse SN that evolve into dsQN will have a detectable gamma signature of 7Be. Currently, Novae are the only possible sources of detectable, 7Be photons because standard cc-SN are too optically thick (Diehl & Timmes, 1998). However our dsQN model can produce an alternative point source of 7Be photons. Finally, such a massive amount of 7Be should create a signature in the bolometric light curve.
-
•
22Na abundance A small 22Na contribution is predicted in late time core collapse SN light curves (Woosley et al., 1995). However, our spallation model generates a much larger amount of 22Na than expected. This large yields of 22Na are due to the spallation of 56Ni into lighter nuclei. Current models (Woosley et al., 1995) give a for 22Na, while our spallation model can produce as much as (Fig 3). Furthermore, 22Na has a half-life of 2.6 yr, and decays into an excited state of 22Ne, releasing energetic radiation (Diehl & Timmes, 1998). That large amount generates enough radiation to create a noticeable signal in the late time light curve, as pictured in Fig 1. The decay of 22Na emits a 1.275 MeV line that can be detected by current -ray telescopes. These signals of 22Na abundant dsQN cannot be reproduced in current models for cc-SNe.
-
•
Mixing Our model makes the simplification that O,C and 56Ni are in a perfect, homogenous mix. Our simplification allows us to model the spallation targets with statistical weights derived from the isotopic abundances. However, Rayleigh Taylor instabilities induce mixing by fast moving, mushroom-like structures, structures that are lost when assuming a perfect, homogenous mixture. Furthermore, studies of CasA’s remnants point to considerable asymmetry in the detonation (Fesen et al., 2006), which seems to contradict the assumption of perfect homogenous mixing. However, the main ideas of our model, that 44Ti can be produced from a minimal destruction of 56Ni, that spallation of 56Ni will lead to enrichment of 22Na, and that spallation of O, and C will lead to an excess of 7Be, seem sound. While other limitations of our model exist, which are discussed in Ouyed et al. (2011), we offer some sound predictions for 22Na and 7Be enrichment.
Acknowledgments
This research is supported by an operating grant from the National Science and Engineer- ing Research Council of Canada (NSERC). We also thank N. Koning and M. Kostka for helpful discussion.
References
- Chan et al. (2009) Chan T., Cheng K., Harko T., Lau H., Lin L., Suen W., Tian X., 2009, The Astrophysical Journal, 695, 732
- Cugnon et al. (1997) Cugnon J., Volant C., Vuillier S., 1997, Nuclear Physics A, 625, 729
- Diehl (2012) Diehl R., 2012, Arxiv preprint arXiv:1202.0481
- Diehl & Timmes (1998) Diehl R., Timmes F., 1998, Publications of the Astronomical Society of the Pacific, 110, 637
- Fesen et al. (2006) Fesen R., Hammell M., Morse J., Chevalier R., Borkowski K., Dopita M., Gerardy C., Lawrence S., Raymond J., van den Bergh S., 2006, The Astrophysical Journal, 645, 283
- Hachisu et al. (1991) Hachisu I., Matsuda T., Nomoto K., Shigeyama T., 1991, The Astrophysical Journal, 368, L27
- Hwang & Laming (2012) Hwang U., Laming J., 2012, The Astrophysical Journal, 746, 130
- Iyudin et al. (1994) Iyudin A., Diehl R., Bloemen H., Hermsen W., Lichti G., Morris D., Ryan J., Schoenfelder V., Steinle H., Varendorff M., et al., 1994, Astronomy and Astrophysics, 284, L1
- Keränen et al. (2005) Keränen P., Ouyed R., Jaikumar P., 2005, The Astrophysical Journal, 618, 485
- Kifonidis et al. (2000) Kifonidis K., Plewa T., Janka H., Müller E., 2000, The Astrophysical Journal Letters, 531, L123
- Leahy & Ouyed (2008) Leahy D., Ouyed R., 2008, Monthly Notices of the Royal Astronomical Society, 387, 1193
- Leibundgut & Suntzeff (2003) Leibundgut B., Suntzeff N., 2003, Supernovae and gamma-ray bursters, pp 77–90
- Letaw et al. (1983) Letaw J., Silberberg R., Tsao C., 1983, The Astrophysical Journal Supplement Series, 51, 271
- Limongi & Chieffi (2006) Limongi M., Chieffi A., 2006, in Origin of Matter and Evolution of Galaxies Vol. 847, Nucleosynthesis in core collapse supernovae. pp 99–104
- Motizuki & Kumagai (2004) Motizuki Y., Kumagai S., 2004, in Tours Symposium on Nuclear Physics V Vol. 704, Radioactivity of the key isotope 44ti in sn 1987a. pp 369–374
- Mueller et al. (1991) Mueller E., Fryxell B., Arnett D., 1991, Astronomy and Astrophysics, 251, 505
- Ouyed (2012) Ouyed R., 2012, Arxiv preprint arXiv:1203.2703
- Ouyed et al. (2002) Ouyed R., Dey J., Dey M., 2002, Astronomy and Astrophysics, 390, 39
- Ouyed et al. (2012) Ouyed R., Kostka M., Koning N., Leahy D., Steffen W., 2012, Monthly Notices of the Royal Astronomical Society, pp 1652–1662
- Ouyed et al. (2011) Ouyed R., Leahy D., Ouyed A., Jaikumar P., 2011, Physical Review Letters, 107, 151103
- Ouyed et al. (2005) Ouyed R., Rapp R., Vogt C., 2005, The Astrophysical Journal, 632, 1001
- Suntzeff et al. (1991) Suntzeff N., Phillips M., Depoy D., Elias J., Walker A., 1991, The Astronomical Journal, 102, 1118
- Suntzeff et al. (1992) Suntzeff N., Phillips M., Elias J., Walker A., Depoy D., 1992, The Astrophysical Journal, 384, L33
- The et al. (2006) The L., Clayton D., Diehl R., Hartmann D., Iyudin A., Leising M., Meyer B., Motizuki Y., Schönfelder V., 2006, Astronomy and Astrophysics, 450, 1037
- Woosley & Hoffman (1991) Woosley S., Hoffman R., 1991, The Astrophysical Journal, 368, L31
- Woosley et al. (1995) Woosley S., Langer N., Weaver T., 1995, The Astrophysical Journal, 448, 315