Deep and Wide Photometry of Two Open Clusters NGC 1245 and NGC 2506: CCD Observation and Physical Properties
Abstract
We have conducted CCD photometry of the two open clusters NGC 1245 and NGC 2506 using the CFH12K CCD camera. Our photometry covers a sky area of and for the two clusters, respectively, and reaches down to . We derived the physical parameters using detailed theoretical isochrone fittings using minimization. The derived cluster parameters are and , and , and , and [Fe/H]= and , respectively for NGC 1245 and NGC 2506, We present the luminosity functions (LFs) of the two clusters, which reach down to , and derive mass functions (MFs) with slopes of for NGC 1245 and for NGC 2506. The slopes are slightly shallower than that of the solar neighbourhood, implying the existence of dynamical evolution that drives the evaporation of the low-mass stars in the clusters.
keywords:
(Galaxy:) open clusters and associations: individual: – methods: observational – techniques: photometric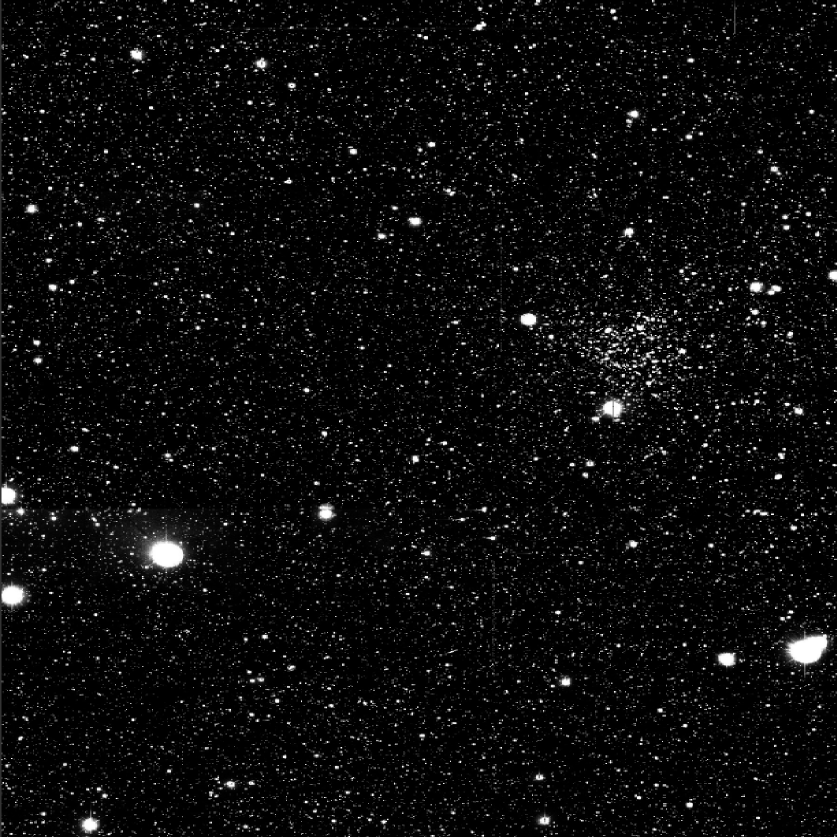
1 Introduction
Open clusters are located in the Galactic disc as Population I, and it is important to investigate their properties and the spatial distribution of the Galaxy to understand the Galaxy structure and evolution, especially the formation and dynamical evolution of the Galactic disc. Because stars in the Galactic disc are originated in evaporated stars from open clusters, the luminosity function of open clusters is an important parameter for understanding their formation and evolution. We can easily obtain the LF from CCD observations, but an analysis of the LF is not easy because the observed LF of open clusters reflects the dynamical evolution which depends on the cluster’s age as well as the initial mass function (IMF).
It is necessary to have a deep photometry over the entire cluster field to understand the LF of old open clusters down to the magnitudes of the evaporating stars because they are much fainter than the turn-off stars and are supposed to be located around the tidal radius of the clusters. But there are only a few open clusters of which photometry is deep and wide enough to study the effect of dynamical evolution on the structure of open clusters. Thus, we selected open clusters which are old enough for the low mass stars to evaporate from the clusters by dynamical evolution and rich enough suitable for a detailed analysis of the spatial distribution of low mass stars. We also took into account the distance of open clusters to ensure that our photometry reaches up to .
The old open cluster NGC 1245 is located in the Perseus arm at a Galactic latitude of . Using photographic photometry data from the Schmidt telescope, Peruanskii & Ryadchenko (1978) discussed the radial density distribution of stars with a limiting magnitude of and a radius of . They presented cluster boundaries with a nucleus () and corona (). Carraro & Patat (1994) and Subramaniam (2003) found a shallower slope of the mass function of NGC 1245 than Salpeter (1955). Using CCD photometry, Subramaniam (2003) presented the surface number density with a limiting magnitude of and a radius of . They also indicated a lack of stars in the cluster centre. Burke et al. (2004) derived physical parameters and a core radius of from CCD photometry. They determined an optical absorption of magnitude and a distance modulus ; they also reported that the cluster has no differential reddening, in contrast to previous studies such as Carraro & Patat (1994) and Wee & Lee (1996).
The old open cluster NGC 2506 also has rich members located at a Galactic latitude of . A radial density profile of the proper motion membership stars obtained by Chiu & van Altena (1981) indicated that bright stars are more concentrated than faint stars in this cluster. Marconi et al. (1997) suggested that more than 20% of the main sequence stars are binary. From a photometric study by Henderson et al. (2007), the distance of this cluster is known to be 3.4 kpc and its age is 1.79 Gyr.
This paper presents the deep CCD photometry of the two old open clusters NGC 1245 and NGC 2506, covering the entire cluster fields including the surrounding field regions for field star correction, along with the derivation of the cluster parameters such as age, metallicity, distance, and interstellar reddening. We will discuss the dynamical structures of the open clusters in a forthcoming paper (Lee, Kang Ann, in preparation), but here we present the physical properties, luminosity functions, and mass functions of the two open clusters along with their physical properties.
The present paper is organized as follows. In §2, we describe the observations and data reductions. We present the physical parameters of the clusters in §3, and describe the luminosity functions and mass functions in §4 and §5, respectively. A summary is given in the final section.
2 Observation
We selected target clusters best suited for studying the dynamical properties of open clusters which is the subject of the second paper (lee12). The two target clusters NGC 1245 and NGC 2506 are located at a relatively high Galactic latitude to reduce field star contamination and are old enough for the evaporation of low mass stars to be prevalent due to dynamical evolution. Also, they are at proper distances for optimum sky coverage and the deep photometry to reach up to . The basic known properties of the selected clusters are listed in Table 1.
| Cluster | Distance | log(age) | |||||
|---|---|---|---|---|---|---|---|
| name | J2000.0 | J2000.0 | (kpc) | ||||
| NGC 1245 | +47 14 12 | 2.88 | 0.300 | 8.704 | |||
| NGC 2506 | -10 46 12 | 3.46 | 0.081 | 9.045 |
2.1 Observation
We conducted deep CCD photometry using the CFH12K mosaic CCD camera mounted at the prime focus of the Canada-France-Hawaii Telescope (CFHT). The effective aperture of the CFHT is 3.6 m, and the CFH12K mosaic CCD camera consists of 12 CCDs of pixels. The CFH12K field of view is with pixel size of .
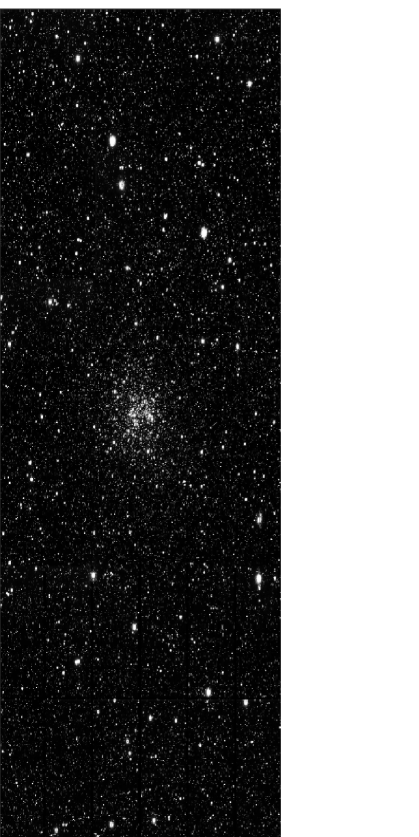
For better sky coverage, we observed 6 regions for NGC 1245 and 3 regions for NGC 2506. The field of view of the combined images was for NGC 1245 and for NGC 2506 (see Fig. 1 and Fig. 2). The observations were performed on the night of December 6, 2001, at CFHT. The observation log is given in Table 2.
| Cluster | Region | Filter | Filter | Seeing |
|---|---|---|---|---|
| NGC 1245 | North-East | 4, 4 | 4, 4 | |
| East | 4, 4 | 4, 4 | ||
| South-East | 4, 4 | 4, 4 | ||
| North-West | 4, 4 | 4, 4 | ||
| West | 4, 4 | 4, 4 | ||
| South-West | 4, 4 | 4, 4 | ||
| NGC 2506 | North | 3, 3 | 4, 3 | |
| Centre | 3, 3 | 4, 3 | ||
| South | 3 | 4 |


2.2 Data Reduction
We followed the standard data reduction procedures, including bias subtraction, overscan correction, and trimming and flat-fielding using IRAF/CCDRED (Stetson, 1987). We used the twilight sky flat fields obtained before and after the observations for flat-fielding. In order to increase the signal-to-noise ratio and to reach low limiting magnitudes, we took multiple exposures of each region. These images were aligned and median-combined into a master image for each region using images of both the long and short exposures. For the photometry calibration, we obtained calibration images for each chip of the CFH12K. We used 20–40 isolated bright stars to derive the point-spread function (PSF) of each calibration image, and we performed PSF photometry (Stetson, 1987) using IRAF/DAOPHOT to obtain the instrumental magnitudes.
For standard star transformation in each band, we observed the SA 98 region (Landolt, 1992) on the same night. The standard star observations were carefully designed to ensure that the maximum number of stars were imaged in each chip of the CFH12K mosaic CCD. The number of observed standard stars was 8–19 for each chip. We derived the standard magnitudes of the programme stars by using the following equations given on the CFHT web page:
| (1) |
| (2) |
where and are the standard magnitudes and and are the instrumental magnitudes. The terms and are the zero points of the photometry that were determined from the photometry of the standard stars in SA 98, and is the airmass. Fig. 3 shows the residuals of the standard star transformation in the and bands.
To correct the incompleteness of the photometry, we generated artificial stars on the CCD frames using the addstar task in the IRAF/DAOPHOT utility and performed reduction in the same manner as the observed frames. The additional artificial stars were randomly generated in each unit-magnitude bin on all original images. To prevent crowding in the images, the number of artificial stars were controlled to be less than 10% of the detected stars, and we repeated this for 40 trials. The incompleteness factor () of the photometric data was determined in the central and outer regions of each cluster. Finally, the incompleteness correction factor was obtained from , where is the number of added stars and is the number of recovered stars. Fig. 4 shows the relationship between and magnitude.
3 Physical Parameters
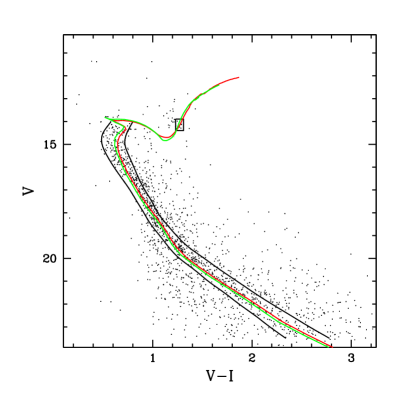
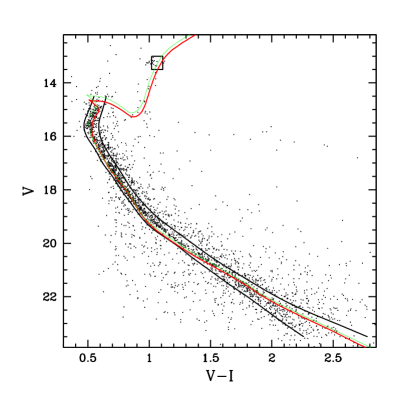
We determined the basic physical parameters of the two open clusters by analyzing the color magnitude diagrams (CMDs). We used Yonsei-Yale () isochrones (Demarque et al., 2004) to fit to the observed CMDs. We assumed and a total-to-selective extinction ratio of 3.2 (Cardelli et al., 1989). Initially, we adjusted the distance, age, metallicity, and interstellar reddening by eyeball fitting (Fig. 5 and Fig. 6) but we determined the best fit parameters by applying minimization algorithm as described below.
In order to reduce the effects of field star contamination, we constructed cluster CMDs using stars in the central region () of the cluster. We also defined the boundaries of main-sequence stars, which are the blue and red edge along main-sequence stars. These boundaries are tightly selected in order to exclude binary sequence. According to evolution tracks, the blue edge of giant clump stars are more massive and more evolved than the red edge of the giant clump. And the giant branch of isochrone represents the red edge of giant stars. So we defined a region of red edge of the giant clump. In Fig. 5 and Fig. 6, we showed the boundaries, and the red edge regions. The isochrones provide an interpolation scheme to calculate isochrones for an arbitrary age and metallicity.
Following Burke et al. (2004), for a given set of fitting parameters (age, metallicity, distance modulus and interstellar reddening), we defined the as
| (3) |
where the sum is over all stars selected for isochrone fitting and is the contribution from star which is defined as
| (4) |
Here, and are magnitude and color of stars and the subscripts and stand for model and observation, respectively. We assumed an equal weight for all stars used in the calculation of in order to avoid overemphasizing the main-sequence turn-off where the systematic difference between theoretical isochrones are more pronounced (Grocholski & Sarajedini, 2003; Burke et al., 2004) although their photometric errors are the smallest. We performed a grid search over age, metallicity, distance modulus and reddening to find the best-fit parameters which minimize the . In table 3, we presents the ranges and intervals of parameters used for NGC 1245 and NGC 2506.
The confidence limits on the derived parameters are obtained by scaling the resulting statistic (Burke et al., 2004)
| (5) |
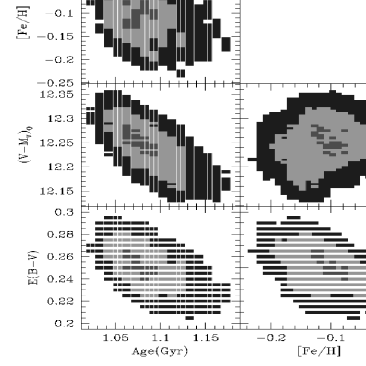
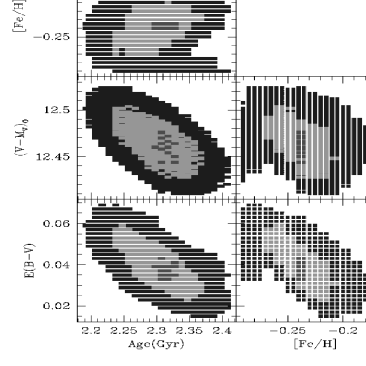
where is the minimum and is the number of degrees of freedom. In Fig. 7 and Fig. 8, we plotted the confidence regions for the joint variation in the isochrone parameters representing the (red, green, blue), which correspond to 2, 4, and 6 error respectively. As shown in Fig. 7 and Fig. 8, the local minimum of is fairly well defined and the surface can be approximated by a paraboloid near minimum. In this approximation, the statistical errors (1 errors) are the projection of the extent of the paraboloid on the parameter axes. The best-fit parameters and their statistical errors () are given in Table 4. As can be seen in Fig. 7 and Fig. 8, the statistical errors in the best-fit parameters are smaller in NGC 2506 than NGC 1245. The larger errors in NGC 1245 is caused by the broad main-sequence near the turn-off in NGC 1245.
| Cluster | NGC 1245 | NGC 2506 | ||
|---|---|---|---|---|
| Range | Interval | Range | Interval | |
| age(Gyr) | 0.005 | 0.005 | ||
| [Fe/H] | 0.005 | 0.005 | ||
| 0.005 | 0.002 | |||
| 0.005 | 0.002 | |||
| Cluster | age(Gyr) | [Fe/H] | |||
|---|---|---|---|---|---|
| NGC 1245 | best | ||||
| 0.30 | 12.20 | 1.06 | -0.12 | ||
| 0.21 | 12.32 | 1.08 | -0.09 | ||
| 0.26 | 12.33 | 1.06 | -0.12 | ||
| 0.25 | 12.18 | 1.06 | -0.11 | ||
| 0.27 | 12.33 | 0.9 | -0.09 | ||
| 0.225 | 12.23 | 1.08 | 0.00 | ||
| Padova (Eyeball) | 0.12 | 12.45 | 1.00 | 0.07 | |
| (Eyeball) | |||||
| Previous | |||||
| NGC 2506 | best | ||||
| 0.08 | 12.38 | 2.30 | -0.24 | ||
| 0.00 | 12.53 | 2.32 | -0.24 | ||
| 0.035 | 12.47 | 2.33 | -0.24 | ||
| 0.035 | 12.46 | 2.32 | -0.24 | ||
| 0.02 | 12.33 | 2.48 | -0.22 | ||
| 0.03 | 12.32 | 2.47 | -0.23 | ||
| Padova (Eyeball) | 0.02 | 12.4 | 2.5 | -0.32 | |
| (Eyeball) | |||||
| Previous | |||||
The statistical errors presented in Table 4 are very small. However, the uncertainties of the physical parameters can be larger than these errors because they merely represent the statistical errors associated with the minimization. There are other sources of errors that affect the accuracy of the derived physical parameters systematically. Possible causes of systematic errors are the uncertainties related to the photometric calibration, assumed parameters such as the total-to-selective extinction ratio , limiting magnitudes of observed data and the theoretical models for isochrone fittings. In order to know the systematic errors in the derived physical parameters, we performed some experiments by varying the assumed parameters and theoretical models. We present the results in Table 4.
From equation (1) and (2), systematic errors associated with the calibration of the photometry can be caused by uncertainties in the extinction and transformation coefficients and zero points. But we examined only the effect of the uncertainties in the zero points ( and ) because the calibration coefficients which are provided by CHFT web site are assumed to be well determined. We derived physical parameters from the data with the zero point shifts of and and found that the systematic errors in and are relatively large.
Since systematic uncertainties in affect the cluster parameters, variations in alter the color at fixed (Burke et al., 2004), we performed minimization procedures to derive cluster parameters with and using the same grid search. We found that the systematic errors associated with the variation are similar to or less than the statistical errors, except for those in the distance modulus of NGC 1245.
In Fig. 5 and Fig. 6, there is a non-negligible discrepancy between the observations and the theoretical isochrones for the lower main-sequence stars (). This effect is most serious for stars in of NGC 2506. Due to this discrepancy, the derived cluster parameters can be changed if we assume different limiting magnitude for isochrone fittings. To estimate the uncertainties related to the discrepancy between the models and the observations, we performed the same procedures again to derive the cluster parameters with limiting magnitudes of and . The systematic errors related to the are generally larger than the statistical errors and they are larger in NGC 1245. But, the systematic errors in are larger in NGC 2506. The reason for the larger uncertainties in the parameters of NGC 1245 is partly due to the broad distribution of stars near the turn-off and upper main-sequence of NGC 1245. The large systematic error in in NGC 2506 seems to be caused by the maximum discrepancy between the models and observations at in NGC 2506.
Since the cluster parameters derived from isochrone fittings significantly depend on the theoretical models, we used the Padova isochrones (Girardi et al., 2000) for comparison models. However, we did not apply minimization procedures because we do not have interpolation programs for the Padova isochrones. Rather, we applied eye-ball fittings for both the isochrones and the Padova isochrones and compared the derived cluster parameters. As can be seen in Table 4, the systematic errors resulting from the theoretical models are much larger than the statistical errors but comparable to the systematic errors associated with the assumed parameters. In general, the systematic errors associated with the theoretical models are larger in NCC 1245 than NGC 2506. The largest difference is observed in the age of NGC 2506.
We calculated the systematic errors of cluster parameters from the derived values in Table 4 by assuming that we explored typical values of , and zero point shifts in the derivation of cluster parameters. Actually, we considered the standard deviations of the cluster parameters resulting from different sets of assumed parameters (zero points, and ) and theoretical models as the systematic errors of the cluster parameters. Then, the total systematic error () can be determined by a quadratic sum of the systematic errors as
| (6) |
here and are systematic errors associated with the parameters and , respectively, and is the systematic error related to the theoretical models. Then, the total error () can be written as
| (7) |
where is the statistical error related to the minimization. In Table 4, we present the total uncertainties in each cluster along with the statistical errors and the systematic errors. However, the actual uncertainties in the derived cluster parameters can be larger than these values since we did not consider the errors associated with the unresolved binaries and the field star contamination. Our estimates of the systematic errors are similar to those of Burke et al. (2004) who derived the cluster parameters by the same method as ours and the total uncertainties are comparable to those of Janes & Hoq (2011) who derived the cluster parameters using synthetic CMDs.
4 Luminosity Function
4.1 Construction of Luminosity Function
Our observed area was wide enough to cover the field region as well as the cluster region. To derive the LFs of the open clusters, we first determined the cluster extent by examining the surface density distribution of the observed area. The radius at which the surface number density radial profiles of the stars becomes constant was taken to be . The field regions can then be defined as the region . From this, we derived the field star population, which was required to correct the open cluster LFs. The cluster radii were and for NGC 1245 and NGC 2506, respectively. We derived the LFs by counting the number of stars in each bin of magnitude for the -band photometry of the cluster region with the correction of field stars as follows:
| (8) |
where is the number of stars for each magnitude bin in the cluster region, is that of the field region, and and are the areas of the cluster and field regions, respectively. Here, we assumed that all the field regions have the same LF, but this is not usually true because there are fluctuations in the surface number densities of the field stars as well as inhomogeneous field star populations.


| Dispersion (stars/(arcmin)2) | ||
|---|---|---|
| NGC 1245 | NGC 2506 | |
| -1.0 | 0.007 | 0.036 |
| 0.0 | 0.010 | 0.046 |
| 1.0 | 0.004 | 0.041 |
| 2.0 | 0.022 | 0.090 |
| 3.0 | 0.033 | 0.081 |
| 4.0 | 0.039 | 0.117 |
| 5.0 | 0.024 | 0.100 |
| 6.0 | 0.079 | 0.193 |
| 7.0 | 0.137 | 0.166 |
| 8.0 | 0.083 | 0.128 |
| 9.0 | 0.142 | 0.164 |
| 10.0 | 0.459 | 0.135 |
| 11.0 | 0.192 | 0.082 |
In order to take into account the uncertainties arising from the fluctuations in different directions, we constructed LFs of the field regions surrounding the clusters (see Fig. 9 and Fig. 10 for NGC 1245 and NGC 2506, respectively). The LFs of the NGC 1245 field regions were very similar to each other except for the large difference at . This large difference was caused partly by the different limiting magnitudes of the individually observed regions and partly by large photometric errors at the faintest magnitudes. While the four field LFs were nearly the same in NGC 1245, the field LFs in the south of NGC 2506 were much different from those in the north of NGC 2506. More specifically, the number of stars in the southern fields of NGC 2506 was larger than that in the northern fields. Since NGC 2506 is located in the north of the Galactic plane, the difference seen in Fig. 10 was due to the density gradient along the Galactic latitude. Because the LFs of the open clusters were affected by those of the field regions, the dispersions in the field LFs are listed in Table 5 as a measure of the uncertainties caused by the correction. If we consider the errors of the cluster LFs as the dispersions in the field LFs scaled to the area of the cluster, they become larger than the Poisson errors, but this seems to be more a meaningful way to represent the errors in the cluster LFs (Phelps & Janes, 1993).


4.2 Characteristics of Luminosity Functions
The LFs of NGC 1245 and NGC 2506 are shown in Fig. 11 and Fig. 12. The logarithmic error bar was scaled by area using Table 5 as follows:
| (9) |
| (10) |
Here, and are the positive and negative errors, respectively, and is the LF dispersion of the field region as listed in Table 5. Our observing limit was , but near for NGC 1245, the uncertainties increased dramatically because of the different limiting magnitudes of each observing region.
Stars brighter than are thought to be turn-off and giant stars in NGC 1245 and NGC 2506. Comparing the bright parts of the LFs of NGC 1245 and NGC 2506, the number of bright stars in NGC 1245 is larger than that in NGC 2506. The reason for the larger number of brighter stars in NGC 1245 is the younger age of NGC 1245. The age of NGC 2506 is nearly twice that of NGC 1245. And the giant clump stars of are more developed in NGC 2506.
The LF of NGC 1245 is nearly flat. The flat LF of NGC 1245 could be caused by the dynamical evolution which makes the low-mass stars evaporate from the cluster because the LF of the cluster is expected to increase monotonically toward the faint magnitudes to at least . The LF of NGC 2506 is similar to that of NGC 1245, but they do differ. While the LF of NGC 1245 is relatively flat between and , the LF of NGC 2506 shows a gradual increase toward fainter magnitudes. It seems unlikely that this difference is due to the errors in the field star correction because the dispersions in the field LFs are not large enough to erase the rising tendency toward the faint magnitudes. It seems worthy to note that the LF of NGC 2506 is derived from a slightly larger area than that of NGC 1245, which may include regions where evaporating stars are likely to be located, at least temporarily. The radial dependencies of the LFs of NGC 1245 and NGC 2506 show that the peak at in the LF of NGC 2506 is most pronounced in the LF derived from the outer regions.
In Fig. 13, we compare the LFs of NGC 1245 and NGC 2506 with that of the solar neighbourhood (Binney & Merrifield, 1998). Because turn off magnitudes are about and 3.5 for NGC 1245 and NGC 2506, respectively, we normalized the LFs at to avoid evolutionary effects. In this figure, we can see a similar global pattern between the solar neighbourhood and the open clusters, but the number of bright stars in the LFs of NGC 1245 and NGC 2506 is slightly larger than that of the solar neighbourhood, while the opposite is true for the number of faint stars. We believe this feature is caused by the evaporation of low-mass stars in NGC 1245 and NGC 2506 because they are old enough to expect this kind of dynamical evolution and mass segregation.


5 Mass Function
The mass function is a useful tool for studying the IMF and to understand the star formation process in general as well as the structure and evolution of a stellar system. In order to construct the mass function of NGC 1245 and NGC 2506, we used the mass-luminosity relation of Schaller et al. (1992) for stars with and that of Henry & McCarthy (1993) for –. Fig. 14 and Fig. 15 show the mass functions of NGC 1245 and NGC 2506 derived by counting the stars in the mass interval inside . The uncertainties in the mass function were derived from the dispersions of the field region mass functions, similar to the uncertainties of the LFs. We derived the slope of mass function
| (11) |
by a least-squares fit, weighted by dispersions in the MFs of field regions. We obtained for NGC 1245 and for NGC 2506 with fitting ranges of and , respectively for NGC 1245 and NGC 2506.
The derived values of the two clusters were slightly shallower than the slope of the solar neighbourhood IMF: (Salpeter, 1955). In the case of NGC 1245, the present value is similar to those reported by Carraro & Patat (1994) and Subramaniam (2003) who derived a similar but shallower slope than the Salpeter value. The slopes of the mass functions of NGC 1245 and NGC 2506 were thought not to be the same as the slope of the respective IMFs because of their age; evaporation of the low-mass stars results in a shallower slope.
6 Summary
We conducted deep and wide photometry of old open clusters NGC 1245 and NGC 2506 based on CCD observations using the CFHT. The present photometry is suitable for investigating dynamical evolution in open clusters because it is deep enough to reach down to and wide enough to cover the entire regions of the two clusters including the field regions for an effective correction of the field star contamination.
We derived the physical parameters of the two clusters using detailed isochrone fittings based on minimization: and , and , and , and [Fe/H]= and for NGC 1245 and NGC 2506, respectively. The quoted errors are the total errors which are quadratic sum of statistical errors associated with the and systematic errors related to the assumed parameters and theoretical models. The present estimates of the physical parameters of two clusters are in good agreement with the previous estimates.
We also derived the LFs of NGC 1245 and NGC 2506. The LF of NGC 1245 shows a flat profile between and , whereas the LF of NGC 2506 displays a slight rise. This difference seems to be not due to the errors related to the field star correction but due to the dynamical structures, which can differ because dynamical evolution can be different for clusters of a similar age as it is affected by the environment as well as by the internal properties of the cluster. We derived the mass functions of NGC 1245 and NGC 2506, which show slightly shallower slopes than that of the solar neighbourhood IMF. The shallower slope is understandable if we consider that the derived mass function is the present day mass function, which is thought to be different from the IMF of the clusters due to dynamical evolution, since the ages of NGC 1245 and NGC 2506 are old enough for mass segregation and evaporation of low-mass stars. We will discuss the dynamical properties, structures and halo of these two clusters in a forthcoming paper.
Acknowledgments
This work was supported for two years by Pusan National University Research Grant. YWK was supported in part by the research grant from KASI (Korea Astronomy and Space Science Institute).
References
- Binney & Merrifield (1998) Binney, J., Merrifield, M. 1998, Galactic Astronomy (Princeton : Princeton Univ. Press)
- Burke et al. (2004) Burke C. J., Gaudi B. S., DePoy D. L., Pogge R. W., Pinsonneault M. H., 2004, AJ, 127, 2382
- Cardelli et al. (1989) Cardelli, J. A., Clayton, G. C., & Mathis, J. S. 1989, ApJ, 345, 245
- Carraro & Patat (1994) Carraro G., Patat F., 1994, A&A, 289, 397
- Chiu & van Altena (1981) Chiu, L.-T. G., van Altena, W. F., 1981, ApJ, 243, 841
- Demarque et al. (2004) Demarque, P., Woo, J.-H., Kim, Y.-C., Yi, S. K., 2004, ApJS,155, 667
- Girardi et al. (2000) Girardi, L., Bressan, A., Bertelli, G., & Chiosi, C. 2000, A&A, 141, 371
- Grocholski & Sarajedini (2003) Grocholski, A. J., Sarajedini, A. 2003, MNRAS, 345, 1015
- Henderson et al. (2007) Henderson C., B., Deliyannis C. P., Hughto J., Simmons A., Croxall K., Sarajedini A., Platais I., 2007, AAS, 211, 5819
- Henry & McCarthy (1993) Henry, T, J., McCarthy, D, W., Jr., 1993, AJ, 106, 773
- Janes (1979) Janes, K. A., 1979, ApJS, 39, 135
- Janes & Hoq (2011) Janes, K. A., Hoq, S. 2011, AJ, 141, 92
- Landolt (1992) Landolt A. U., 1992, AJ, 104, 340
- Lyngå (1987) Lyngå, G., 1987, Catalogue of Open CLuster Data (5th ed.; Strasbourg: CDS)
- Marconi et al. (1997) Marconi G., Hamilton D., Tosi M., Bragaglia A., 1997, MNRAS, 291, 763
- Peruanskii & Ryadchenko (1978) Peruanskii S. S., Ryadchenko V. P., 1978, SvA, 22, 34
- Phelps & Janes (1993) Phelps, R. L., Janes, K. A., 1993, AJ, 106, 1870
- Purgathofer (1964) Purgathofer A., 1964, Zeitschrift fu”r Astrophysik, 59, 79
- Salpeter (1955) Salpeter, E. E., 1955, ApJ, 121, 161
- Schaller et al. (1992) Schaller, G., Schaerer, D., Meynet, G., Maeder, A, 1992, A&AS, 96, 269
- Stetson (1987) Stetson P. B., 1987, PASP, 99, 191
- Subramaniam (2003) Subramaniam A., 2003, BASI, 31, 49
- Wee & Lee (1996) Wee S.-O., Lee M. G., 1996, JKAS, 29, 181