The Schmidt-Kennicutt Law of Matched-Age Star Forming Regions; Pa Observations of the Early-Phase Interacting Galaxy Taffy I
Abstract
In order to test a recent hypothesis that the dispersion in the Schmidt-Kennicutt law arises from variations in the evolutionary stage of star forming molecular clouds, we compared molecular gas and recent star formation in an early-phase merger galaxy pair, Taffy I (UGC 12915/UGC 12914, VV 254) which went through a direct collision 20 Myr ago and whose star forming regions are expected to have similar ages. Narrow-band Pa image is obtained using the ANIR near-infrared camera on the mini-TAO 1m telescope. The image enables us to derive accurate star formation rates within the galaxy directly. The total star formation rate, , was found to be much higher than previous estimates. Ages of individual star forming blobs estimated from equivalent widths indicate that most star forming regions are 7 Myr old, except for a giant HII region at the bridge which is much younger. Comparison between star formation rates and molecular gas masses for the regions with the same age exhibits a surprisingly tight correlation, a slope of unity, and star formation efficiencies comparable to those of starburst galaxies. These results suggest that Taffy I has just evolved into a starburst system after the collision, and the star forming sites are at a similar stage in their evolution from natal molecular clouds except for the bridge region. The tight Schmidt-Kennicutt law supports the scenario that dispersion in the star formation law is in large part due to differences in evolutionary stage of star forming regions.
1 Introduction
Understanding the nature and physics which underly the relation between star formation rate (SFR) and gas density is crucial for understanding galaxy evolution and star formation history of the universe. The most thoroughly investigated expression of this relation is the Schmidt-Kennicutt (SK) law (Kennicutt, 1998), the empirical power-law relation between surface densities of SFR () and molecular gas (), written as
| (1) |
The power law index is typically found to be for the commonly used molecular gas tracers (Heyer et al., 2004; Komugi et al., 2005) and (Schuster et al., 2007), but when dense gas tracers such as high CO transitions and HCN are used to trace (Gao & Solomon, 2004; Komugi et al., 2007; Bigiel et al., 2008; Muraoka et al., 2009; Iono et al., 2009). This is typically interpreted as the dense gas tracing individual units of star formation (Wu et al., 2005), which forms stars at a constant efficiency.
A less emphasized aspect of the SK law is its dispersion around the relation. Much of the dispersion can be attributed to uncertainties in calibrating and , as frequently used massive star formation tracers such as H are strongly affected by dust extinction (Komugi et al., 2007), and molecular gas mass depends on the assumed CO-to- conversion factor, , which can vary significantly with environment (e.g., Arimoto et al., 1996; Israel, 1997; Komugi et al., 2011). SK laws studied over a scale of several kilo-parsecs (Kennicutt, 1998; Komugi et al., 2005; Schuster et al., 2007; Onodera et al., 2010) typically scatter at least factor of . Recent studies (Kennicutt et al., 2007; Schruba et al., 2010; Onodera et al., 2010; Liu et al., 2011) have found that the dispersion in the SK law increases as smaller regions are sampled within the galaxy, which are unlikely to be explained by observational uncertainties. The significant dispersion is attributed to differences in the evolutionary stage of the molecular clouds (Onodera et al., 2010), which may be a large scale manifestation of molecular cloud types proposed by Kawamura et al. (2009).
An interesting test of this hypothesis is to see whether the dispersion of the SK law decreases significantly when star forming molecular clouds of comparable age are sampled. An interacting galaxy system is an ideal target for this purpose. Star formation is expected to be triggered by galaxy collision (Barnes & Hernquist, 1996; Saitoh et al., 2009), and indeed interacting galaxies such as the Antennae (Whitmore et al., 1999; Wilson et al., 2000; Ueda et al., 2012) and IIZw 096 (Inami et al., 2010) are known to host exceptionally young stellar clusters in the overlapping region and tidal tails. If the interaction occurs over a timescale that is less than a typical timescale of star formation or molecular cloud evolution, and recent enough so that there has been time for only one generation of star formation, then the galactic collision-induced star formation in various regions of the system are expected to be at a comparable evolutionary stage. The interacting galaxy pair Taffy I, is a rare laboratory which meets these requirements.
1.1 Taffy I
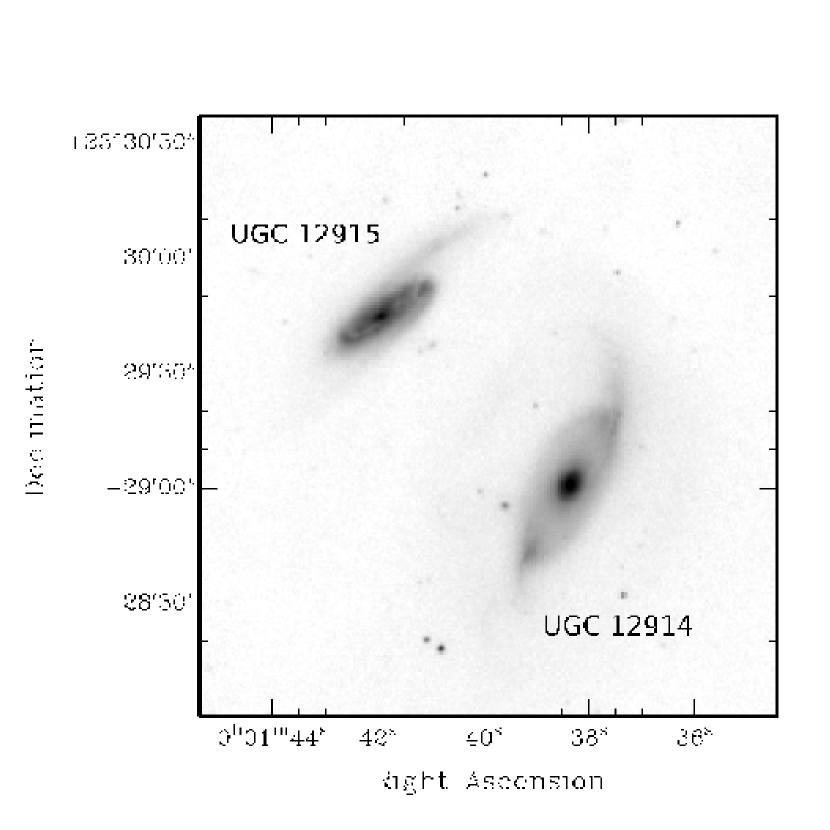
Taffy I (see figure 1) is an interacting system consisting of two galaxies (UGC12914/15) and the “bridge”, an extended shock-induced synchrotron component connecting the two galaxies (Condon et al., 1993, hereafter C93). The distance is estimated to be 61 Mpc, from the systemic HI velocity of (C93) and Hubble constant of . The steepening of spectral index at the bridge and the simulated trajectory of the galaxies indicate a face-on collision which occurred only 20 Myr ago (C93). The galaxies are separating at a velocity of for the assumed Hubble constant (C93), and the relative inclination of the disks is (Giovanelli et al., 1986). For a star forming disk of 7 kpc diameter (the separation between star forming regions E and G in UGC12915; see following sections and figure 1), the duration of the disk-disk collision is estimated to be Myr. This is much less than the typical timescale of star formation in galactic disks (several 10 Myr; Egusa et al., 2004, 2009) or the timescale of giant molecular clouds to evolve (6-13 Myr; Kawamura et al., 2009). Thus, the collision was instantaneous in terms of the star formation history of this system, and recent enough so that the triggered star formation would not have evolved for more than a generation.
Star formation is evident from H and mid infrared observations, in both galactic disks and notably in the bridge region, where a giant HII region has been found (Bushouse, 1987). The SFR of this system has not been well measured, however, because commonly used tracers fail to trace massive star formation reliable in this galaxy.
H observation (Bushouse, 1987) indicates a total SFR of (see section 3.2) . However, the center of UGC 12915 was virtually undetected in H, indicating severe dust extinction. Gao et al. (2003) used the 20cm continuum to derive the star formation rate, but cautioned that the 20cm is contaminated largely in the bridge by the shock-induced synchrotron emission (C93) which is unrelated to the massive star formation. Seven micron PAH features have been observed by Jarrett et al. (1999), which returned a low global star formation rate of if we assume a conversion factor to SFR by Roussel et al. (2001), but using a common conversion factor of mid-infrared PAH emission to SFRs is debatable in Taffy I, as the small dust particles traced at these wavelengths could have been destroyed by the strong shock induced by the large scale galactic collision (Braine et al., 2003). The total infrared luminosity of L(IR) corresponds to a SFR of using the conversion factor by Kennicutt (1998). This estimate is larger compared to those using other tracers, but the conversion factor assumes continuous and constant star formation over 10-100 Myr, which is questionable in these colliding galaxies.
Obtaining a more reliable estimation of the SFR within Taffy I and its age, requires an unbiased measure of massive star formation. The Pa emission line () is suited for this goal, as the magnitude of its dust extinction is only 1/6 of that of H, and can trace massive star formation more directly than infrared dust emission. Therefore, we have carried out a narrow-band imaging observation of the redshifted Pa emission line.
2 Observation and Data Reduction
Narrow-band images by the filter (, ) covering the redshifted Pa emission line and broad-band images in the and bands were obtained on 2010 October 9, 16, and 17, with Atacama Near Infrared camera (ANIR; Motohara et al., 2008) on the University of Tokyo Atacama 1.0m telescope (Minezaki et al., 2010) installed at the summit of Co. Chajnantor (5640m altitude) in northern Chile, which is a part of the University of Tokyo Atacama Observatory Project (PI: Yuzuru Yoshii; Yoshii et al., 2010). The extremely low precipitable water vapor (PWV 0.5mm) of the site enables observations of the Pa emission line from the ground (Motohara et al., 2010).
Exposure times are 12420s, 2160s and 2160s for , , and , respectively. Standard reduction procedures of flat-fielding, self-sky creation and subtraction, and shift-and-add are carried out to obtain a final image for each band. Flux zero-point are calculated using the magnitudes of 2MASS stars in the field of view. The typical seeing is . The 1.91m continuum image is produced by the final images of the and band, and an emission-line image is created by subtracting the 1.91m continuum image from the image.
There are many atmospheric absorption features within the wavelength range of the filter, which also vary temporally due to change of PWV. Therefore, we have used a newly developed method to restore Pa line flux from an emission line image by estimating atmospheric absorption at the wavelength of the line, using model atmosphere by ATRAN software (Lord, S. D., 1992). This method is confirmed to reproduce the real flux within an accuracy of 10%, by comparing the Pa narrow-band images taken with HST/NICMOS (Tateuchi et al. in prep.). The actual factor introduced by the ATRAN correction to our Pa data was 1.12, corresponding to PWV of .
3 Results
3.1 Pa Morphology
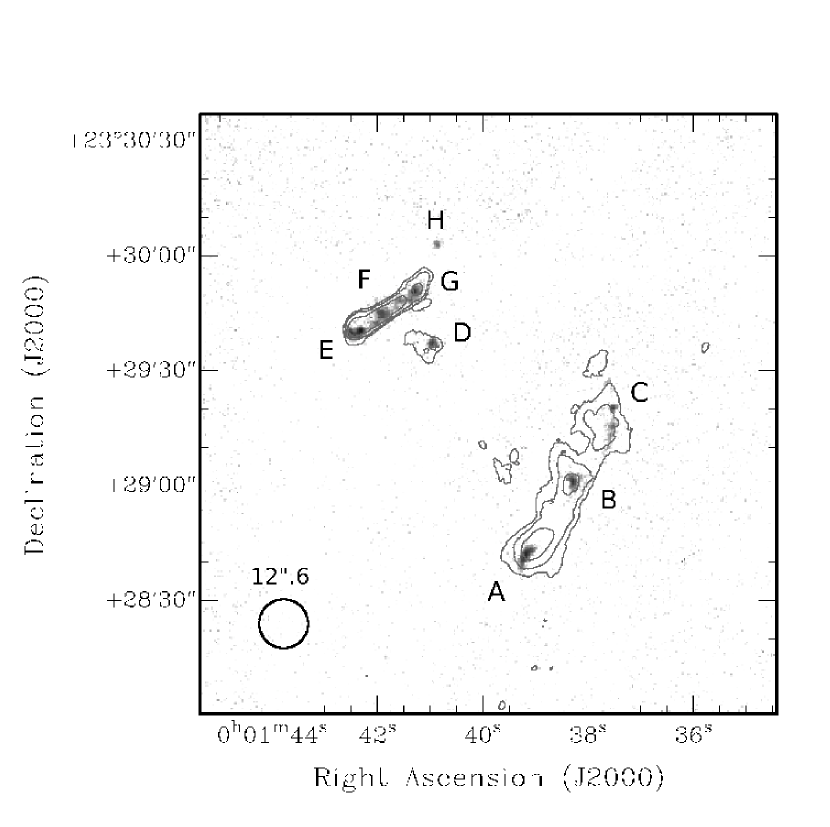
The bottom panel of Figure 1 shows the continuum-subtracted Pa image of Taffy I. Most star formation in this system as traced by Pa is found to exist in discrete “blobs” which we denote as regions A through H. The blobs are located in the centers of each galaxies (regions B and F), and on their spiral arms (regions A,C,E and G). A notable blob is seen in the northern tail of UGC 12915 (region H), which is also bright in H (Bushouse, 1987). The giant HII region in the bridge (region D) is almost as bright as those at the galaxy centers.
3.2 Star Formation Rate
Bushouse (1987) observed Taffy I in H, giving luminosities and , corresponding to SFRs of 0.93 and 0.50 using the prescription of Kennicutt (1998) for UGC 12914 and UGC 12915, respectively.
We compare the observed Pa and H fluxes in each of the regions, assuming intrinsic line ratio of ( and case B recombination; Osterbrock, 1989) and derive average dust extinction and extinction corrected Pa flux (Table 1) using the Rieke & Lebofsky (1985) extinction law. The extinction corrected Pa luminosity (Pa) and the assumed line ratios are used to obtain the intrinsic H luminosity, and then to SFR using the prescription by Kennicutt (1998). Bushouse (1987) assign an error of to the H photometric flux. Combined with the 10% uncertainty in the Pa and error propagation in the calculations, the final error in the extinction corrected Pa flux is estimated to be . The flux for each of the blobs is measured using a circular aperture of diameter, corresponding to a projected scale of 3.7 kpc. Subtraction of diffuse emission (if any) is done using an annulus with a width of around each aperture.
Derived values for each of the star forming blobs are listed in table 1. The total star formation rate of UGC 12914 and UGC 12915 (sum of constituent blobs) are and , totaling , an order of magnitude higher than those derived from H (Bushouse, 1987), or factor 4 higher than that based on the PAH emission (Jarrett et al., 1999; Roussel et al., 2001). It is also nearly two times higher than the global SFR derived from the total IR luminosity. Since the Pa traces massive star formation more directly than the PAH or IR luminosity, it is possible that the SFR derived from these secondary tracers underestimate the true SFR because of dust destruction (Braine et al., 2003), or due to the assumption of continuous star formation over 10-100 Myr in the case of the total IR luminosity.
4 Discussion
4.1 Age
Equivalent widths of the Pa line are derived by dividing the Pa image with the continuum. Approximate ages of the blobs are estimated from the equivalent widths using figure 5 of Díaz-Santos et al. (2008) which is based on Starburst99 (Leitherer et al., 1999) with an instantaneous burst, and shown in Table 1. The signal to noise ratio (SNR) of the Pa blobs within the measured aperture ranged from SNR 7 to over 20, except for Region H in the faint tail of UGC12915, for which the SNR was 3.3.
The ages of all blobs except for region B (UGC 12914 center) and region D (the bridge) are Myr. Region D is significantly younger, less than 3.5 Myr. Region B is somewhat older, which is likely a contribution from an older population of stars as this is the center of the galaxy. In any case, the estimated ages of the star forming blobs are less than 20 Myr, the estimated time since the collision of the two galaxies. The ages are surprisingly uniform considering the time since collision, but this may be explained by the Pa observation sampling the brightest regions in the system which are forming stars most actively at this point.
4.2 Star Formation Efficiency and Schmidt-Kennicutt Law
The total molecular gas mass of this system is estimated to be (Braine et al. (2003); Kaneko et al. submitted) using a CO-to- conversion factor of (Zhu et al., 2007). From the global SFR estimate of , the average star formation efficiency (SFE=SFR/) in Taffy I is , corresponding to a gas consumption timescale of yr. This gas consumption timescale is consistent with typical starburst galaxies (Kennicutt, 1998), and qualifies Taffy I as a starburst galaxy in contrast to indications from previous studies (Gao et al., 2003).
In order to derive the molecular gas mass and SFE of individual blobs, we use interferometric observations of the line (Iono et al., 2005). The angular resolution of the CO data is , sufficient to match the aperture () used to determine the SFRs and the equivalent widths of the Pa emission. For the conversion factor, we use both the average and the values derived individually for UGC12914, UGC12915 and the bridge by Zhu et al. (2007) using a one-zone LVG analysis. The derived gas masses are shown in Table 1 for both cases. The SFEs of the blobs are surprisingly uniform, with , corresponding to yr, when the average conversion factor is used. When different conversion factors are used for the galaxies and the bridge, the bridge has an exceptionally high SFE and short gas consumption timescale, with and yr, whereas all the other regions have nearly constant SFE and , of and yr. These values are all typical of circumnuclear starburst regions in nearby galaxies (Kennicutt, 1998).
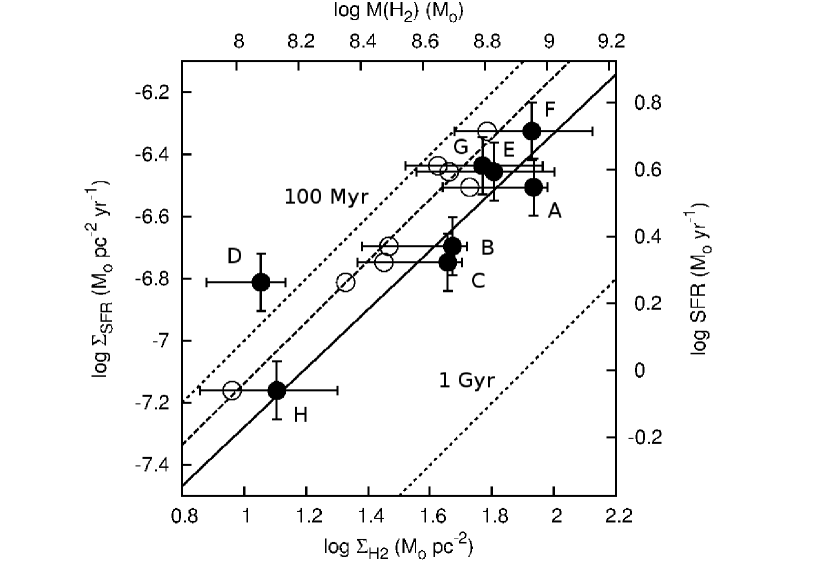
The variation in the SFEs is also apparent from the comparison between molecular gas mass and SFR, shown in Figure 2. Since the projected areas of the apertures are same for all the blobs, Figure 2 can also be regarded as the SK law. For the constant conversion factor, a best-fit to all the blobs results in
| (2) |
and when using different conversion factors, all blobs excluding region D (bridge) results in
| (3) |
The observed power law index of is consistent with those typically observed using dense gas tracers, but not with with the typically observed using .
4.3 Schmidt-Kennicutt Law and Dispersion
The dispersion of the correlation from the best fit is 0.058 dex (14%) in case of using a constant conversion factor, or 0.096 dex (25%) when using different conversion factors and excluding region D. The are comparable to or smaller than uncertainties in the SFR (25%), so uncertainties in the measurement alone can account for the dispersion for all regions with comparable ages, and only the exceptionally young region D is offset significantly from this correlation.
The dispersion can be compared to those in normal galaxies which contain star forming regions at a variety of evolutionary stages. Although we use an aperture with a projected scale of 3.7 kpc, this is limited by the CO resolution. Inspection of the high resolution Pa image reveals that even with this large aperture size, only one bright star forming complex is enclosed in each of the apertures. The effect of averaging over star forming regions which work to decrease (Liu et al., 2011) would not be prominent in our aperture, so we compare the in the literature at a common scale of pc, the typical size of Pa blobs in Taffy I. Liu et al. (2011) derive and for M51 and NGC3521, respectively, at 700 pc resolution. Similarly, we derive a dispersion of from the M33 dataset published by Onodera et al. (2010) at 500 pc resolution, and at 1 kpc resolution. Given that our star forming blobs are distributed widely both within and between galaxies, the measured dispersion in Taffy I is unexpectedly small.
4.4 Star Formation History and Evolution of Taffy I
A stellar mass of a galaxy reflects its integrated star formation history, and therefore the ratio of current star formation rate to total stellar mass (the specific star formation rate; sSFR) indicates the intensity of current star formation relative to its average in the past.
The band magnitudes of UGC12914 () and UGC12915 (; Jarrett et al. (1999)) can be used to estimate their rotation velocities and hence their stellar mass based on the Tully-Fischer relation (Bell & de Jong, 2001), which give stellar mass estimates of and for UGC12914 and UGC12915, respectively. Using the SFR of , the sSFR of Taffy I is . This is five times larger than the average of local () galaxies with similar stellar mass () given by Oliver et al. (2010), indicating that Taffy I is now forming stars much more actively than its average past. The ages of the blobs estimated in the previous section also indicate that the star forming regions studied here are experiencing their first burst of star formation. Apparently, Taffy I has just evolved into a starburst system as a result of the collision which triggered massive star formation.
A scenario of star formation in Taffy I should explain the matched ages of the all regions except region D, and also the apparent delay of star formation in region D.
Braine et al. (2003) and Zhu et al. (2007) suggest that the molecular gas in the bridge was ionized in the collision but cooled promptly, recombined and returned to the molecular state in several to 10 Myr (Bergin et al., 2004), delaying star formation by that time. This scenario requires the cooling time of the gas which created region D to be longer than the timescale of collision ( 2 Myr or less: see section 1.1). The cooling time of molecular gas at and K is years, so the colliding gas may not have had enough time to be heated to delay molecular gas formation compared to other regions. Another possible scenario is that the molecular gas in region D was simply stretched as a result of tidal force, delaying aggregation of gas. Assuming that UGC12915 is the dominant source of tidal force and has , and using molecular mass of and diameter of 1 kpc for Region D, the Roche limit is reached at 5 kpc. The projected distance of region D to UGC12915 is 4 kpc, so the tidal force may be strongly affecting region D. It is plausible that only recently the gas has been able to collapse locally within region D.
Apart from region D, the blobs can be regarded to be in a similar stage in their evolution from molecular gas to stars. The SK law is consistent in this respect, as all the blobs except region D follow an exceptionally tight linear law, which is predicted if our working assumption that variations in the evolutionary stage of molecular clouds are responsible for the dispersion is correct. Since the observed slope of is typically observed with dense gas tracers, we speculate that the blobs in the same evolutionary stage have the same dense gas fraction, giving rise to a linear slope even when observed with that traces the total molecular mass. This can be tested by high resolution observations of dense molecular gas tracers, which should show that the dense gas fraction in these blobs are similar.
5 Summary
This paper presents ground-based narrow band imaging data of Pa emission in Taffy I, an interacting galaxy system which experienced a direct collision only 20 Myr ago. The star formation rate of the system is larger than previous determinations using H, PAH emission, or the far infrared continuum. The newly estimated star formation rate qualifies Taffy I as a starburst system. Ages of the star forming blobs are estimated from equivalent widths of the Pa emission, showing that virtually all the detected star formation occurred after the collision, first in the centers of the galaxies and at the disks, then several Myr later at the bridge region. This delay of star formation in the bridge region may be explained either by the time it took for molecular clouds to cool after it ionized in the collision, or by self gravitational collapse hindered by tidal force of the parental galaxies.
Comparison with interferometric data shows that the star forming blobs with the same age follow an exceptionally tight power law with no significant dispersion, whereas the young star forming region in the bridge is offset from this correlation. The slope of unity is unusual for the SK law using , but typical for cases when dense gas tracers are used to trace molecular gas. These regions all show star formation efficiencies which are comparable to infrared luminous starbursts, and specific star formation rate are much higher than local galaxies with similar stellar mass. We argue that Taffy I has just evolved into a starburst system, and the star forming blobs are at the same evolutionary stage with a constant fraction of dense gas. Our observations support a hypothesis where the dispersion in the SK law is largely due to variations in the evolutionary stage of the molecular clouds, and imply the possibility of defining different SK laws for different populations in a galaxy.
References
- Arimoto et al. (1996) Arimoto, N., Sofue, Y., & Tsujimoto, T. 1996, PASJ, 48, 275
- Barnes & Hernquist (1996) Barnes, J. E., & Hernquist, L. 1996, ApJ, 471, 115
- Bell & de Jong (2001) Bell, E. F., & de Jong, R. S. 2001, ApJ, 550, 212
- Bergin et al. (2004) Bergin, E. A., Hartmann, L. W., Raymond, J. C., & Ballesteros-Paredes, J. 2004, ApJ, 612, 921
- Bigiel et al. (2008) Bigiel, F., Leroy, A., Walter, F., et al. 2008, AJ, 136, 2846
- Braine et al. (2003) Braine, J., Davoust, E., Zhu, M., et al. 2003, A&A, 408, L13
- Bushouse (1987) Bushouse, H. A. 1987, ApJ, 320, 49
- Condon et al. (1993) Condon, J. J., Helou, G., Sanders, D. B., & Soifer, B. T. 1993, AJ, 105, 1730
- Díaz-Santos et al. (2008) Díaz-Santos, T., Alonso-Herrero, A., Colina, L., et al. 2008, ApJ, 685, 211
- Egusa et al. (2004) Egusa, F., Sofue, Y., & Nakanishi, H. 2004, PASJ, 56, L45
- Egusa et al. (2009) Egusa, F., Kohno, K., Sofue, Y., Nakanishi, H., & Komugi, S. 2009, ApJ, 697, 1870
- Gao et al. (2003) Gao, Y., Zhu, M., & Seaquist, E. R. 2003, AJ, 126, 2171
- Gao & Solomon (2004) Gao, Y., & Solomon, P. M. 2004, ApJ, 606, 271
- Giovanelli et al. (1986) Giovanelli, R., Myers, S. T., Roth, J., & Haynes, M. P. 1986, AJ, 92, 250
- Heyer et al. (2004) Heyer, M. H., Corbelli, E., Schneider, S. E., & Young, J. S. 2004, ApJ, 602, 723
- Inami et al. (2010) Inami, H., Armus, L., Surace, J. A., et al. 2010, AJ, 140, 63
- Iono et al. (2005) Iono, D., Yun, M. S., & Ho, P. T. P. 2005, ApJS, 158, 1
- Iono et al. (2009) Iono, D., Wilson, C. D., Yun, M. S., et al. 2009, ApJ, 695, 1537
- Israel (1997) Israel, F. P. 1997, A&A, 328, 471
- Jarrett et al. (1999) Jarrett, T. H., Helou, G., Van Buren, D., Valjavec, E., & Condon, J. J. 1999, AJ, 118, 2132
- Kawamura et al. (2009) Kawamura, A., Mizuno, Y., Minamidani, T., et al. 2009, ApJS, 184, 1
- Kennicutt (1998) Kennicutt, R. C., Jr. 1998, ApJ, 498, 541
- Kennicutt et al. (2007) Kennicutt, R. C., Jr., Calzetti, D., Walter, F., et al. 2007, ApJ, 671, 333
- Komugi et al. (2005) Komugi, S., Sofue, Y., Nakanishi, H., Onodera, S., & Egusa, F. 2005, PASJ, 57, 733
- Komugi et al. (2007) Komugi, S., Kohno, K., Tosaki, T., et al. 2007, PASJ, 59, 55
- Komugi et al. (2011) Komugi, S., Yasui, C., Kobayashi, N., et al. 2011, PASJ, 63, L1
- Leitherer et al. (1999) Leitherer, C., Schaerer, D., Goldader, J. D., et al. 1999, ApJS, 123, 3
- Liu et al. (2011) Liu, G., Koda, J., Calzetti, D., Fukuhara, M., & Momose, R. 2011, ApJ, 735, 63
- Lord, S. D. (1992) Lord, S. D., 1992, NASA Technical Memorandum 103957
- Minezaki et al. (2010) Minezaki, T., Kato, D., Sako, S., et al. 2010, Proc. SPIE, 7733,
- Motohara et al. (2008) Motohara, K., Mitani, N., Sako, S., et al. 2008, Proc. SPIE, 7014,
- Motohara et al. (2010) Motohara, K., Konishi, M., Toshikawa, K., et al. 2010, Proc. SPIE, 7735,
- Muraoka et al. (2009) Muraoka, K., Kohno, K., Tosaki, T., et al. 2009, PASJ, 61, 163
- Oliver et al. (2010) Oliver, S., Frost, M., Farrah, D., et al. 2010, MNRAS, 405, 2279
- Onodera et al. (2010) Onodera, S., Kuno, N., Tosaki, T., et al. 2010, ApJ, 722, L127
- Osterbrock (1989) Osterbrock, D. E. 1989, Research supported by the University of California, John Simon Guggenheim Memorial Foundation, University of Minnesota, et al. Mill Valley, CA, University Science Books, 1989, 422 p.,
- Rieke & Lebofsky (1985) Rieke, G. H., & Lebofsky, M. J. 1985, ApJ, 288, 618
- Roussel et al. (2001) Roussel, H., Sauvage, M., Vigroux, L., & Bosma, A. 2001, A&A, 372, 427
- Saitoh et al. (2009) Saitoh, T. R., Daisaka, H., Kokubo, E., et al. 2009, PASJ, 61, 481
- Sakamoto (1996) Sakamoto, S. 1996, ApJ, 462, 215
- Schruba et al. (2010) Schruba, A., Leroy, A. K., Walter, F., Sandstrom, K., & Rosolowsky, E. 2010, ApJ, 722, 1699
- Schuster et al. (2007) Schuster, K. F., Kramer, C., Hitschfeld, M., Garcia-Burillo, S., & Mookerjea, B. 2007, A&A, 461, 143
- Ueda et al. (2012) Ueda, J., Iono, D., Petitpas, G., et al. 2012, ApJ, 745, 65
- Whitmore et al. (1999) Whitmore, B. C., Zhang, Q., Leitherer, C., et al. 1999, AJ, 118, 1551
- Wilson et al. (2000) Wilson, C. D., Scoville, N., Madden, S. C., & Charmandaris, V. 2000, ApJ, 542, 120
- Wu et al. (2005) Wu, J., Evans, N. J., II, Gao, Y., et al. 2005, ApJ, 635, L173
- Yoshii et al. (2010) Yoshii, Y., Aoki, T., Doi, M., et al. 2010, Proc. SPIE, 7733,
- Zhu et al. (2007) Zhu, M., Gao, Y., Seaquist, E. R., & Dunne, L. 2007, AJ, 134, 118
| Name | Region | SFR | Age | ||||||
|---|---|---|---|---|---|---|---|---|---|
| mag. | Myr | Myr | |||||||
| A | U12914 S | 5.65 | 9.07 | 6.44 | 4.86 (1.72) | 1.86 | 3.30 (1.17) | 2.8 | 6.5 |
| B | U12914 C | 3.10 | 4.97 | 5.56 | 3.14 (1.28) | 0.95 | 2.13 (0.87) | 2.3 | 7.9 |
| C | U12914 N | 2.99 | 4.80 | 5.49 | 2.79 (1.15) | 1.66 | 1.89 (0.78) | 2.5 | 6.8 |
| D | bridge | 2.25 | 1.20 | 6.20 | 2.39 (0.88) | 3.85 | 1.63 (0.60) | 0.7 | 3.5 |
| E | U12915 S | 4.85 | 6.76 | 6.26 | 5.46 (1.99) | 1.54 | 3.70 (1.35) | 1.8 | 6.9 |
| F | U12915 C | 6.43 | 8.96 | 7.22 | 0.74 (0.23) | 1.35 | 5.00 (1.56) | 1.8 | 7.2 |
| G | U12915 N | 4.46 | 6.21 | 7.21 | 0.58 (0.18) | 1.57 | 3.87 (1.21) | 1.6 | 6.9 |
| H | U12915 tail | 0.97 | 1.35 | 5.54 | 1.08 (0.44) | 1.82 | 0.73 (0.30) | 1.9 | 6.6 |