Origin of rebounds with a restitution coefficient larger than unity in nanocluster collisions
Abstract
We numerically investigate the mechanism of super rebounds for head-on collisions between nanoclusters in which the restitution coefficient is larger than unity. It is confirmed that the temperature and the entropy of the nanocluters decrease after the super rebounds by our molecular dynamics simulations. It is also found that the initial metastable structure plays a key role for the emergence of the super rebounds.
pacs:
82.60.Qr, 45.50.-j, 45.70.-n, 83.10.RsI Introduction
Nanoclusters are technologically important for the construction of nanodevices. Because the size of nanoclusters is mesoscopic, thermodynamic properties of such materials are still not well understoodhill , though the methods to make nanoclusters such as adiabatic expansion through a nozzle and a laser ablation technique are well established.baletto
Dynamics of nanoclusters are extensively investigated from both scientific and technological interest. There are many numerical studies on cluster-cluster and cluster-surface collisions based on the molecular dynamics simulation. awasthi2010 ; awasthi2010-2 ; han ; kuninaka_hayakawa_PRE2009 ; saitoh_prog ; suri ; antony ; awasthi ; kalweit06 ; kalweit ; tomsic ; yamaguchi ; harbich ; valentini ; knopse ; ming We observe variety of rebound processes for such systems caused by the competition between the attractive interaction and the repulsive interaction of two colliding bodies. Binary collisions of identical clusters cause coalescence, scattering, and fragmentation depending on the cluster size and the impact energy. kalweit06 ; kalweit On the other hand, cluster-surface collisions induce soft landing, embedding, and fragmentation.saitoh_prog ; harbich ; valentini The attractive interaction plays crucially important roles in collisions of nanoclusters, so that the modeling of the cohesive collisions in various scale are actively discussed in these days.brilliantov07 ; kim ; kosinki .
However, the attractive interaction can be reduced by some combinations of the two interacting objects and the relative configuration of colliding molecules.sakiyama Awasthi et al. introduced a modified Lennard-Jones model to simulate the rebound process of a cluster onto a surfaceawasthi , in which they introduced a cohesive parameter to reduce the attractive interaction between different atoms on the surface. There exists a corresponding experiment on the rebound process of Bi nanoclusters on a Si surface with the aid of a V-shaped template etched on a silicon wafer.awasthi2010 This suggests that the modified Lennard-Jones clusters can approximately describe collisions of real clusters. Similarly, recent papers have reported that surface-passivated Si nanoclusters exhibit elastic rebounds on Si surface due to the reduction of the attractive interaction between the surfaces.suri ; hawa ; saitoh In particular, Saitoh et al. confirmed that the behavior in collisions of modified Lennard-Jones clusters is similar to that of H-passivated Si clusters from their simulation.saitoh These results also support that the modified Lennard-Jones model can be regarded as a simplified model of nanoclusters.
In general, thermal fluctuation also plays an important role for small systems such as nanoclusters. Indeed, the present authors carried out the molecular dynamics simulation of colliding thermally activated modified Lennard-Jones clusters to investigate the impact phenomena and found the existence of the “super-rebound” in which the restitution coefficient is larger than unity.kuninaka_hayakawa_PRE2009 Recently, it has been reported that such a rebound can be observed in a molecular dynamics simulation of a collision of Cu nanoparticles on a rigid wall.han In addition, another research group has reported that large recovery strain after loading (called super-elasticity) can be found in a small system.Kenichi_Saitoh Although there is a possibility that such an anomalous mechanical property of small systems is also concerned with the emergence of “super rebounds”, the underlying mechanism for the “super rebounds” is still unclear.
In macroscopic systems, the restitution coefficient larger than unity can be observed in oblique collisions between a hard sphere and a soft elastic plate louge ; kuninaka_hayakawa_PRL2004 , which differs from the super rebound. Indeed, the restitution coefficient can easily become larger than unity if the rebound direction is changed in oblique collisions. As another example, a recent study reported that the large-scale magnetized plasmoids can gain the increased kinetic energy after collision in the heliosphere.shen On the contrary, in microscopic systems such as nanoclusters, the true “super rebounds” can be observed in normal collisions, which implies that a part of thermal energy is converted to macroscopic degrees of freedom. This may imply a possibility to make a nanoscale object which extracts work from its internal energy. Although the averaged behavior of the restitution coefficient against the relative impact speed can be approximately understood by the macroscopic theory of cohesive collisions,brilliantov07 ; kuninaka_hayakawa_PRE2009 the mechanism of curious energy transfer against intuition of the thermodynamics is important to both fundamental physics and energy technology.
The aim of this paper is to study the mechanism of the super rebounds from the viewpoint of the energy transfer between the microscopic and the macroscopic degrees of freedom. For this purpose, we investigate the characteristics of thermodynamic functions such as temperature and entropy in the super rebounds based on the molecular dynamics simulation. In addition, we also investigate the change in structures of the colliding nanoclusters characterizing super rebounds by the introduction of Steinhart’s order parametersteinhardt and some related geometrical order parameters.
The organization of this paper is as follows. In the next section, we introduce our nanocluster model. In Sec. III we show the results of our molecular dynamics simulations. In Sec. IV we discuss the reason why super rebounds can be observed in our simulation. Section V is devoted to the summary of this work. In Appendices A and B, we explain the method of calculating entropy in our simulation and how to calculate Steinhardt’s order parameters, respectively.
II Model
Let us introduce our model. Our model consists of two identical nanoclusters, each of which contains “atoms” (Fig. 1). The clusters have facets due to the small number of “atoms”. To construct one cluster, we first make the face-centered cubic crystal of layers of atoms.
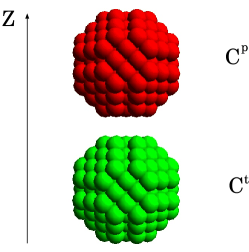
Next, we cut out a spherical cluster from the cube. In Fig.1, we call the upper projectile and the lower target clusters Cp and Ct, respectively. All the atoms in one cluster are bound together by the modified Lennard-Jones potential
| (1) |
where is the distance between two arbitrary atoms and in this system, and are the core diameter and the scale of energy, respectively. Here, is the cohesive parameter which changes the magnitude of cohesion between atoms. In our simulation, we adopt between the atom on the lower surface of Cp and the atom on the upper surface of Ct while between all the atoms in each cluster. Here the definition of the surface and the bulk atoms is as follows. Each cluster consists of layers of atoms. We define the atoms outside the concentric inscribed sphere as the surface atoms while the other atoms as the bulk atoms. We assume that the surface atoms are different from the bulk atoms, which may cause the weak cohesive interaction between the clusters.awasthi ; sakiyama
Let us introduce the volume fraction which is defined by
| (2) |
where is the number density.

Figure 2 is the relationship between and the initial potential energy of one cluster. To construct a cluster, we adopt the value for as in which the potential energy is minimum, while we adopted in our previous work. kuninaka_hayakawa_PRE2009
The procedure of our simulation is as follows. As the initial condition of the simulation, the centers of mass of Cp and Ct are placed along the axis with the separation between the centers of mass of Cp and Ct, where is the radius of the cluster (Fig. 1). The two clusters are placed in mirror symmetric positions with respect to so that a facet of one cluster is placed face-to-face with that of another cluster. We have checked that the relative rotational orientation of the clusters around -axis little affect the relationship between the restitution coefficient and the colliding speed in our previous work. kuninaka_hayakawa_PRE2009 The initial velocities of the atoms in both Cp and Ct satisfies the Maxwell-Boltzmann distribution with the initial temperature . The sample average is taken over different sets of initial velocities.
We numerically solve the equation of motion of each atom described by
| (3) |
where and are the mass of an atom and the position of the -th atom, respectively. is the modified Lennard-Jones force which is calculated from Eq. (1) as
| (4) |
Numerical integration of the equation of motion for each atom is carried out by the second order symplectic integrator with the time step . To reduce computational costs, we introduce the cut-off length of the Lennard-Jones interaction as . The rate of energy conservation, , is kept within , where is the initial energy of the system and is the energy at time .
We equilibrate the clusters by using the velocity scaling method woodcock ; nose as the thermostat in the initial simulation steps. Here, we introduce the kinetic temperature,
| (5) |
where and are the number of atom and the velocity of the center of mass of one cluster, respectively. It has been confirmed that the temperature of the system converges on a desired temperature during the equilibration.
After the equilibration we give the translational velocity to Cp and Ct to make them collide against each other without the thermostat. We give the translational speed with the acceleration . The typical value of the relative impact speed in our simulation is , which is slightly less than the thermal velocity of the system defined by when .
III Simulation Results
III.1 Macroscopic Properties
Here we show the macroscopic properties of the colliding nanoclusters in our simulation. To characterize the rebound behavior of macroscopic inelastic collisions, we calculate the restitution coefficient defined by
| (6) |
where is the component of the relative translational speed of Cp to Ct, and is the scaled time of separation of the clusters, . We define the time of separation by the time when the relative rebound speed becomes stable after the collision.
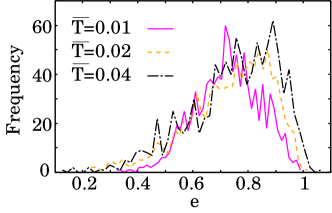
Figure 3 shows the histograms of for initial temperatures and , respectively. Each histogram is constructed from 1000 samples with the initial speed of . We find samples of the super rebound at while all samples are the ordinary rebounds at . At we found that only 1 sample is the super rebound. On the other hand, if we adopt , most of the rebounds are ordinary. We can find only two samples of super rebounds even at . Thus, the super rebounds can be observed only if the colliding speed is lower or almost equal to the thermal speed.
III.2 Thermodynamic Properties
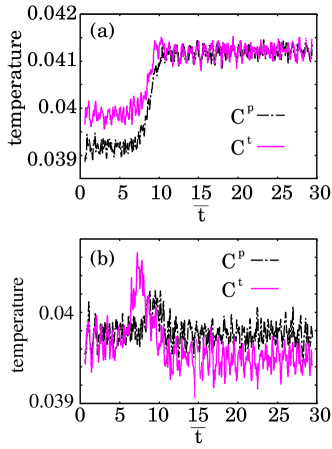
Here we show the time evolution of kinetic temperature defined by Eq.(5). Figure 4 shows typical examples of the changes in temperature in an ordinary rebound and a super rebound. is the scaled time, . A slight discrepancy in temperature between Cp and Ct is observed after the equilibration in Fig. 4 (a). The temperature increases after the collision around for an ordinary rebound (see Fig. 4(a)), where a part of the translational energy is converted to the internal energy. On the other hand, the temperature decreases in Ct while the temperature of Cp increases after the collision for a super rebound (Fig. 4(b)).
Next let us investigate the entropy change defined by Eq. (16) in Appendix A. Figure 5(a) plots the time evolution of for Cp and Ct in a super rebound, which shows that the entropy increases in Ct while it decreases in Cp during collision for . On the other hand, Figure 5(b) shows that the discrepancy of entropy change remains finite after the collision for . In addition, it is remarkable that the entropy of Ct decreases corresponding to the decrease of temperature.
So far, we have reported the results of our simulation on thermodynamic quantities. What we confirm is that the behavior of such quantities in super rebounds is seemingly in contrast to what is expected from the second law of thermodynamics. However, we should note that the second law is only strictly valid after ensemble average is taken over. In this sense, our result does not violate the second law of thermodynamics.

III.3 Structural Change during Collision
Let us investigate the structural change of the clusters induced by collisions. To characterize the structural change, we first introduce a local bond order parameter known as time-averaged Steinhart’s bond order parameter (see Eq.(19) for its explicit definition). steinhardt ; lechner ; wolde We note that Steinhardt’s bond order parameters are used to characterize the structural change in nanoclusters associated with collisionsjung and meltingsuka ; wang as well as equilibrium structures of crystalline solids. According to the definition of the bond order parameter summarized in Appendix B, we calculate and of each atom before and after collisions, respectively. For the time average in calculation of and , we use and for before and after collisions, respectively, with the time interval , where and respectively correspond to in Eq. (19).
On - plane, the highest peak can be found around which is characteristic for FCC crystal structure. We cannot find visible shift of the peak position on - plane during the collision in both super and ordinary rebounds. However, we find that the number of “atoms” at the highest peak decreases after the collision for ordinary rebounds, which means that the number of “atoms” in FCC bond order decreases after the collision (see Table 1). On the contrary, for super rebounds, the number of “atoms” at the highest peak increases after the collision, which means that the FCC bond order becomes intensive after the collision. Thus, the super rebounds are characterized by the increase of the number of “atoms” with FCC bond order during collisions.
| numbers of FCC “atoms” | |||
|---|---|---|---|
| before collision | |||
| after collision |
| numbers of FCC “atoms” | |||
|---|---|---|---|
| before collision | |||
| after collision |
To investigate the details of the structural change, we also calculate the distribution of defined by Eq. (B1). To construct these distributions, we use the particle data at the final instant of the initial thermalization by the velocity scaling method. Because is equal to , we only investigate the case of .
We present the histogram of in Fig. 6. The solid curve represents the frequency distribution for ordinary rebounds while the broken curve is that for super rebounds. One can find the slight discrepancy between those two distributions. We should mention that the discrepancy is invisible for the other , though we do not present the corresponding figures.

To quantify the discrepancy between those two distributions, we introduce defined by
| (7) |
where and are the frequencies of in the -th bin for ordinary and super rebounds, respectively. We calculate for each value of to investigate the relationship between and . Figure 7 shows the relationship between and , which characterizes the difference between super rebounds and ordinary rebounds. This figure shows that the discrepancy between the distributions of is remarkably large compared to other values of . In addition, we show the relationship between introduced in Eq.(7) and in Fig. 8, where a remarkable difference can be found in the range of .


IV Discussion
Let us discuss our results. In the previous section, we have demonstrated that the structural difference of clusters can be found between the super and the ordinary rebounds. Here we investigate the potential energy of the characteristic local structures included in the clusters which induce the super rebounds.
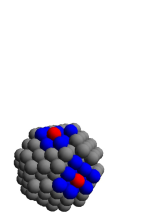
Focusing on the noticeable peaks in Fig. 8, we select the “atoms” with the order in the range, , from clusters which induce the super rebounds. The reason why we choose the range of is as follows. The characteristic peaks in Fig. 8 are characterized by , so that we pick up “atoms” in the above range. For each of the selected “atoms”, we define the neighboring “atoms” which are located within the distance of . We define a local structure by the collection of the selected atom and its neighboring “atoms”. Figure 9 is a snapshot of a cluster including two local structures, each of which is centered by the atom which has the order (red or medium grey). This figure shows that the local structures are located on the surface of the cluster. Moreover, the local structures seem to be unstable due to the less-ordered orientation of “atoms”, which may lead to the high potential energy.
Next, we calculate the averaged potential energy of those local structures. For the purpose, we calculate the potential energy of each atom in the cluster with the cutoff and sum up the potential energy over all the “atoms” in a local structure to obtain its potential energy. Among clusters which induce super rebounds, we find “atoms” to satisfy , by which we calculate the averaged potential energy of one local structure. From our calculation, the averaged potential energy per one local structure becomes .
For comparison, we focus on the potential energy of the local structure which belongs to the highest peak in Fig. 6 because we find same number of the local structures both in super rebounds and in ordinary rebounds. The local structure in this case is defined by the collection of the “atoms” with the order around the peak, , and its neighboring “atoms” in the clusters which induce the super and the ordinary rebounds. From the calculation with local structures in the clusters which induces super rebounds, we obtain the averaged potential energy per one local structure as . In the case of the clusters which induce ordinary rebounds, the averaged potential energy becomes from the calculation of local structures.
From these results, the clusters for the super rebound has more metastable local structures with high potential energy rather than the clusters for the ordinary rebound. Thus, we conjecture that a part of the high potential energy is transferred to the macroscopic degrees of freedom during the super-rebound collision. Moreover, we can also conjecture that the decreases of temperature and entropy after collision are connected with the decrease of the potential energy. In this paper, we focus on the relationship between the local structure and the super rebound. It is also important to understand the role of macroscopic structural change. The macroscopic deformation of nanoclusters after the collision will be reported elsewhere.murakami
V Conclusion
In this paper, we have performed the molecular dynamics simulation of colliding nanoclusters to study the origin of super rebounds. Through the investigation of the thermodynamic properties, we have found that the decreases of the temperature and the entropy are observed in one of the binary clusters when the super rebound is observed. This may be attributed to the biased distribution of the local bond order parameters after the collision which is caused by the initial metastable configuration of “atoms”.
Through the investigation of the local bond order parameters, we have found the discrepancy of the distributions of the order between the super and the ordinary rebounds. The averaged potential energy of the local structure which belongs to the characteristic peak in the distribution is larger than the typical local structures which are abundant in our cluster. Thus, the energy transfer from the local structure to the macroscopic degree of freedom accompanied by the structural change during collision play an important role in super rebounds. Moreover, the change of entropy associated with the change in the internal state of order after the collision is the key point for understanding the emergence of the super rebounds. Further investigation of the relationship between the local structural change and the entropy decrease will be one of our future tasks.
Acknowledgements.
We would like to thank N. V. Brilliantov, T. Kawasaki, S. Takesue, R. Murakami, and K. Saitoh for their valuable comments. Also, HK would like to thank Y. Wang and W. Lechner who gave him many advises for calculation of order parameters and how to use their calculation codes. Parts of numerical computation in this work were carried out at Yukawa Institute Computer Facility. This work was supported by the Grant-in-Aid for the Global COE Program “The Next Generation of Physics, Spun from Universality and Emergence” from the Ministry of Education, Culture, Sports, Science and Technology (MEXT) of Japan.Appendix A Calculation of entropy
In this appendix, we explain the method to calculate the entropy in our system. Let us assume that the collision of Cp onto Ct does the work and changes the internal energy of Ct. Because each cluster is an isolated system, we assume that the change in heat of Ct is determined by the first law of thermodynamics,
| (8) |
where is the change in the internal energy.
The internal energy is calculated as
| (9) |
where , are the relative momentum of an atom in Ct against the center of mass and the mass of an atom, respectively. is the potential energy between the “atoms” and in Ct.

The amount of work acting on Ct is defined as follows. Let us define the work done by the atom of Cp to the atom of Ct (Fig. 10). Assuming that the displacements of the “atoms” are caused by the interactive force , the amount of work done by the atom to the atom during an interval may be written as
| (10) |
where . Thus, the work done by Cp to Ct may be expressed as
| (11) |
Using these quantities, we define the entropy difference as
| (12) |
Here we use the kinetic temperature Eq.(5) as . To calculate by Eq.(12), we first smooth the temperature and the heat as
| (13) | |||||
| (14) |
with because those data change rapidly against time. By using those smoothed parameters, the entropy change of Ct may be rewritten as
| (16) |
where we adopt the simple trapezoidal rule for the evaluation of the integral.
Appendix B Calculation of order parameter
In this appendix, we introduce Steinhardt’s order parameter to characterize the structure of our model steinhardt ; lechner ; wolde . Let us assume that an atom in a crystalline structure is surrounded by “atoms” within the cutoff length . That is, the distance between the -th atom and one of the neighboring “atoms” is less than the cutoff length . In our analysis, we adopt .
First, for each atom, we calculate the average of spherical harmonics which depends on as follows:
| (17) |
Next, we introduce according to the following definition:
| (18) |
Instead of , we use the time-averaged value defined by
| (19) |
with the time interval .
Each crystalline structure, such as a body-centered cubic (bcc) and a face-centered cubic (fcc), has a characteristic distributions of those parameters. For example, the distributions of and in a fcc structure shows two peaks while the distributions in other structure has a single peak in a Lennard-Jones system.lechner The mean values of those distributions are summarized in Table 3.wolde
| fcc | ||
|---|---|---|
| bcc | ||
| hcp |
References
- (1) T. L. Hill, Thermodynamics of Small Systems, Part I and II (Benjamin, Amsterdam, 1964).
- (2) F. Baletto and R. Ferrando, Rev. Mod. Phys. 77, 371 (2005).
- (3) A. I. Ayesh, S. A. Brown, A. Awasthi, S. C. Hendy, P. Y. Convers, and K. Nichol, Phys. Rev. B 81, 195422 (2010).
- (4) A. Awasthi, S. C. Hendy, and S. A. Brown, Math. Mech. Sol.15, 771 (2010).
- (5) L. B. Han, Q. An, S. N. Luo, and W. A. Goddard III, Material Lett. 64, 2230 (2010).
- (6) H. Kuninaka and H. Hayakawa, Phys. Rev. E 79, 031309 (2009)
- (7) K. Saitoh and H. Hayakawa, Prog. Theor. Phys., 122, 1081 (Kyoto Univ. 2009), and references therein.
- (8) M. Suri and T. Dumitricǎ, Phys. Rev. B. 78, 081405R (2008).
- (9) S. J. Antony, R. Moreno-Atanasio, J. Musadaidzwa, and R. A. Williams, J. Nanomaterials., no. 125386, 1 (2008).
- (10) A. Awasthi, S. C. Hendy, P. Zoontjens, S. A. Brown, and F. Natali, Phys. Rev. B, 76, 115437 (2007).
- (11) M. Kalweit and D. Drikakis, Phys. Rev. B, 74, 235415 (2006) and references therein.
- (12) M. Kalweit and D. Drikakis, J. Compt. Theor. Nanoscience 1, 367 (2004).
- (13) A. Tomsic, H. Schröder, K. L. Kompa K. L., and C. R. Gebhardt, J. Chem. Phys. 119, 6314 (2003).
- (14) Y. Yamaguchi and J. Gspann, Phys. Rev. B, 66, 155408 (2002).
- (15) W. Harbich, Metal Clusters at Surfaces, ed. by Karl-Heintz, Meiwes-Broer, p.p.107 (Springer, Berlin, 2000).
- (16) P. Valentini and T. Dumitricǎ, Phys. Rev. B, 75, 224106 (2007).
- (17) O. Knospe and R. Schmidt, Theory of atomic and molecular clusters, ed. by J. Jellinek, 111 (Springer, Berlin, 1999).
- (18) L. Ming, N. Markovic, M. Svanberg, and J. B. C. Pettersson: J. Phys. Chem. A 101, 4011 (1997).
- (19) N. V. Brilliantov, N. Albers, F. Spahn, and T. Pöschel, Phys. Rev. E 76, 051302 (2007).
- (20) S. Kim, Phys. Rev. E 83, 041302 (2011).
- (21) P. Kosinski and A. C. Hoffmann, Phys. Rev. E 84, 031303 (2011).
- (22) Y. Sakiyama, S. Takagi, and Y. Matsumoto, Phys. Fluids, 16, 1620 (2004).
- (23) T. Hawa and M. R. Zachariah, Phys. Rev. B. 71, 165434 (2005).
- (24) K. Saitoh, A. Bodrova, H. Hayakawa and N. V. Brilliantov, Phys. Rev. Lett. 105, 238001 (2010).
- (25) K. Saitoh and Y. Yonekawa, J. Adv. Mech. Des. Sys. Man., 4, 405 (2010).
- (26) M. Y. Louge and M. E. Adams, Phys. Rev. E 65, 021303 (2002).
- (27) H. Kuninaka and H. Hayakawa, Phys. Rev. Lett. 93, 154301 (2004).
- (28) C. Shen et al., Nature Physics advance online publication, 7 OCTOBER 2012 (DOI: 10.1038/NPHYS2440).
- (29) P. J. Steinhardt, D. R. Nelson, and M. Ronchetti, Phys. Rev. B 28, 784 (1983).
- (30) L. V. Woodcock, Chem. Phys. Lett. 10, 257 (1971).
- (31) S. Nosé, Prog. Theor. Phys. Suppl. 103, 1 (1991).
- (32) J. S. van Duijneveldt and D. Frenkel: J. Chem. Phys. 96, 4655 (1992).
- (33) W. Lechner and C. Dellago, J. Chem. Phys. 129, 114707 (2008).
- (34) S. -C. Jung, D. Suh, and W. -S. Yoon, J. Aero. Sci. 41, 745 (2010).
- (35) S. K. R. S. Sankaranarayanan, V. R. Bhethanabotla, and B. Joseph, Phys. Rev. B 71, 195415 (2005).
- (36) Y. Wang, S. Teitel, and C. Dellago, J. Chem. Phys. 122, 214722 (2005).
- (37) R. Murakami and H. Hayakawa, to be published.