eurm10 \checkfontmsam10
Stabilizing effect of flexibility in the wake of a flapping foil
Abstract
The wake of a flexible foil undergoing pitching oscillations in a low-speed hydrodynamic tunnel is used to examine the effect of chord-wise foil flexibility in the dynamical features of flapping-based propulsion. We compare the regime transitions in the wake with respect to the case of a rigid foil and show that foil flexibility inhibits the symmetry breaking of the reverse Bénard-von Kármán wake reported in the literature. A momentum balance calculation shows the average thrust to be up to three times greater for the flexible foil than for the rigid foil. We explain both of these observations by analyzing the vortex dynamics in the very near wake.
1 Introduction
In nature, wings and fins are compliant structures (see e.g. Daniel & Combes, 2002, and references therein). During locomotion, these flapping appendages endure deformation, actively or passively, which has an important role in the propulsive and maneuvering capabilities of swimming Fish (1999) and flying animals Wootton (1992). A vast amount of work studying the effect of wing compliance in flapping wing systems has been reported in the literature (see Shyy et al., 2010, for a review), and it is clear that the redistribution of aerodynamic forces resulting from wing deformation can have a dramatic effect in performance. Chordwise flexibility in particular has been shown to increase the propulsive efficiency in various configurations of flapping-based propulsion (see e.g. Katz & Weihs, 1978; Heathcote & Gursul, 2007a; Thiria & Godoy-Diana, 2010), and a few fluid physics mechanisms behind the beneficial effects of passive compliance for propulsive performance have been identified Eldredge & Pisani (2008); Spagnolie et al. (2010); Ramananarivo et al. (2011). In this paper we show that, aside from its well-documented effect on the thrust force, chordwise flexibility plays an important role in the stability of the propulsive wake. It has been shown in the literature that the mean propulsive jet produced by flapping motion can sometimes lose its symmetry giving rise to a deflected jet Jones et al. (1998); Lewin & Haj-Hariri (2003); Heathcote & Gursul (2007b); Godoy-Diana et al. (2008, 2009); von Ellenrieder & Pothos (2008); Buchholz & Smits (2008); Cleaver et al. (2010); Yu et al. (2012). The mechanism of deflection is triggered by the wake vortices being shed as dipolar structures, instead of as the regular array of counter-rotating vortices of the reverse Bénard-von Kármán pattern characteristic of propulsive wakes produced by flapping motion. For the case of a rigid teardrop-shaped foil undergoing pitching oscillations, the phase space for the transition between different regimes has been well established in previous work Godoy-Diana et al. (2008, 2009); Marais (2011). We examine here the effect of introducing flexibility to the problem, performing a detailed comparison of the vortex dynamics in the near wake of the flapping foil for two cases: the rigid foil (our benchmark case), and a flexible foil with the same shape but made of a compliant material. In addition to quantifying the increase in the thrust force observed when using a flexible foil, we demonstrate that flexibility inhibits the symmetry breaking of the propulsive wake.
2 Experimental setup and parameters
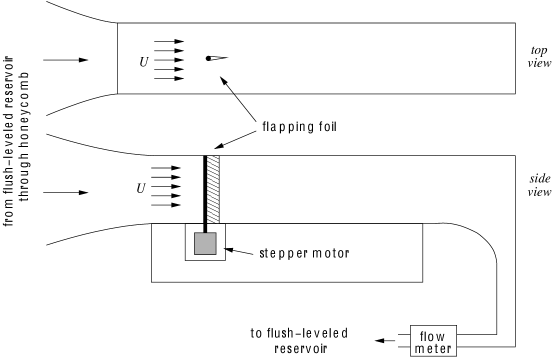
The experimental set-up closely resembles the one described in Godoy-Diana et al. (2008) and consists of a pitching foil of span-to-chord aspect ratio of 4:1 placed in a hydrodynamic tunnel (see figure 1). The motion of the foil is driven by a stepper motor and has been set to a triangular wave of varying frequencies and amplitudes. The control parameters on the experiment are the flow velocity in the tunnel and the foil oscillation frequency and pitching angle . The latter determines a peak-to-peak amplitude of oscillation of the trailing edge that we define as in the case of the rigid foil. As will be discussed below, the actual displacement of the trailing edge equals for the rigid foil but varies depending on the frequency for the flexible foil. We define the following non-dimensional parameters: the Reynolds number based on the foil chord , where is the kinematic viscosity, fixed to in the present experiments. The dimensionless effective flapping amplitude , and a Strouhal number , both defined using the foil width as characteristic length scale. It has been shown recently Godoy-Diana et al. (2008) that this three-parameter description is needed to allow for a proper characterization of the transitions in the wake of a flapping foil. The amplitude-based Strouhal number that is usually found in the literature was in the range in the present experiments.
Time-resolved measurements were performed using two-dimensional particle image velocimetry (PIV) on a plane probing the flow around the foil at mid-span. A continuous wave laser (DPSS 2W@532nm) and a cylindrical lens were used to produced a light sheet of 1mm width in the whole imaging region ( to and in the and directions, respectively). Each recording consisted of 2100 images sampled at 500 Hz using a Phantom V9.1 camera with 16001200 pixels resolution. The flow was seeded with 20m polyamide particles. The PIV computation and post-processing were done using a LaVision system as well as Matlab and the PIVMat Toolbox Moisy (2007). The PIV calculation was performed with 1616 pixel interrogation windows with 50% overlap, giving a resolution of one vector every 0.7mm.
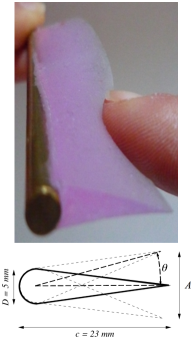
We investigate two cases, using foils with the same geometry and dimensions (indicated in figure 1), but differing in their structural material. The first one, already used in previous studies, is made of acrylic glass and will be referred to as the rigid foil in the following. The second one, the flexible foil shown in figure 1, is made of a silicone elastomer material (vinyl polysiloxane), crosslinked with a curing agent to obtain a Young’s modulus of .
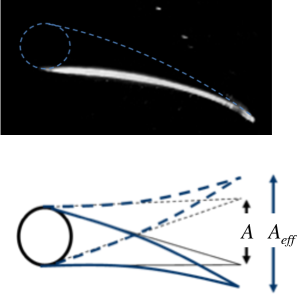
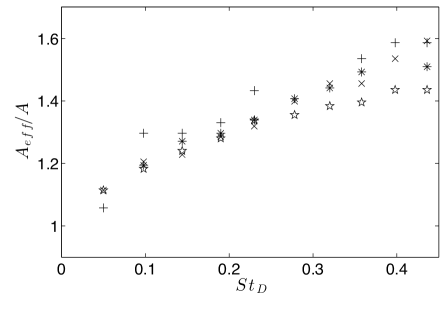
The deformation experienced by the flexible foil while flapping can be characterized using the actual amplitude (peak to peak amplitude measured at the trailing edge of the foil), which is larger than the amplitude that would be observed with a rigid foil for a given angular oscillation. The ratio thus increases with the flapping frequency for a given value of the imposed rigid amplitude (see figure 2, where a schematic diagram of this effect is also shown). The latter observation holds for the regime considered in the present study, however one could likely find other regimes where . This is related to the problem of an optimal flexibility (see e.g. Michelin & Llewellyn Smith, 2009) as a function of the forcing frequency which, although beyond the scope of the present work, remains to be explored experimentally.
3 Transitions in the wake
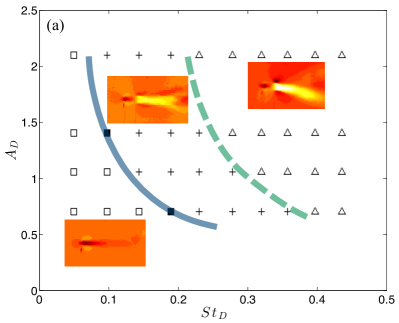
A description using the frequency and amplitude of the oscillatory motion as independent parameters has been shown recently to be the optimum framework to fully characterize the quasi-two-dimensional (Q2D) regimes observed in the wake of a pitching foil Godoy-Diana et al. (2008); Schnipper et al. (2009). The phase diagram indicating the regime transitions for the rigid foil in a map is recalled in Fig. 3(a), where a typical snapshot of the mean horizontal velocity field is shown for each region of the phase space (snapshots of a typical vorticity field for each case are shown below in Fig. 3c-f). The solid line marks the transition between a Bénard-von Kármán type (BvK) wake (where the mean flow presents a velocity deficit behind the foil) and the reverse BvK wake characteristic of propulsive regimes (where the mean flow is a jet). The broken line locates the symmetry breaking of the reverse BvK street that occurs when two successive vortices are shed too close to each other, the closeness being determined by a ratio of the flapping and advective timescales (see Godoy-Diana et al., 2009).
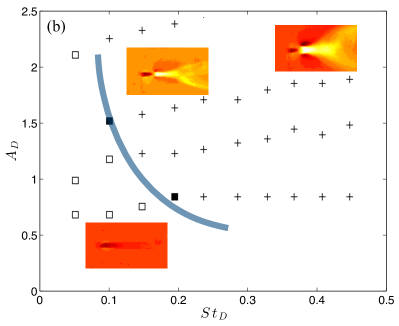

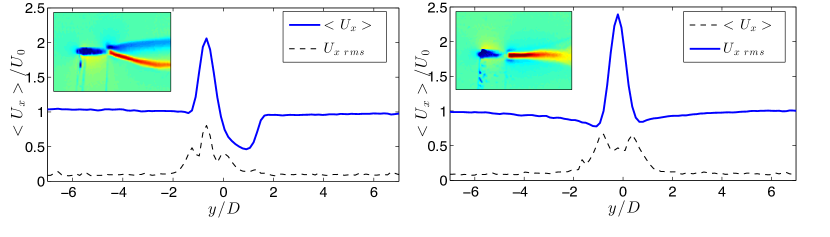
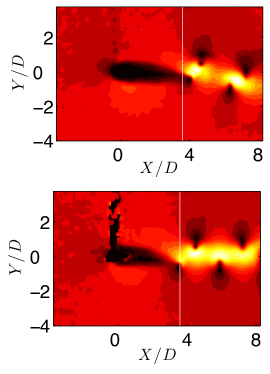
The effect of adding flexibility to the flapping foil modifies the structure of the flow in the wake and thus the transition map (see Fig. 3b). While there is no observable effect in the transition between the BvK and reverse BvK regimes (i.e. the solid line does not move appreciably between Figs. 3a and 3b), the symmetry breaking of the BvK street is inhibited for the flexible foil in the range of parameters explored. The propulsive jet that is deflected for the rigid foil (in the top-right region of the parameter space in Fig. 3a) stays symmetric in the case of the flexible foil. This can be observed in more detail in the comparison of the mean horizontal velocity profiles for a specific point of the parameter space shown in Fig. 4.
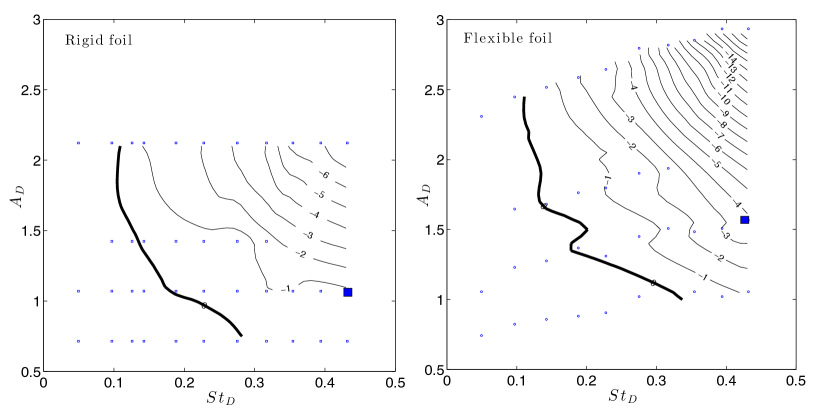
A standard momentum balance using the mean velocity field permits to estimate the average thrust force (see Godoy-Diana et al., 2008). Fig. 4 shows the mean drag coefficient surfaces in the map for the two foils111As mentioned in Godoy-Diana et al. (2008), the drag-thrust transition (the solid contour where ) happens after the transition from BvK to reverse BvK regime. This observation has been confirmed by Bohl & Koochesfahani (2009) who used an alternative control volume analysis that takes into account the streamwise velocity fluctuations and the pressure term.. We recall that for a given angular amplitude of the pitching motion, at equal flapping frequency the effective amplitude has been observed in the present experiments to be larger for the flexible foil than for the rigid one. Now if we compare two points in the parameter space at equal effective amplitudes (i.e. equal ), the calculated forces for the flexible and the rigid foils are indeed similar (see contours in Fig. 4). Seeking to characterize the effect of flexibility however, one should consider the pitching motion as the input and the passive deformation of the foil as an effect, which would mean comparing points of equal angular amplitude (e.g. the square marker in Fig. 4) where the propulsive force is significantly larger for the flexible foil. Comparing forces between the rigid and the flexible foils at equal values of angular pitching amplitude, we can see that the thrust force for the flexible foil can be up to three times larger than the values obtained with the rigid foil, a feature that seems to be mainly determined by the increase in effective flapping amplitude resulting from the foil deformation.
The present experiments have thus evidenced that foil flexibility has an effect on both the thrust force produced by the foil and the symmetry properties of the wake. In what follows we attempt to gain a better understanding of the mechanisms responsible for these observations focusing on the formation of vortices in the case of the reverse BvK wake, where the vorticity generated at the leading edge and along the boundary layer on each side of the flap merges with the tip vortex at the trailing edge and is shed as a single structure each half period of oscillation. The interest in the early stages of the vortex formation process is two-fold: on the one hand, because vortices are formed in the vicinity of the oscillating foil, it is during these first stages that their influence or footprint on the production of hydrodynamic forces will be greatest. Second, it has been shown that the symmetry properties of the wake are driven by the dynamics of the very near wake, where the formation of dipolar structures is the mechanism that triggers the symmetry breaking of the reverse BvK vortex street.
4 Vortex dynamics
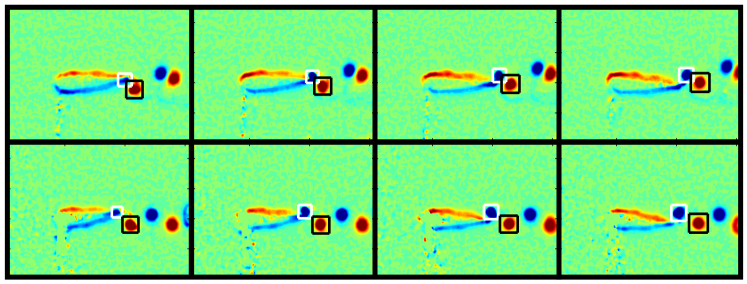
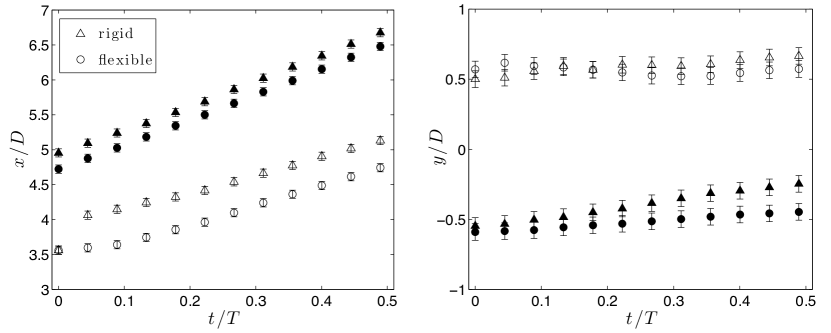
For each experimental configuration, we start tracking the vortex closest to the trailing edge at the moment of reversal in the direction of the flapping motion, which corresponds to the birth of the new vortex. The vortex is characterized in terms of its circulation and streamwise and transverse position in the wake as in Godoy-Diana et al. (2009). In figure 5, a time series of vorticity fields is shown for each type of foil, rigid and flexible, for the same control parameters: frequency (=0.3) and pitching angle (). The two vortices closest to the flap (counter-rotating, enclosed by squares in Fig. 5) are tracked, giving the time series of position shown in Fig. 6. We will refer to the vortex closest to the flap (negative vorticity) as vortex I and the one shed previously (positive vorticity) as vortex II. The first point concerns the time evolution of the streamwise position of the vortices: we observed systematically that in the case of the flexible foil, vortices are shed closer to the origin (the rotation axis of the foil) in the direction than in the case of the rigid foil (this can be seen in the the track of vortex I in Fig. 6). The difference between the two foils is less marked in the track of vortex II. The tracks of the position (Fig. 6) show the wake deflection observed for the rigid foil in this case, while in the case of the flexible foil the vortices are shed symmetrically.
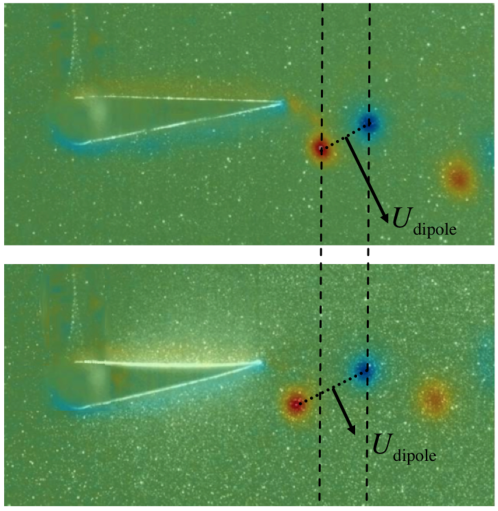
The difference between the position of vortex I in the rigid and flexible cases can be understood considering the deformation experienced by the flexible foil during the vortex formation process: when the flap changes the direction of motion, because of the foil deformation the tip position moves closer to the origin and so does the shed vortex. It follows from this observation that the two consecutive vortices of opposite sign shed at each flapping period, are closer in the rigid case than in the flexible case, as illustrated in Fig. 7. Recalling that the symmetry-breaking in the wake directly depends on the relative self-advection velocity of the first dipolar structure in the near wake of the foil Godoy-Diana et al. (2009), the fact that flexibility keeps the newly shed vortex (vortex I) from being shed close enough to vortex II to form a vortex pair can explain the observed inhibition of the deflected wake.
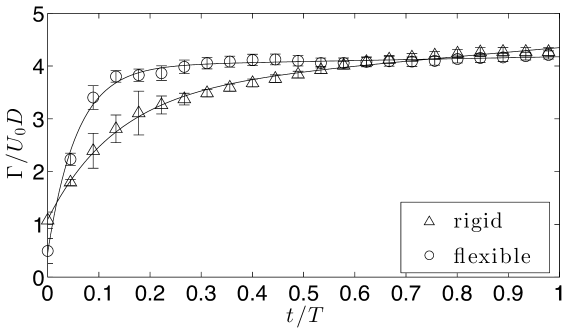
We study now the temporal evolution of the circulation during vortex formation. We define the time origin as the moment when the foil changes direction, which triggers the shedding of a vortex into the wake and marks the beginning of the growth process of a new vortex at the trailing edge of the foil. The circulation grows in time and rapidly tends toward a maximum value that remains relatively constant even after the next change in direction (which restarts the formation process for the next opposite-signed vortex). This evolution can be seen in Fig. 8. If we compare this circulation evolution for flexible and rigid foils, it appears clearly that the vortex in the wake of the flexible foil forms faster than in the case of the rigid foil.
The link between vortex formation time and the force experienced by the foil can be qualitatively understood using the simple approach proposed by Protas & Wesfreid (2003) for a 2D wake vortex street, starting from the impulse formula that associates the force with the time derivative of the vorticity impulse (see e.g. Saffman, 1992) , where the fluid density is set to unity, the flow domain extends to infinity, is the position vector, the vorticity, and are the two velocity components, and the unit vector perpendicular to the plane of motion. Considering a vortex street modeled by point vortices, the projection of the impulse formula along the axis, gives the following approximate expression for the drag force : , where denotes the -th vortex in the wake and its distance to the wake centerline. The hydrodynamic force is thus on the one hand intimately linked to the spatial arrangement of vortices in the wake, as well as to their sign and intensity. The other important point is that this unsteady contribution to the force coming from the vortices depends on the temporal evolution of the circulation. Considering the comparison between the rigid and flexible foils of the present experiments, the faster formation of each vortex in the case of the flexible foil is therefore consistent with the observed increase in the propulsive force.
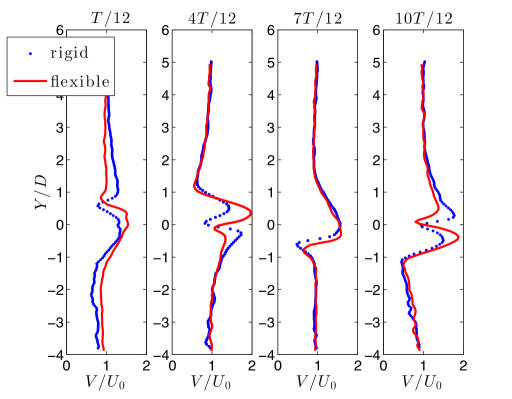
In order to shed some light on the physical mechanism that determines the faster formation of vortices in the wake of the flexible foil we examine the velocity field in the near wake. We compare in Fig. 9, the velocity profile at the trailing edge of the foil for both cases (along the white line represented on the absolute velocity fields in Fig. 9, left), at four different instants distributed over one foil oscillation period. The profiles for the rigid and flexible foils are similar, but a distinctive feature appears when the foil changes direction of oscillation ( and ): the velocity jet near the tip of the foil is clearly more intense in the case of the flexible foil. The faster growth of the vortex circulation observed in Fig. 8 can therefore be explained acknowledging that the flexible foil curvature enhances the flow around the trailing edge of the foil, locally accelerating the fluid that will feed the growing vortex.
We may also note that this is compatible with another point observed in the previous section: in the flexible case, once the newly formed vortex is released into the wake it accelerates and catches up its delay with respect to the case of the rigid foil, (see the position of vortex II for both cases in Fig. 6). This transient faster initial advection velocity of the vortices can be explained by the deformation dynamics of the flexible structure: in the manner of a spring, after reaching its maximum deformation the foil structure comes back to its initial shape, contributing to accelerating the fluid in the near wake.
5 Concluding remarks
We have shown that adding flexibility plays a strong dynamical role on the wake produced by a flapping foil. On the one hand, the effective amplitude obtained passively due to the deformation of the flexible foil while flapping (Fig. 2) leads to an increase in the propulsive force with respect to the case of the rigid foil (Fig. 4). On the other hand, the interaction of the shed vortices with the flexible structure inhibits the trigger of the symmetry breaking of the reverse Bénard-von Kármán wake (Fig. 3b), neutralizing thus the deflection of the propulsive jet that has been widely reported in the literature. The latter result, which is a novel observation, brings yet more evidence that wing compliance needs to be considered as a key parameter in the design of future flapping-propelled vehicles: since not only it is determinant for thrust and efficiency, but also as we show here because of its role in dictating the vortex dynamics that governs the stability properties of the wake.
Acknowledgements.
We thank gratefully D. Pradal and G. Clermont for their valuable help manufacturing the flexible foils and J. Bico for useful discussions. We acknowledge support from the French National Research Agency through project ANR-08-BLAN-0099.References
- Bohl & Koochesfahani (2009) Bohl, D. G. & Koochesfahani, M. M. 2009 MTV measurements of the vortical field in the wake of an airfoil oscillating at high reduced frequency. J. Fluid Mech. 620, 63–88.
- Buchholz & Smits (2008) Buchholz, J. H. J. & Smits, A. J. 2008 The wake structure and thrust performance of a rigid low-aspect-ratio pitching panel. J. Fluid Mech. 603, 331–365.
- Cleaver et al. (2010) Cleaver, D. J., Gursul, I. & Wang, Z. J. 2010 Vortex mode bifurcation and lift force of a plunging airfoil at low reynolds numbers. In 48th AIAA Aerospace Sciences Meeting, 7-10 January 2010, Orlando, Florida, p. AIAA Paper.
- Daniel & Combes (2002) Daniel, T. L. & Combes, S. A. 2002 Flexible Wings and Fins: Bending by Inertial or Fluid-Dynamic Forces? Integr. Comp. Biol. 42 (5), 1044–1049.
- Eldredge & Pisani (2008) Eldredge, J. D. & Pisani, D. 2008 Passive locomotion of a simple articulated fish-like system in the wake of an obstacle. J. Fluid Mech 607, 1–10.
- von Ellenrieder & Pothos (2008) von Ellenrieder, K. D. & Pothos, S. 2008 PIV measurements of the asymmetric wake of a two dimensional heaving hydrofoil. Exp. Fluids 44 (5), 733–745.
- Fish (1999) Fish, F.E 1999 Performance constraints on the maneuverability of flexible and rigid biological systems. In Proceedings of the Eleventh International Symposium on Unmanned Untethered Submersible Technology, pp. 394–406.
- Godoy-Diana et al. (2008) Godoy-Diana, R., Aider, J. L. & Wesfreid, J. E. 2008 Transitions in the wake of a flapping foil. Phys. Rev. E 77, 016308.
- Godoy-Diana et al. (2009) Godoy-Diana, R., Marais, C., Aider, J. L. & Wesfreid, J. E. 2009 A model for the symmetry breaking of the reverse Bénard-von Kármán vortex street produced by a flapping foil. J. Fluid Mech. 622, 23–32.
- Heathcote & Gursul (2007a) Heathcote, S. & Gursul, I. 2007a Flexible flapping airfoil propulsion at low reynolds numbers. AIAA journal 45 (5), 1066–1079.
- Heathcote & Gursul (2007b) Heathcote, S. & Gursul, I. 2007b Jet switching phenomenon for a periodically plunging airfoil. Phys. Fluids 19, 027104.
- Jones et al. (1998) Jones, K. D., Dohring, C. M. & Platzer, M. F. 1998 Experimental and computational investigation of the Knoller-Betz effect. AIAA J. 36 (7), 1240–1246.
- Katz & Weihs (1978) Katz, J. & Weihs, D. 1978 Hydrodynamic propulsion by large amplitude oscillation of an airfoil with chordwise flexibility. J. Fluid Mech. 88, 713–723.
- Lewin & Haj-Hariri (2003) Lewin, G. C. & Haj-Hariri, H. 2003 Modelling thrust generation of a two-dimensional heaving airfoil in a viscous flow. J. Fluid Mech. 492, 339–362.
- Marais (2011) Marais, C. 2011 Dynamique tourbillonnaire dans le sillage d’un aileron oscillant : Propulsion par ailes battantes biomimétiques. PhD thesis, Université Denis Diderot, Paris, France.
- Michelin & Llewellyn Smith (2009) Michelin, S. & Llewellyn Smith, S. G. 2009 Resonance and propulsion performance of a heaving flexible wing. Phys. Fluids 21 (7), 071902.
- Moisy (2007) Moisy, F. 2007 PIVMat: A PIV post-processing and data analysis toolbox for Matlab. Version 1.60 17-Apr-2007. http://www.fast.u-psud.fr/pivmat.
- Protas & Wesfreid (2003) Protas, B. & Wesfreid, J. E. 2003 On the relation between the global modes and the spectra of drag and lift in periodic wake flows. C. R. Mécanique 331, 49–54.
- Ramananarivo et al. (2011) Ramananarivo, S., Godoy-Diana, R. & Thiria, B. 2011 Rather than resonance, flapping wing flyers may play on aerodynamics to improve performance. Proceedings of the National Academy of Sciences (USA) 108 (15), 5964–5969.
- Saffman (1992) Saffman, P. G. 1992 Vortex Dynamics. Cambridge University Press.
- Schnipper et al. (2009) Schnipper, T., Andersen, A. & Bohr, T. 2009 Vortex wakes of a flapping foil. J. Fluid Mech. 633, 411–423.
- Shyy et al. (2010) Shyy, W., Aono, H., Chimakurthi, S.K., Trizila, P., Kang, C.-K., Cesnik, C.E.S. & Liu, H. 2010 Recent progress in flapping wing aerodynamics and aeroelasticity. Progr. Aerospace Sci. 46 (7), 284–327.
- Spagnolie et al. (2010) Spagnolie, S. E., Moret, L., Shelley, M. J. & Zhang, J. 2010 Surprising behaviors in flapping locomotion with passive pitching. Phys. Fluids 22 (4), 041903.
- Thiria & Godoy-Diana (2010) Thiria, B. & Godoy-Diana, R. 2010 How wing compliance drives the efficiency of self-propelled flapping flyers. Physical Review E 82, 015303(R).
- Wootton (1992) Wootton, R.J. 1992 Functional morphology of insect wings. Annu. Rev. Entomol. 37 (1), 113–140.
- Yu et al. (2012) Yu, M.L., Hu, H. & Wang, Z. J. 2012 Experimental and numerical investigations on the asymmetric wake vortex structures around an oscillating airfoil. In 50th AIAA Aerospace Sciences Meeting including the New Horizons Forum and Aerospace Exposition, 9-12 January 2012, Nashville, Tennessee, pp. AIAA Paper 2012–0299.