Pulse-driven nonlinear Alfvén waves and their role in the spectral line broadening
Abstract
We study the impulsively generated non-linear Alfvén waves in the solar atmosphere, and describe their most likely role in the observed non-thermal broadening of some spectral lines in solar coronal holes. We solve numerically the time-dependent magnetohydrodynamic equations to find temporal signatures of large-amplitude Alfvén waves in the model atmosphere of open and expanding magnetic field configuration, with a realistic temperature distribution. We calculate the temporally and spatially averaged, instantaneous transversal velocity of non-linear Alfvén waves at different heights of the model atmosphere, and estimate its contribution to the unresolved non-thermal motions caused by the waves. We find that the pulse-driven nonlinear Alfvén waves with the amplitude =50 km s-1 are the most likely candidates for the non-thermal broadening of Si VIII 1445.75 Å line profiles in the polar coronal hole as reported by Banerjee et al. (1998). We also demonstrate that the Alfvén waves driven by comparatively smaller velocity pulse with its amplitude =25 km s-1 may contribute to the spectral line width of the same line at various heights in coronal hole without any significant broadening. The main conclusion of this paper is that non-linear Alfvén waves excited impulsively in the lower solar atmosphere are responsible for the observed spectral line broadening in polar coronal holes. This is an important result as it allows us to conclude that such large amplitude and pulse-driven Alfvén waves do indeed exist in solar coronal holes. The existence of these waves and their undamped growth may impart the required momentum to accelerate the solar wind.
keywords:
Sun: atmosphere – (magnetohydrodynamics) MHD – waves.1 Introduction
Alfvén waves are difficult to observe and yet several indications of their presence in the solar atmosphere were found during SOHO and TRACE space missions. More direct evidence for the existence of these waves in different regions of the solar atmosphere was given by high-resolution observations carried out by the Solar Optical Telescope (SOT) and the X-Ray Telescope (XRT) onboard the Hinode Solar Observatory. According to Okamoto & De Pontieu (2011), De Pontieu et al. (2007), and Cirtain et al. (2007), the signature of Alfvén waves were observed respectively in spicules and X-ray jets using SOT and XRT instruments. Interpretations of these observational results were discussed by Erdélyi & Fedun (2007), Tomczyk et al. (2007), and Antolin et al. (2009).
Observational evidence for the existence of torsional Alfvén waves in the solar atmosphere was also reported by Jess et al. (2009), who analyzed H observations obtained with high spatial resolution by the Swedish Solar Telescope (SST). They interpreted the data in terms of Alfvén waves in the solar chromosphere, with periods from 12 min down to the sampling limit of the observations near 2 min, with maximum power near 6-7 min. The authors concluded that the amount of energy carried by such transversal waves was sufficient to heat the solar corona (Dwivedi & Srivastava 2006).
These recent discoveries of Alfvén waves in the solar atmosphere well-justified extensive studies of these waves that have been performed by numerous investigators in the last four decades (e.g., Hollweg 1985; Roberts 1991; Musielak & Moore 1995; Narain & Ulmschneider 1996; Roberts 2004; Antolin & Shibata 2010, and references cited there). The studies have covered both linear (e.g., Hollweg & Isenberg 2007; Murawski & Musielak 2010) and non-linear (e.g., Verdini & Velli 2007; Verdini et al. 2009; Matsumoto & Shibata 2010) Alfvén waves, and different aspects of their generation, propagation and dissipation have been investigated. The specific objectives of these studies were to understand the role of Alfvén waves in the atmospheric heating and in the acceleration of supersonic solar wind. The fast component of the solar wind originates in solar polar coronal holes (e.g., Hassler et al. 1999; Tu et al. 2005, and references cited there), which are the regions where the non-thermal broadening of spectral lines has also been observed (e.g., Hassler et al. 1990; Banerjee et al. 1998; Moran 2003; O’Shea et al., 2005; Dolla & Solomon 2008). Similar observations have also been done in the equatorial corona (Harrison et al., 2002). These authors proposed that the radially propagating Alfvén waves may result in the non-thermal broadening of spectral line widths.
These observations were also investigated analytically by Pekünlü et al. (2002) and Dwivedi & Srivastava (2006). Recently, the observations from Bemporad & Abbo have given the first signature of the dissipation of Alfvén waves neat the solar limb, which confirm the theoretical models of Dwivedi & Srivastava (2006), and Srivastava et al. (2007). Moreover, Zaqarashvili et al. (2006) have reported that the resonant energy conversion from Alfvén to acoustic waves in the region where plasma approaches unity in the solar atmosphere. This conversion can be responsible for the spectral line width variation. However, this theory only explains the most probable cause of the line-width reduction, which was observed only by O’Shea et al. (2005) in solar coronal hole. Additional problem is the fact that there is not enough observational evidence for the resonant energy conversion in the solar corona (e.g., Srivastava & Dwivedi 2010; McAteer et al. 2003). Hence, new studies of the role played by Alfvén waves in the observed spectral line broadening were necessary.
In this paper, we numerically study the behavior of large-amplitude (non-linear) Alfvén waves in a model that resembles a solar coronal hole. Our main objective is to determine the role played by these waves in the spectral line broadening as observed in the coronal holes (e.g., Banerjee et al. 1998; Dolla & Solomon 2008). We find an agreement between our numerical results of non-linear Alfvén waves and the computed line broadening of constituted synthetic spectra at different heights in model coronal hole and the observational data. This allows us to conclude that large-amplitude Alfvén waves are responsible for the observed non-thermal broadening of the spectral lines in the coronal holes. Our result is important because it is an indirect evidence for the existence of non-linear Alfvén waves in solar coronal holes.
The outline of the paper is as follows: our numerical model is described in Sec. 2; a brief description of the used numerical code and the form of initial perturbations are given in Sec. 3; the results of our numerical simulations are presented in Sec. 4; comparison of our results to the observational data is given in Sec. 5; the obtained results are discussed in Sec. 6; and our conclusions are given in Sec. 7.
2 Numerical model of Alfvén waves
2.1 MHD equations
Our model of the solar atmosphere contains a gravitationally-stratified magneto-plasma, which is described by the following set of ideal magnetohydrodynamic (MHD) equations:
| (1) | |||
| (2) | |||
| (3) | |||
| (4) | |||
| (5) | |||
| (6) |
Here is mass density, and are vectors of respectively the flow velocity and the magnetic field, is gas pressure, is the adiabatic index, is a vector of gravitational acceleration with its value m s-2, is a temperature, is a mean particle mass and is a Boltzmann’s constant.
2.2 A model of the solar atmosphere
We consider a model of the solar atmosphere with an invariant coordinate () and allow the -components of velocity () and magnetic field () to vary with and . In such 2.5D model, the solar atmosphere is in static equilibrium () with force- and current-free magnetic field, i.e.,
| (7) |
Henceforth the subscript e corresponds to equilibrium quantities.
In our model of the atmosphere, a curved magnetic field is given by
| (8) |
where the magnetic flux function () has the form
| (9) |
Here is a unit vector along the -direction and is the magnetic field at the reference level, , that is chosen at Mm. We set and hold fixed in such a way that the Alfvén speed, is ten times higher than the sound speed, . Such a choice of results in Eq. (7) being satisfied. Here denotes the magnetic scale-height, and is a half of the magnetic arcade width. As we aim to model a polar region, we take Mm and keep it fixed in our calculations. For such a choice, the magnetic field lines are weakly curved (not shown) and represent the open and expanding field lines similar to the coronal holes.
As a result of Eq. (7), the pressure gradient is balanced by the gravity force
| (10) |
Using the ideal gas law of Eq. (6) and the -component of the hydrostatic pressure balance indicated by Eq. (10), we express equilibrium gas pressure and mass density as
| (11) |
Here
| (12) |
is the pressure scale-height, and denotes the gas pressure at the reference level.
We adopt a realistic model of the plasma temperature profile (Vernazza et al. 1976), displayed in Fig. 1 , top panel. Temperature attains a value of about K at Mm and it grows up to about K in the solar corona at Mm. Higher up temperature is assumed constant; note that this profile is more realistic than the one used by Murawski & Musielak (2010). The temperature profile determines uniquely the equilibrium mass density and gas pressure profiles. Both and experience a sudden drop at the transition region that is located at Mm (not shown).


In this model the Alfvén speed, , varies only with and is expressed as follows:
| (13) |
Its profile is displayed in Fig. 1, bottom panel. Note that the Alfvén speed in the chromosphere, , is about km s-1. The Alfvén speed rises abruptly through the transition region reaching a value of km s-1 (Fig. 1, bottom). The growth of with height results from a faster decrement of than with the height.
The realistic solar atmosphere above the polar corona reveals complexity of its plasma and magnetic field structure. The magnetic field configuration in the polar coronal hole can be approximated by expanding coronal funnels in the lower part of the atmosphere and comparatively smooth open field lines in its upper part (Banerjee et al. 1998; Hack- enberg et al. 2000). This implies that the field structure and magnetic scale-height vary above the polar corona. Moreover, the field configuration changes from dipolar to multipolar during the transition from the solar minimum to its maximum. Despite these well-known variations, we assume that the magnetic field scale-height is fixed at a resonable value of Mm in our simulation domain, which represents the weakly curved and open field lines of the polar coronal hole for the quiet minimum phase of the Sun. We want to point out that this assumption does not affect the validity of our numerical results.
3 Numerical solutions of MHD equations
Equations (1)-(6) are solved numerically with a use of the FLASH code (Fryxell et al. 2000; Lee & Deane 2009; Lee et al. 2009). This code implements a second-order unsplit Godunov solver with various slope limiters and Riemann solvers as well as Adaptive Mesh Refinement (AMR) (MacNeice et al. 1999). We use the minmod slope limiter and the Roe Riemann solver (e.g., Toro 2009). We set the simulation box as and impose fixed in time boundary conditions for all plasma quantities in the - and -directions, while all plasma quantities remain invariant along the -direction. In our present work, we use AMR grid with a minimum (maximum) level of refinement set to (). The refinement strategy is based on controlling the numerical errors in mass density. Blocks are denser below Mm and vertically along the region of Alfvén wave propagation. Every numerical block consists of identical numerical cells. This results in an excellent resolution of vital spatial profiles and greatly reduces the numerical diffusion at these locations.
3.1 Initial perturbations
We perturb initially (at s) the model equilibrium, described in Sec. 2.2, by a Gaussian pulse in the -component of velocity given by
| (14) |
where is the amplitude of the pulse, is its initial position and denotes its width. We set , Mm and consider two cases: (a) km s-1; (b) km s-1.
Note that in the 2.5D model, we developed, the Alfvén wave decouples from magnetoacoustic waves and it can be described by . As a result, the initial pulse triggers Alfvén waves that in the linear limit are described by the wave equation
| (15) |
4 Results of numerical simulations
We simulate impulsively excited non-linear Alfvén waves and investigate their propagation along the open magnetic field lines of a coronal hole model in the outward direction. It should be noted that the effect of the inhomogeneities across the magnetic field lines are not included in our approach. The waves are generated by the transversal velocity pulse perpendicular to the magnetic isosurface (X-Y) in the -direction. This pulse is described by Eq. (14).
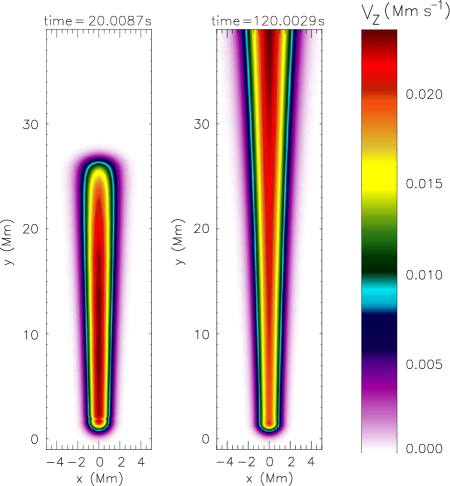


First, we consider the pulse amplitude equal to km s-1. Spatial profiles of for =25 km s-1 and the corresponding time signatures obtained in our numerical simulations of Alfvén waves are shown respectively in Figs. 2 and 3, top-right panel. Perturbations of propagate essentially along magnetic field lines, which is displayed on spatial profiles of at s and s (Fig. 2). A part of the whole simulation region is illustrated. Note that the Alfvén wave experiences an acceleration at that height as increases up to Mm s-1 at the transition region (Fig. 1, right). This acceleration of Alfvén wave is caused by significant fall in mass density at essentially constant magnetic field. Above, the Alfvén wave propagates with slightly increased amplitude and almost constant velocity. The spatial resolution of the transition region is set to be Mm in the simulation domain.
We also simulate the Alfvén wave using the large transversal pulse of km s-1 that generates the large-amplitude, non-linear Alfvén waves. Time-signatures of Vz for km s-1 collected at (, ) Mm are shown in right-bottom panel of Fig. 3. Since the wave is non-linear, it generates a vertical flow (Fig. 3, middle-bottom panel) and mass density perturbations (Fig. 3, left-bottom panel), which are driven by the ponderomotive force.
We collect the temporally and spatially averaged transversal velocity component Vz at each height of the simulation domain (ymax = 84 Mm) generated by the pulses of different wave amplitudes, = 25 and 50 km s-1 (see Fig. 3). If we assume that the -direction of the simulation box is placed along the outward open magnetic field of a polar coronal hole, then at each height the transversal amplitude of Alfvénic perturbations may contribute to the otherwise unresolved non-thermal motions by affecting the line-width of the observed spectral lines. Finite-amplitude Alfvén waves propagating along the open magnetic field lines of the polar coronal holes can perturb the plasma velocity, which causes positive and negative Doppler shifts that can be detected as a line width broadening or line width variation (Banerjee et al. 1998; Harrison et al. 2002; Moran 2003; O’Shea et al. 2005; Dwivedi & Srivastava 2008). We now compare our results of numerical simulations with the available observational data.
5 Comparison to observational data
5.1 Line width broadening
The non-thermal motion is a prominent candidate that may modify the observed line profiles by its contribution to the full width at half maximum (FWHM) of the spectral lines. Banerjee et al. (1998) have estimated the radial variation of the non-thermal velocity in the polar coronal hole by deducing its contribution to the observed line profiles of Si VIII 1445 Å . The sophisticated line-width measurements and thus the observed variation of non-thermal velocity are very few in the available literature. Using SOHO/CDS observations, O’Shea et al. (2005) have shown the line width increment in the inner corona and then its decrement beyond radial distance 1.21 Ro in coronal hole. Here Ro is the radius of the Sun. However, due to the unavailability of the instrumental width of SOHO/CDS slits, the exact informations about the non-thermal velocity could not be derived, so the estimate gave only the uncorrected line-width variation with the height. Moreover, Banerjee et al. (1998) have approximately re-produced the trend of the spatial variation of non-thermal velocity in the polar coronal hole similar to Banerjee et al. (1998) using 2 slit of Hinode/EIS. Note that the exact instrumental width of EIS slits were variables with wavelength of the observed spectral lines.
By using the temperature averaged over the simulation domain, the averaged density generated from the simulations, and the temporally and spatially averaged transversal speed (Vz) of Alfvén wave generated by the velocity pulse = 50 km s-1, we have estimated the equivalent FWHM () of its 1445.75 Å line at different heights using the relation (Mariska 1992)
| (16) |
It should be noted that the averaged wave velocity amplitude can be scaled appropriately in terms of non-thermal speed as by taking into consideration of polarization and direction of the propagation of wave w.r.t line-of-sight (Banerjee et al. 1998). We adopt the same scaling throughout the paper, although different authors use different scalings based on their assumption of the degree of freedom of wave motion (Dolla & Solomon 2008). At any particular height in the model coronal hole, we average the wave velocity amplitude of transversal oscillation in temporal domain between -250 to +250 s, while in the spatial domain over the entire pulse width, where is the arrival time of a wave signal to the detection point. Therefore, the resultant transversal motion contributes to the non-thermal unresolved motion at each height in the model coronal hole plasma as observed in form of spectral line broadening by various authors, e.g., Banerjee et al. (1998) and Dolla & Solomon (2008).
5.2 Line profiles obtained with 50 km s-1
We computed the synthetic line profiles (cf., Fig. 4) of Si VIII 1445.75 Å at three different heights 20, 40, and 70 Mm based on the inclusion of the non-thermal contribution of Alfvén wave excited by a pulse with its amplitude 50 km s-1. The CHIANTI atomic data base is used to produce the synthetic line profiles by computing the averaged density (), temperature (T), and FWHM estimated by averaged velocity (Vz). The CHIANTI SSW routine synthetic.pro is used to produce the line profiles; note that the routine takes into account the ionic equilibrium as reported by Mazzotta et al. (1998), the coronal hole differential emission measure (DEM) values, and coronal abundances as available in CHIANTI atomic data base. Although, the major input parameters are the averaged density () (or pressure), temperature (T), and FWHM (see Eq. 16) derived from the simulation, while other parameters mentioned above are considered as optional input parameters in the calculation of synthetic spectrum.
In the present case, we compare the deduced theoretical line width with the corrected observed one as reported by Banerjee et al. (1998) using SoHO/SUMER. Therefore, we neglected the implication of instrumental width of SoHO/SUMER slits in Eq. (16). We synthesized the line profiles of the Si VIII 1445.75 Å line but did not calculate the continuum as we wanted to only show the shape of the line profiles at various heights and their broadening that compares well with the observations of Banerjee et al. (1998). The line width of synthetic line profiles of Si VIII 1445.75 Å at 20 Mm, 40 Mm, and 70 Mm (Eq. 16) are respectively 353 mÅ , 358 mÅ , and 363 mÅ when we consider the non-thermal contribution of impulsively excited Alfvén wave by a pulse with its amplitude =50 km s-1. It is clear from Table 2 of Banerjee et al. (1998) that the estimated corrected line-widths of Si VIII 1445.75 Å at heights 27 arcsecs (19.6 Mm), 57 arcsecs ( 41.3 Mm), 98 arcsecs (71 Mm) are respectively 292 mÅ , 334Å , and 369 mÅ .
We also adopted and tested a different way of calculating the line-profiles at a particular height (e.g., 15 Mm) in the model coronal hole. Using the results of our numerical simulation, we derived the plasma parameters (, T) as well as the transversal speed Vz for each instant set (, =fixed, ) in which X-space is averaged over 1.0 Mm spatial scale. The time instant was considered with each 10 s resolution between -250 s to +250 s. We collected the parameters at each instant, and then derived the averaged FWHM, which was found to be 284 mÅ for a pulse =50 km s-1. The result closely matches the broadened line width of 291 mÅ as reported by Banerjee et al. (1998) at a height of 23 arcsec. Therefore, the alternative estimations are also consistent with our findings.
Although our theoretically estimated line-width also shows increment with height in our model coronal hole, the spatial gradient of increment is rather flat compared to the observations by Banerjee et al. (1998). The most likely reason is that we considered the impulsive excitation of the pulse-driven Alfvén wave that also contributes more to the un-resolved non-thermal motion near the wave source region in the lower solar atmosphere. Therefore, the computed line-width, ,for instance at 27 arcsecs (19.6 Mm), is higher than the observed line width given by Banerjee et al. (1998) at the same height. However, the theoretically estimated and the observed line-widths at coronal heights e.g., at 40 and 70 Mm, closely match each other.
The results presented in Fig. 4 clearly show that the synthetic line profiles computed with the wave amplitude 50 km s-1 closely approximately mimic the observed spectrum of Si VIII 1445.75 Å obtained by the detector-B on SOHO/SUMER and reported by Banerjee et al. (1998). This provides anevidence that the large-amplitude, pulse-excited Alfvén wave can contribute upto some extent into the broadening of the spectral lines observed by Banerjee et al. (1998).
5.3 Line profiles obtained with 25 km s-1
We again derived the synthetic line profiles (cf., Fig. 5) of Si VIII 1445.75 Å (Dolla & Solomon 2008) at three different heights 43.5, 65.25, and 72.5 Mm, based on the inclusion of the non-thermal contribution of Alfvén wave excited by the pulse with its amplitude km s-1. The CHIANTI atomic data base and the method described above was again used to produce the synthetic line profiles. The obtained results show that there is not very significant broadening of line profiles in our model coronal hole for these smaller amplitude Alfvén waves; for the observational data see Dolla & Solomon (2008).
The line widths of Si VIII 1445.75 Å synthetic line profiles at 43.5 Mm (60), 65.25 Mm (90), and 72.5 Mm (100) (Fig. 5) above the limb in our coronal hole model are estimated respectively as 289 mÅ 290 mÅ and 291 mÅ when we consider the non-thermal contribution of impulsively excited Alfvén wave by a pulse strength of =25 km s-1. Dolla & Solomon (2008) have reported the Gaussian half line-widths of various coronal spectral lines (e.g., Si VIII 1445.75 Å Fe XII 1242, Mg X 624 Å ) between 42 Mm (57) and 100 Mm (140) in the polar corona hole (cf., their Fig. 8). This shows that our theoretical estimations are below the observationally estimated line-width as reported by Dolla & Solomon (2008) for Si VIII 1445.75 Å between 40-75 Mm in coronal hole. For example, the estimated observed half line-widths at 1/ as reported by Dolla & Solomon (2008) (cf., their Fig 8), after conversion in FWHM of Si VIII 1445.75 Å at heights 43.5 Mm (60), 65.25 Mm (90), and 72.5 Mm (100), respectively give 362 mÅ 368Å , and 376 mÅ .
Our theoretically estimated line-width shows very small increment w.r.t. height in the coronal hole model between 40-75 Mm height. Now, the observed width of Si VIII 1445.75 Å also varies very little but with comparatively higher gradient than theoretical values. The most probable reason is that the plasma and magnetic field properties of the observed coronal hole differs from the assumed conditions in our model, in which the Alfvén wave of smaller amplitude propagates without much growth as well as its contribution in the line broadening.
Our numerical results obtained for non-linear Alfvén waves with the amplitude =25 km s-1 show that the resulting contribution of these waves to non-thermal motions approximately qualitatively match the observational data of spectral line width as observed by Dolla & Solomon (2008) for Si VIII 1445 Å line of SoHO/SUMER, as both show the lesser spectral line broadening. However, the theoretically estimated widths are comparatively smaller than the observed ones at various heights in coronal hole. Although, the theoretically derived line-widths only approximately match the observed ones at various heights in the coronal hole, there is no clear evidence of significant line broadening in these cases.


6 Discussion
As already mentioned in Sec. 1, there are several analytical models that attempted to explain the observed non-thermal broadening of spectral lines in the solar corona by using linear Alfvén waves (e.g., Harrison et al. 2002 ; Pekünlü et al. 2002; Dwivedi & Srivastava 2006). Under the linear theory of propagating Alfvén waves from the solar photosphere upward into the solar corona along the magnetic field lines, it is found that the non-thermal velocity is inversely proportional to the quadratic root of the observationally estimated electron density that matches well the characteristics of such waves (e.g., Banerjee et al. 1998; Moran et al. 2003; Baner- jee et al. 2009). The falls-off of the density with height can amplify the propagating Alfvén wave and increase its group velocity that can contribute in the rms wave amplitude and thus in the non-thermal spectral line-width broadening with height in the solar atmosphere.
The most relevant numerical work has been done by Kudoh & Shibata (1999) , who used numerical simulations to investigate the role of torsional Alfvén waves in both the formation of spicules as well as the observed non-thermal broadening of spectral lines in the solar corona. They considered Alfvén waves to be generated by perturbations of 1 km s-1 in the solar photosphere. According to these authors, the waves can lift the spicules up to 5000 km, provide the energy flux 3.0 105 ergs s-1 cm-2, and produce the non-thermal broadening of emission lines in the solar corona with approximately 20 km s-1.
It is clear from the above discussion that neither previous analytical methods nor previous numerical simulations have been able to explain the full profile of the observed spectral line-width variation with height in the polar coronal holes. Nevertheless, it is noteworthy here that previous observational results have been matched with linear propagating waves coming from photosphere (Banerjee et al. 1998, 2009). They have showed, in linear regime, that the rms wave amplitude is related with some powers of mass density and magnetic field variations. In this paper, we are not attempting this indirect analytical model explanations but instead we directly compute the temporally and spatially averaged transversal velocity component, , from our pulse-excited Alfvén wave model and determine its contribution to rms wave velocity amplitude. It should be noted then that the non-thermal velocity motion caused by such waves is inherent in the computed line-width variation of synthetic Si VIII 1445.75 Å line with height in the model coronal hole, and that it is consistent with the observations reported by Banerjee et al. (1998) . Hence, we conclude that the computed spectral line broadening with height in the coronal hole implies the increment of non-thermal velocity as provided by the Alfvén waves. The results of our numerical simulations of non-linear Alfvén waves show that the non-thermal spectral line width broadening in polar coronal holes can be explained by these waves.
In our pulse-excited model, the pulse of a large amplitude is launched above the solar photosphere and this pulse splits into the upward and backward propagating wave-trains in the overlying solar atmosphere. The upward moving pulse train causes the instantaneous displacement of the field lines in perpendicular plane away and towards the line-of-sight. This effect generates the transversal velocity and thus the Doppler shift as well as line broadening. Therefore, in our case of pulse-excited non-linear Alfvén wave model, the more stringent contribution of averaged transversal velocity Vz component at a particular height causes the non-thermal broadening of the spectral line there.
The theoretically estimated line-width of Si VIII 1445.75 Å synthetic line increased with height in the model coronal hole due to the pulse-excited, large amplitude Alfvén waves, which is consistent with the observations of the same phenomenon in the polar coronal hole (Banerjee et al. 1998). We have also generated synthetic line profiles of Si VIII 1445.75 Å line (Fig. 4) that match well the sample observations of Banerjee et al. (1998) showing the spectral line broadening. These measurements may also be the signature of the undamped and growing transversal pulse train that is the pulse-excited Alfvén wave. However, the region of our interest is below 80 Mm in the solar atmosphere, where the observations show the line-width increment consistent with the excitation of the undamped Alfvén waves. It should be noted that the region of decreasing line-width as reported by O’Shea et al. (2005) is quite high that was interpreted in terms of Alfvén wave dissipation. We do not consider such regime of observations in our model, which instead is focused on the Alfvénic dynamics in the lower solar atmosphere of the coronal hole that is also the source region of the fast solar wind.
It is well known that the fast solar wind starts accelerating near 20 Mm in the magnetic funnels in the polar coronal regions (Tu et al. 2005). Therefore, the undamped and growing pulse-excited, large amplitude Alfvén waves can provide the momentum to the solar wind plasma in the inner corona like the classical Alfvén waves, which are typically considered to be generated in the solar photosphere. On the other hand, the generation of large-amplitude Alfvénic pulses above the solar surface considered in this paper is still a puzzle. The reconnection events between the emerging magnetic fields with the existing open magnetic field lines may be one of the most plausible mechanisms that can trigger such strong transversal velocity pulses and thus drive Alfvén waves along the open field lines of the coronal hole. However, such waves and their physical properties may be highly dependent on the local magnetic field configuration of the reconnection region (Kigure et al. 2010).
Recently, Okamoto & De Pontieu (2011) have used the high-resolution observations obtained by the Hinode instruments and discovered the propagating Alfvén waves along solar spicules with a velocity amplitude of 7 km s-1. In addition, McIntosh et al. (2011) have found evidence for the outward-propagating Alfvénic motions with amplitudes of the order of 20 km s-1 and periods of the order of 100-500 s throughout the quiescent atmosphere, and concluded that these motions carry enough energy to accelerate the fast solar wind and heat the quiet corona. These discoveries of the Alfvénic motions imply that the carried wave energy may cascade through various layers of the solar atmosphere. The main aim of this paper is to understand the role of the pulse-excited Alfvén waves in the unresolved non-thermal motion in polar coronal hole and their role in the observed non-thermal spectral line broadening.
In summary, the recent observations clearly show Alfvénic disturbances with amplitudes smaller than km s-1 at spatial and temporal scales achieved by the simulations. This is a potentially limiting factor for the realism of the simulations.


The energy carried by Alfvén waves has been considered to be an important candidate for the heating of the coronal hole and the acceleration of the solar wind by many authors (e.g., Ofman & Davila 1995, 1998; Ofman 2005, and references cited there). The dissipation of the energy carried by these waves occurs either in the distant part of the corona (Parker 1991), or by some unique processes, such as phase-mixing, taking place in in the solar atmosphere (Heyvaerts & Priest 1983; Hood et al. 1997; Nakariakov et al. 1997). The large-amplitude non-linear Alfvén waves can also be dissipated by coupling to longitudinal wave motions in the outer part of the magnetized solar corona (e.g., Boynton & Torkelsson 1996). This shows that the solar atmosphere above the polar corona may be the ideal place for the growth of linear and non-linear Alfvén waves without much damping, and that the waves may carry their energy to the outer part of the corona and can heat the solar wind ions (e.g., Ofman & Davila 2001).
The main objective of the present study was to compute the averaged amplitude of the pulse-excited Alfvén waves at different atmospheric heights, and explore its effects on the broadening of the observed spectral lines. Our computational domain covered both the lower part of the solar atmosphere as well as the inner solar corona, and we did not take into account any dissipative processes in our numerical simulations because it was suggested that such processes may contribute to the observed narrowing of the line profiles (O’Shea et al. 2005). However, this work is out of the scope of this paper and will be considered as a future project.
7 Conclusions
In this paper, we simulated numerically the behavior of impulsively excited non-linear Alfvén waves in solar coronal holes, and studied for the first time their role in the observed broadening of spectral lines caused by these waves. We compared the obtained numerical results to the spectral line broadenings observed by Banerjee et al. (1998); Dolla & Solomon (2008). We found that the large-amplitude, non-linear, pulse-driven (=50 km s-1) Alfvén waves are the most likely candidates for the non-thermal broadening of Si VIII 1445.75 Å line profiles in the polar coronal hole (Banerjee et al. 1998). Our results also show that Alfvén waves driven by comparatively smaller velocity pulse, =25 km s-1, only approximately contribute to the observed spectral line width of Si VIII 1445 Å at various heights in coronal hole as reported by Dolla & Solomon (2008), however, without significant evidence of broadening. The results of our numerical simulation and their comparison to the observations of line broadening are important as they become an indirect evidence for the existence of larger amplitude, pulse-driven Alfvén waves in solar coronal holes.
Finally, we would like to suggest that more spectroscopic observations should be carried out in future using high-resolution observations (e.g., Hinode/EIS, and also with upcoming Solar-C instruments) to search for a direct evidence of such pulse-excited non-linear Alfvén waves in the solar atmosphere. Obviously, more detailed theoretical studies of a variety of pulse-driven non-linear Alfvén waves excited by a range of pulse amplitudes are also needed in order to better understand the role played by these waves in the observed line broadening and the solar wind acceleration.
Acknowledgments. The software used in this work was in part developed by the DOE-supported ASC/Alliance Center for Astrophysical Thermonuclear Flashes at the University of Chicago. This work has been supported by the Alexander von Humboldt Foundation (Z.E.M.) and by a Marie Curie International Research Staff Exchange Scheme Fellowship within the 7th European Community Framework Program (P.Ch. & K.M.) as well as by the ”HPC Infrastructure for Grand Challenges of Science and Engineering” Project, co-financed by the European Regional Development Fund under the Innovative Economy Operational Program (P.Ch. & K.M.). We also acknowledge the CHIANTI, which is a collaborative project involving researchers at NRL (USA) RAL (UK), and the Universities of Cambridge (UK), George Mason (USA), and Florence (Italy). A.K.S. thanks Shobhna Srivastava for patient encouragement, and also to Prof. D. Tripathi, IUCAA, Pune, India for valuable discussions on spectral line-profiles and their implications.
References
- Tomczyk et al. (2007) Tomczyk S., McIntoshS. W., Keil S. L., et al. 2007, Science, 317, 1192
- Antolin et al. (2009) Antolin P., Shibata K., Kudoh T., Shiota D., & Brooks D. 2009, The Second Hinode Science Meeting: Beyond Discovery-Toward Understanding, 415, 247
- Antolin & Shibata (2010) Antolin P., & Shibata K. 2010, ApJ, 712, 494
- Banerjee et al. (1998) Banerjee D., Teriaca L., Doyle J. G., & Wilhelm K. 1998, A&A, 339, 208
- Banerjee et al. (2009) Banerjee D., Pérez-Suárez D., & Doyle J. G. 2009, A&A, 501, L15
- Bemporad & Abbo (2012) Bemporad A., Abbo L., 2012, ApJ, 751, 110
- Boynton & Torkelsson (1996) Boynton G. C., & Torkelsson U. 1996, A&A, 308, 299
- Cirtain et al. (2007) Cirtain J. W., Golub L., Lundquist L., et al. 2007, Science, 318, 1580
- De Pontieu et al. (2007) De Pontieu B., Hansteen V. H., Rouppe van der Voort L., van Noort M., & Carlsson M., 2007, ApJ, 655, 624
- Dere et al. (1997) Dere K. P., Landi E., Mason H. E., Monsignori Fossi B. C., & Young, P. R. 1997, A&AS, 125, 149
- Dolla & Solomon (2008) Dolla L., & Solomon J. 2008, A&A, 483, 271
- Dwivedi & Srivastava (2006) Dwivedi B. N., & Srivastava A. K. 2006, Sol. Phys., 237, 143
- Dwivedi & Srivastava (2008) Dwivedi B. N., & Srivastava A. K. 2008, New A., 13, 581
- Erdélyi & Fedun (2007) Erdélyi R., & Fedun V. 2007, Science, 318, 1572
- Hackenberg et al. (2000) Hackenberg P., Marsch E., & Mann G. 2000, A&A, 360, 1139
- Harrison et al. (2002) Harrison R. A., Hood A. W., & Pike C. D. 2002, A&A, 392, 319
- Hassler et al. (1990) Hassler D. M., Rottman G. J., Shoub E. C., & Holzer T. E. 1990, ApJ, 348, L77
- Hassler et al. (1999) Hassler D. M., Dammasch I. E., Lemaire P., et al. 1999, Science, 283, 810
- Heyvaerts & Priest (1983) Heyvaerts J., & Priest E. R. 1983, A&A, 117, 220
- Hollweg (1985) Hollweg J. V. 1985, Chromospheric Diagnostics and Modelling, 235
- Hollweg & Isenberg (2007) Hollweg J. V., & Isenberg P. A. 2007, Journal of Geophysical Research (Space Physics), 112, 8102
- Hood et al. (1997) Hood A. W., Ireland J., & Priest E. R. 1997, A&A, 318, 957
- Jess et al. (2009) Jess D. B., Mathioudakis M., Erdélyi R., et al. 2009, Science, 323, 1582
- Kigure et al. (2010) Kigure H., Takahashi K., Shibata K., Yokoyama T., & Nozawa, S. 2010, PASJ, 62, 993
- Kudoh & Shibata (1999) Kudoh T., & Shibata K. 1999, ApJ, 514, 493
- Mariska (1992) Mariska J. T., 1992, str..book
- Matsumoto & Shibata (2010) Matsumoto T., & Shibata K. 2010, ApJ, 710, 1857
- Mazzotta et al. (1998) Mazzotta P., Mazzitelli G., Colafrancesco S., Vittorio N., 1998, A&AS, 133, 403
- McAteer et al. (2003) McAteer R. T. J., Gallagher P. T., Williams D. R., et al. 2003, ApJ, 587, 806
- McIntosh et al. (2011) McIntosh S. W., de Pontieu B., Carlsson M., et al. 2011, Nature, 475, 477
- Moran et al. (2003) Moran T. G. 2003, ApJ, 598, 657
- Murawski & Musielak (2010) Murawski K., & Musielak Z. E. 2010, A&A, 518, A37
- Musielak & Moore (1995) Musielak Z. E., & Moore R. L. 1995, ApJ, 452, 434
- Nakariakov et al. (1997) Nakariakov V. M., Roberts B., & Murawski K. 1997, Sol. Phys., 175, 93
- Narain & Ulmschneider (1996) Narain U., & Ulmschneider P. 1996, Space Sci. Rev., 75, 453
- Ofman & Davila (1995) Ofman L., & Davila J. M. 1995, J. Geophys. Res., 100, 23413
- Ofman & Davila (1998) Ofman L., & Davila J. M. 1998, J. Geophys. Res., 103, 23677
- Ofman & Davila (2001) Ofman L., & Davila J. M. 2001, ApJ, 553, 935
- Ofman (2005) Ofman L. 2005, Space Sci. Rev., 120, 67
- Okamoto & De Pontieu (2011) Okamoto T. J. & De Pontieu B. 2011, ApJ, 736, L24
- O’Shea et al. (2005) O’Shea E., Banerjee D., & Doyle J. G. 2005, A&A, 436, L35
- Parker (1991) Parker E. N. 1991, ApJ, 372, 719
- Pekünlü et al. (2002) Pekünlü E. R., Bozkurt Z., Afsar M., Soydugan E., & Soydugan F. 2002, MNRAS, 336, 1195
- Roberts (1991) Roberts B. 1991, Advances in Solar System Magnetohydrodynamics, 105
- Roberts (2004) Roberts B. 2004, SOHO 13 Waves, Oscillations and Small-Scale Transients Events in the Solar Atmosphere: Joint View from SOHO and TRACE, 547, 1
- Srivastava & Dwivedi (2007) Srivastava A. K., Dwivedi B. N., 2007, JApA, 28, 1
- Srivastava & Dwivedi (2010) Srivastava A. K., & Dwivedi B. N. 2010, MNRAS, 405, 2317
- Tu et al. (2005) Tu C.-Y., Zhou C., Marsch E., et al. 2005, Science, 308, 519
- Verdini & Velli (2007) Verdini A., & Velli M. 2007, ApJ, 662, 669
- Verdini et al. (2009) Verdini A., Velli M., & Buchlin E. 2009, ApJ, 700, L39
- Zaqarashvili et al. (2006) Zaqarashvili T. V., Oliver R., & Ballester J. L. 2006, A&A, 456, L13