CoFold: thermodynamic RNA structure prediction with a kinetic twist
Running head:
co-transcriptional RNA folding, RNA structure prediction, RNA secondary structures
Summary:
Existing state-of-the-art methods that take a single RNA sequence and predict the corresponding RNA secondary structure are thermodynamic methods. These predict the most stable RNA structure, but do not consider the process of structure formation. We have by now ample experimental and theoretical evidence, however, that sequences in vivo fold while being transcribed and that the process of structure formation matters. We here present a conceptually new method for predicting RNA secondary structure, called CoFold, that combines thermodynamic with kinetic considerations. Our method significantly improves the state-of-art in terms of prediction accuracy, especially for long sequences of more than a thousand nucleotides length such as ribosomal RNAs.
Introduction:
The primary products of almost all genomes are transcripts, i.e. RNA sequences. Their expression is often regulated by RNA structure which forms when the transcript interacts with itself via hydrogen-bonds between complementary nucleotides (G-C, A-U, G-U). These structures regulate translation, transcription, splicing, RNA editing and transcript degradation. To assign a potential functional role to a transcript, it often suffices to know its RNA secondary structure, i.e. the set of base pairs. As entire transcriptomes are now routinely sequenced, computational methods that predict RNA secondary structure for individual input RNA sequences play a key role in annotating new transcripts. This is emphasised by the fact that the majority of mammalian genomes is transcribed into transcripts of unknown function 1, 2 and that experimental techniques for RNA structure determination such as X-ray crystallography and NMR remain costly and slow.
More than three decades of research have been invested into devising methods that take a single RNA sequence and predict its RNA secondary structure. When homologous sequences from related species are scarce or not available, non-comparative methods such as RNAfold 3 and Mfold 4 provide the state-of-art in terms of prediction accuracy. They employ an optimisation strategy that searches the space of potential secondary structures for the most stable structure and depend on hundreds of free energy parameters that have been initially experimentally determined 5 and computationally tweaked 6. Recent attempts at replacing these thermodynamic parameters by probabilistic ones have lead to a similar or slightly improved prediction accuracy 7. All non-comparative thermodynamic methods, however, show a marked drop in performance accuracy for increased sequence lengths.
Key experiments 8, 9, 10 from the early 1980s show that structure formation happens co-transcriptionally, i.e. while the RNA is being transcribed. Many experiments 11, 12, 13, 14, 15, 16, 17, 18, 19 have since substantiated this view. In 1996, Morgan and Higgs 20 studied the discrepancies between the conserved RNA secondary structures and the corresponding, predicted minimum free energy (MFE) structures for long RNA sequences and concluded that these differences “cannot simply be put down to errors in the free energy parameters used in the model”. They hypothesised that these differences may be due to effects of kinetic folding. These results are complemented by statistical evidence that structured transcripts not only encode information on the functional RNA structure, but also on their co-transcriptional folding pathway 21. While there is thus ample evidence that the process of structure formation matters to the formation of the functional structure in vivo, it is ignored by thermodynamic methods for RNA secondary structure prediction.
Several sophisticated computational methods have already been devised that explicitly mimic the co-transcriptional structure formation in vivo22, 23, 24, 25, 26, 27, 28, 29, 30. These folding pathway prediction methods make a range of simplifying assumptions and approximations of the complex in vivo environment. So far, these methods have only been used to study a few select and typically short ( 1000 nt) sequences and an evaluation of their prediction accuracy is currently missing.
We here propose a conceptually new method, called CoFold, that combines the benefits of a deterministic, thermodynamic method with kinetic considerations that capture effects of the structure formation process. For this, we build upon the state-of-the-art method RNAfold 3 by combining its thermodynamic energy scores with a scaling function. We train the two free parameters of CoFold on a large and diverse data set of 248 sequences and examine the predictive power of CoFold on a non-redundant data set of 61 long sequences ( 1000 nt). CoFold shows a significant improvement in prediction accuracy, in particular for long RNA sequences such as ribosomal RNAs.
Folding long RNA sequences
| TPR (%) | FPR (%) | PPV (%) | MCC (%) | |
|---|---|---|---|---|
| RNAfold | 46.30 | 0.0176 | 39.74 | 42.81 |
| RNAfold-A | 52.02 | 0.0160 | 44.76 | 48.17 |
| CoFold | 52.83 | 0.0159 | 45.79 | 49.10 |
| CoFold-A | 57.80 | 0.0145 | 50.06 | 53.70 |
We evaluate the prediction accuracy of CoFold by comparing the secondary structure predicted by CoFold to the known reference secondary structures for a test set of 61 long sequences (long data set). We compile this data set by identifying sequences that are long ( 1000 nt), correspond to biological sequences, have reference structures that are supported by phylogenetic evidence and are non-redundant in terms of pairwise percent sequence identify (max 85%) and evolutionary distance (Supplementary Information, Section 1, Table 2, Table 3 and Table 4). These selection criteria yield a data set of 16S ribosomal RNA (rRNA) and 23S rRNA sequences from archaea, bacteria, eukaryotes and chloroplasts with an average length of 2397 nt (min 1245 nt, max 3578 nt).
Compared to RNAfold which is the state-of-the-art thermodynamic RNA structure prediction method, CoFold predicts 7% more known base pairs at 6% higher specificity than RNAfold thereby increasing the Matthew’s correlation coefficient (MCC) by 6% (MCC (RNAfold) = 42.81%, MCC (CoFold) = 49.10%) (Table 1, Supplementary Information, Section 2). This improvement in overall performance accuracy can be attributed to a simultaneous increase of the positive predictive value (PPV) and the true positive rate (TPR) for almost all individual sequences (Figure 1) and a simultaneous slight decrease of the false positive rate (FPR) (Supplementary Information, Section 2 and Figure 5). Both RNAfold and CoFold employ the default Turner 1999 free energy parameters 5. Combining CoFold with the Andronescu 2007 free energy parameters 6 (CoFold-A) increases the sensitivity and specificity by a further 4% (MCC (CoFold-A) = 53.70%). Doing the same with RNAfold (RNAfold-A) also increases the sensitivity and specificity with respect to RNAfold, but results in a smaller performance increase than for CoFold (MCC (RNAfold-A) = 48.17%, MCC (CoFold) = 49.10%). Whereas CoFold only depends on two free parameters, the Andronescu 2007 free energy model 6 comprises 363 free parameters that were trained using machine learning techniques (Supplementary Information, Section 3).
Explicitly capturing the structure formation process
In order to capture effects of co-transcriptional folding in CoFold, we introduce a scaling function . This function scales the nominal energy contribution of any base-pair-like interaction depending on the distance of the interaction partners along the sequence (Supplementary Information, Section 3 and Figure 6). It thereby captures that during the structure formation process, potential pairing partners in close proximity are easier to identify than more distant ones. This scaling amounts to a re-weighing of the structure search space that the structure prediction algorithm explores. Rather than guiding the structure prediction solely based on thermodynamic considerations as the state-of-the-art methods RNAfold and Mfold 4 do, CoFold thus combines kinetic and thermodynamic considerations.
The scaling function of CoFold depends on two free parameters, and which have a straightforward interpretation (Supplementary Information, Section 3 and Figure 6). Our goal in training the two parameters was to confirm that parameter training is robust and to ensure that CoFold can be applied across a wide range of sequence lengths.
To this end, we compiled an extended data set of 248 sequences (combined data set) which comprises the 61 long sequences of the long data set and, in addition, 187 short sequences ( nt length) that also correspond to biological sequences whose reference structures are supported by phylogenetic evidence (Supplementary Information, Section 1, Table 2, Table 3 and Table 4). The sequences in this combined data set have an average length of 776 nt (min 110 nt, max 3578 nt). Using twenty trials of five-fold cross-validation for parameter training, we find that the optimal prediction accuracy in terms of average MCC is obtained by a combination of and values whose strong correlation can be described by a linear function , where is the slope and the intercept (%) (Supplementary Information, Section 4 and Figure 8 (left)). Our cross-evaluation experiments yield optimal parameter combinations that fall within or near the 95% confidence interval around the linear fit, thus confirming the robustness of parameter training (Supplementary Information, Figure 8 (right)). We use and in CoFold and CoFold-A (Supplementary Information, Figure 6).
CoFold and CoFold-A outperform RNAfold and RNAfold-A also for short sequences ( nt), although the improvement in terms of MCC is less pronounced than for long sequences (Supplementary Information, Table 5). RNAfold shows a slight decrease in prediction accuracy when used with the Andronescu 2007 parameters. The behaviour of CoFold is in line with our expectation that the beneficial impact of modelling co-transcriptional folding decreases for short sequences.
We conclude that CoFold effectively depends only on one free parameter and that CoFold and CoFold-A increase the prediction accuracy for all sequence lengths, in particular for long sequences ( nt).
Capturing structure formation yields improved structures of similar free energies
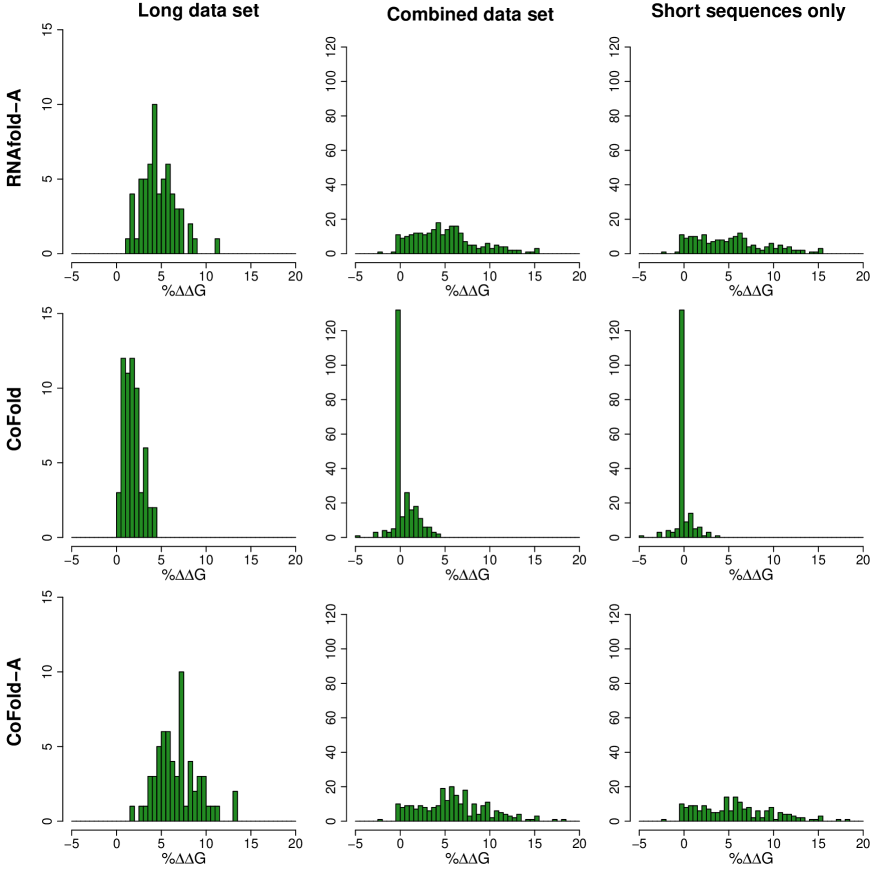
In order to examine if capturing the effects of co-transcriptional folding significantly changes the free energies of the predicted structures, we calculated the free energies of the structures predicted by CoFold, CoFold-A and RNAfold-A and compared them to the free energies of the corresponding structures predicted by RNAfold. To ensure consistency, we used the Turner 1999 energy parameters to calculate the energies of all predicted RNA structures.
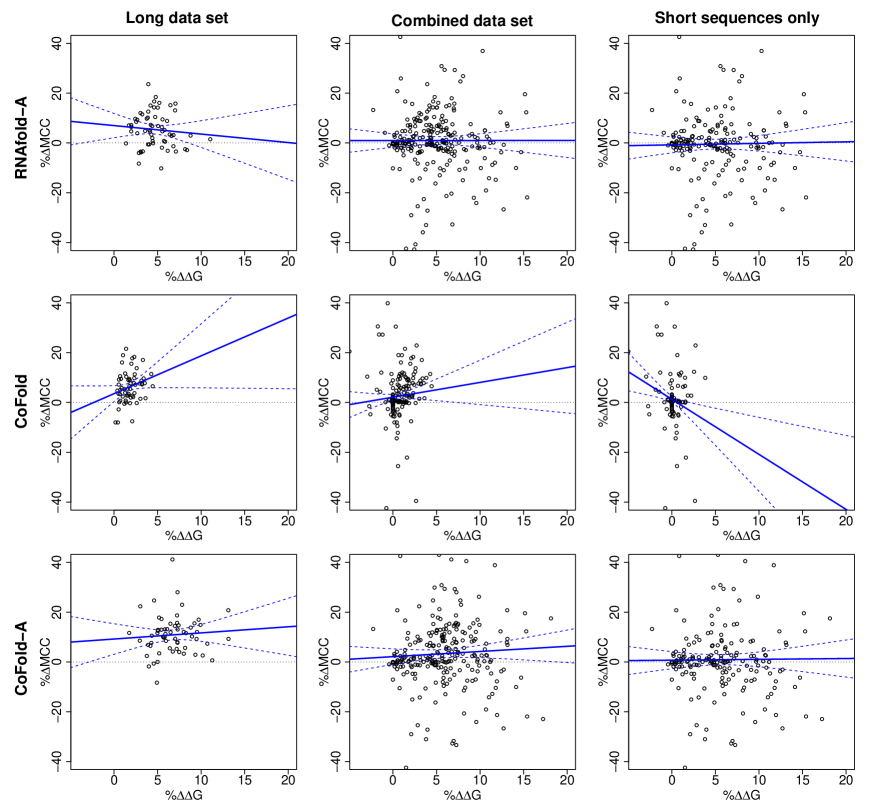
The structures predicted by CoFold for the long data set differ on average by 2% from the respective free energies of the corresponding structures predicted by RNAfold and the distribution of relative energy differences is comparatively tight (stdev = 1.0%, min = 0.2%, max = 4.4%) (Figure 2 and Supplementary Information, Table 6). Combining CoFold and RNAfold with the Andronescu 2007 energy parameters significantly increases the average free energy difference (5% (RNAfold-A), 7% (CoFold-A)), broadens the distributions (stdev(RNAfold-A) = 1.9%, stdev(CoFold-A) = 2.4%) and leads to higher maximum energy differences (max(RNAfold-A) = 11.1%, max(CoFold-A) = 13.1%). For short sequences, these differences are even more pronounced (Supplementary Information, Table 6).
Most importantly, a large energy difference with respect to the free energy of the structure predicted by RNAfold does not imply an increased prediction accuracy, neither for short nor long sequences and for none of the prediction programs (Supplementary Information, Figure 11 and Table 7).
To summarise, CoFold significantly increases the prediction accuracy without significantly altering the free energies of the structures that RNAfold would predict for the same input sequences.
Folding ribosomal RNAs
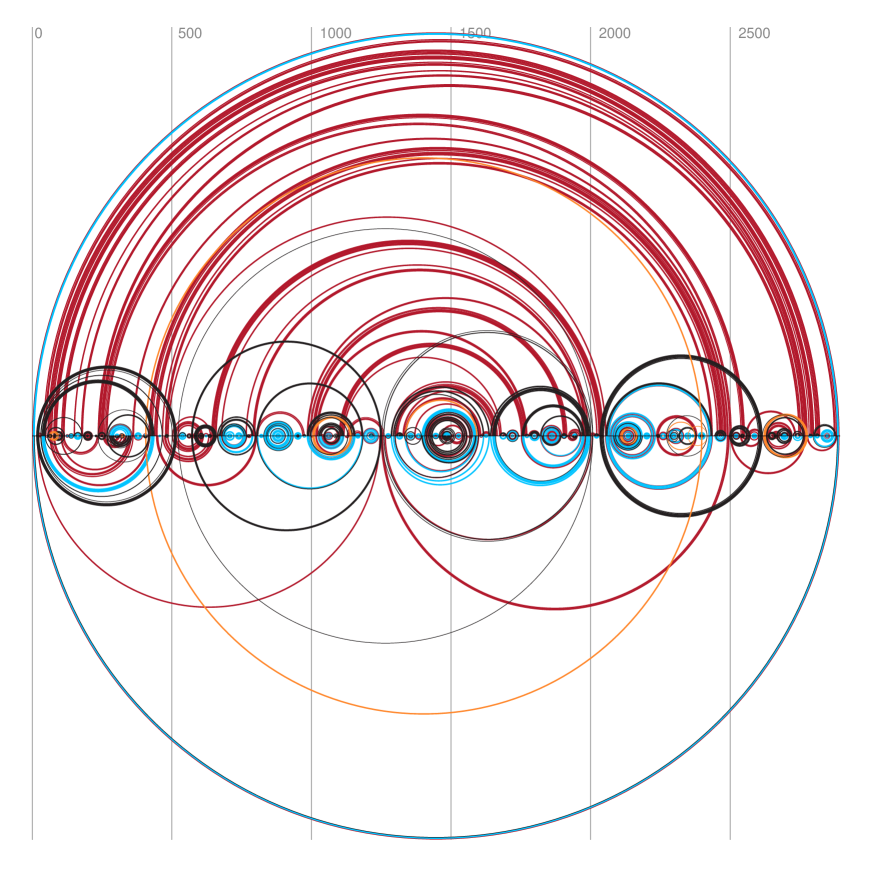
23S ribosomal RNAs are the longest sequences of the long data set with an average length of 3069 nt (min 2882 nt, max 3578 nt) and are thus some of the most challenging RNA structures to predict. Using CoFold and CoFold-A, we increase their prediction accuracy in terms of MCC w.r.t. RNAfold on average by 8% and 12%, respectively. Figure 3 shows, for the 23S rRNA of the gamma-proteobacteria Pseudomonas aeruginosa, how the RNA structure predicted by CoFold-A compares to that predicted by RNAfold. The most apparent differences are that RNAfold predicts many incorrect mid- and long-range base pairs (red arcs spanning more than 100 nt) and that almost all of these disappear with CoFold-A. In addition, CoFold-A adds many correct mid- and long-range base pairs (blue arcs), see in particular those spanning almost the entire sequence. Overall, CoFold-A increases the MCC of RNAfold from 43% to 58%. This 15% rise in performance accuracy is due to a significant increase of the true positive rate (45% 61%) and an equally significant increase of the positive predictive value (41% 56%). This is in-line with is the typical behaviour seen for CoFold (Figure 1 and Supplementary Information, Figure 5). The false positive rate for both prediction methods remains low at 0.01%.
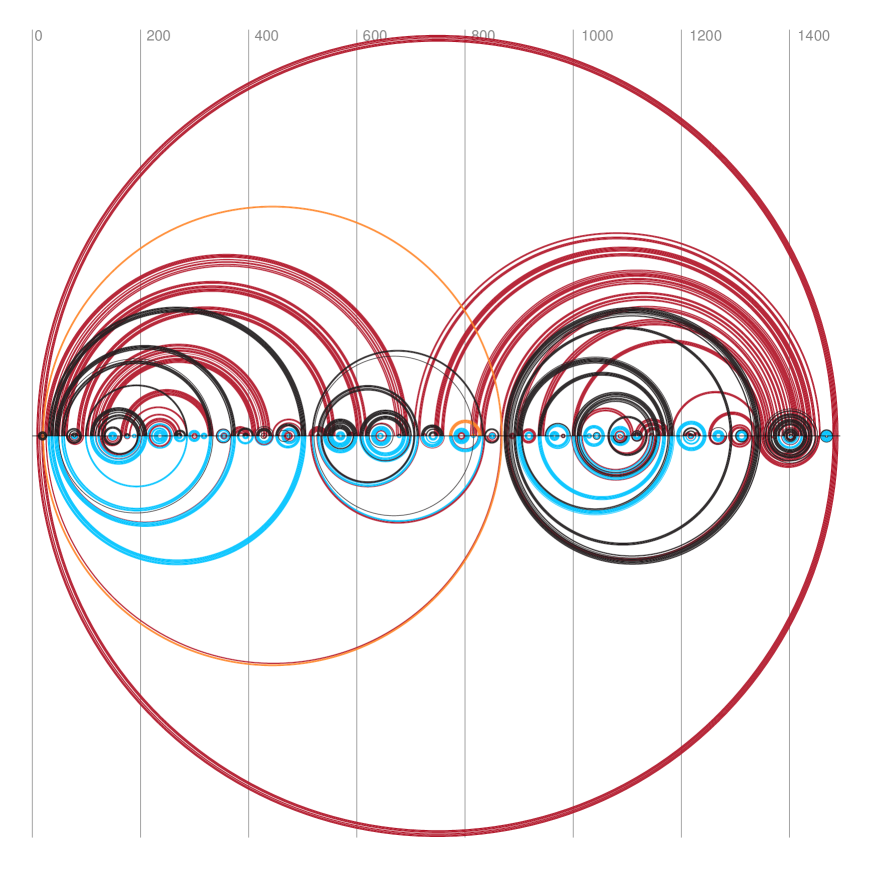
We also investigated the performance for the 16S ribosomal RNAs in greater detail. With an average length of 1550 nt (min 1245 nt, max 1799 nt), these are significantly shorter than the 23S rRNAs in our long data set, but still considerably longer than the average test sequence on which thermodynamic prediction methods are typically benchmarked. Figure 4 shows the improvements in prediction accuracy for the 16S rRNA of the freshwater algae Cryptomonas sp. (species unknown). This ribosomal sequence is 1493 nt long. CoFold-A improves the prediction accuracy of RNAfold from an MCC of 32% to 73%. This 41% improvement in performance accuracy is achieved by significantly reducing the number of erroneously predicted mid- to long-range base pairs (red arcs spanning more than 100 nt) while simultaneously increasing the number of correctly predicted base pairs in wide distance range (blue arcs). This is reflected by the simultaneous increase of the true positive rate (33% 77%) and the positive predictive value (30% 69%) which, in this example, is also accompanied by a slight reduction of the false positive rate (0.03% 0.01%).
Discussion
Our results show that the state-of-the-art in non-comparative RNA secondary structure prediction can be significantly improved by capturing effects of the structure formation process. To this end, we introduce a conceptually new RNA secondary structure prediction method called CoFold which judges the reachability of potential pairing partners during co-transcriptional structure formation via a scaling function. We reliably train the two free parameters of CoFold using a large and diverse data set of 248 sequences. This scaling function effectively depends on only one free parameter which has a straightforward interpretation as it determines how the reachability declines as function of the nucleotide distance. Without altering the free energy parameters of the underlying thermodynamic model, CoFold thereby guides the structure prediction process by a combination of thermodynamic and kinetic considerations. It thereby arrives at significantly more accurate structure predictions, in particular for long sequences ( 1000 nt) such as ribosomal RNAs. The significance of the improvement in prediction accuracy is underlined by the improvement in sensitivity and specificity for the individual sequences. Most importantly, this improvement is gained without significantly shifting the free energies of the predicted RNA structures. We thereby confirm Morgan and Higgs 20 who hypothesised that discrepancies between the functional RNA secondary structure and the corresponding minimum free energy structures predicted by thermodynamic methods such as RNAfold are not due to errors of the underlying free energy parameters, but due to a lack of modelling the effects of kinetic structure formation.
Many sophisticated experiments 8, 9, 10, 11, 12, 13, 14, 15, 16, 17, 18, 19 paint a dauntingly complex picture of co-transcriptional structure formation in vivo which can depend on a multitude of factors ranging from the speed of transcription and the variation thereof, to a range of carefully orchestrated cis and trans interactions with a variety of other molecules.
Several sophisticated folding pathway prediction methods have already been devised that explicitly mimic the co-transcriptional structure formation in vivo22, 23, 24, 25, 26, 27, 28, 29, 30. Even though these methods need to make a range of simplifying assumptions to approximate the complex in vivo environment and have so far been been only used to investigate a few select and typically short ( 1000 nt) sequences, these methods have already allowed us to gain valuable and detailed insight into co-transcriptional folding pathways 26, 31.
By proposing a conceptually new approach to RNA secondary structure prediction, CoFold, we show that it is possible to capture effects of the structure formation process in deterministic thermodynamic methods and that the benefits of doing so are significant, both in terms of prediction accuracy and insight gained. This finding is not too surprising given that any co-transcriptionally emerging RNA transcript in vivo needs to find a way to actually reach the functionally relevant RNA structure. Although CoFold only constitutes the first attempt at explicitly capturing the effects of co-transcriptional folding in a thermodynamic RNA secondary structure prediction program, we hope that our results will inspire a new generation of these methods that explicitly capture aspects of the structure formation process in vivo. Recent developments in experimental techniques 17, 19 will no doubt significantly contribute to our understanding of structure formation in vivo. We are thus looking forward to joint projects between the experimental and theoretical RNA structure community.
Methods summary
The algorithm of CoFold and the scoring function are described in detail in the Supplementary Information. CoFold is publicly available on the Internet via a web-server at http://www.e-rna.org/cofold.
References
- 1 Mattick, J. S. & Makunin, I. V. Non-coding RNA. Hum Mol Gen 15, R17–R29 (2006).
- 2 Carninci, P. et al. The transcriptional landscape of the mammalian genome. Science 309, 1559–1563 (2005).
- 3 Zuker, M. & Stiegler, P. Optimal computer folding of large RNA sequences using thermodynamic and auxiliary information. Nucleic Acids Res 9, 133–148 (1981).
- 4 Zuker, M. Mfold web server for nucleic acid folding and hybridization prediction. Nucleic Acids Res 31, 3406–3415 (2003).
- 5 Mathews, D. H., Sabina, J., Zuker, M. & Turner, D. H. Expanded sequence dependence of thermodynamic parameters improves prediction of RNA secondary structure. J Mol Biol 288, 911–940 (1999).
- 6 Andronescu, M., Condon, A., Hoos, H. H., Mathews, D. H. & Murphy, K. P. Efficient parameter estimation for RNA secondary structure prediction. Bioinformatics 23, I19–I28 (2007).
- 7 Rivas, E., Lang, R. & Eddy, S. E. A range of complex probabilistic models for RNA secondary structure prediction that includes the nearest-neighbor model and more. RNA 18, 193–212 (2012).
- 8 Boyle, J., Robillard, G. & Kim, S. Sequential folding of transfer RNA. A nuclear magnetic resonance study of successively longer tRNA fragments with a common 5’ end. J Mol Biol 139, 601–625 (1980).
- 9 Kramer, F. & Mills, D. Secondary structure formation during RNA-synthesis. Nucleic Acids Res 9, 5109–5124 (1981).
- 10 Brehm, S. & Cech, T. Fate of an intevening sequence ribonucleic-acid — excision and cyclization of the Tetrahymena ribosomal ribonucleic-acid intervening sequence in vivo. Biochemistry 22, 2390–2397 (1983).
- 11 Lewicki, B., Margus, T., Remme, J. & Nierhaus, K. Coupling of rRNA transcription and ribosomal assembly in vivo – formation of active ribosomal-subunits in Escherichia coli requires transcription of RNA genes by host RNA polymerase which cannot be replaced by T7 RNA polymerase. J Mol Biol 231, 581–593 (1993).
- 12 Chao, M. Y., Kan, M. & Lin-Chao, S. RNAII transcribed by IPTG-induced T7 RNA polymerase is non-functional as a replication primer for ColE1-type plasmids in Escherichia coli. Nucleic Acids Res 23, 1691–1695 (1995).
- 13 Pan, T., Fang, X. & Sosnick, T. Pathway modulation, circular permutation and rapid RNA folding under kinetic control. J Mol Biol 286, 721–731 (1999).
- 14 Heilman-Miller, S. & Woodson, S. Effect of transcription on folding of the Tetrahymena ribozyme. RNA 9, 722–733 (2003).
- 15 Heilman-Miller, S. & Woodson, S. Perturbed folding kinetics of circularly permuted RNAs with altered topology. J Mol Biol 328, 385–394 (2003).
- 16 Mahen, E., Harger, J., Calderon, E. & Fedor, M. Kinetics and thermodynamics make different contributions to RNA folding in vitro and in yeast. Mol Cell 19, 27–37 (2005).
- 17 Adilakshmi, T., Soper, S. & Woodson, S. Structural analysis of RNA in living cells by in vivo synchrotron x-ray footprinting. Methods Enzymol 468, 239–259 (2009).
- 18 Mahen, E., Watson, P., Cottrell, J. & Fedor, M. mRNA Secondary Structures Fold Sequentially But Exchange Rapidly In Vivo. PLoS Biol 8, e1000307 (2010).
- 19 Woodson, S. A. Compact Intermediates in RNA folding. Annual Review of Biophysics 39, 61–77 (2010).
- 20 Morgan, S. & Higgs, P. Evidence for kinetic effects in the folding of large RNA molecules. J Chem Phys 105, 7152–7157 (1996).
- 21 Meyer, I. M. & Miklós, I. Co-transcriptional folding is encoded within RNA genes. BMC Mol Biol 10, 5 (2004).
- 22 Mironov, A., Dyakonova, L. & Kister, A. A kinetic approach to the prediction of RNA secondary structures. J Biomol Struct Dyn 2, 953–962 (1985).
- 23 Mironov, A. & Lebedev, V. A kinetic model of RNA folding. Biosystems 30, 49–56 (1993).
- 24 Gultyaev, A., von Batenburg, F. & Pleij, C. The computer-simulation of RNA folding pathways using a genetic algorithm. J Mol Biol 250, 37–51 (1995).
- 25 Flamm, C., Fontana, W., Hofacker, I. L. & Schuster, P. RNA folding at elementary step resolution. RNA 6, 325–338 (2000).
- 26 Isambert, H. & Siggia, E. D. Modeling RNA folding paths with pseudoknots: application to hepatitis delta virus ribozyme. PNAS 97, 6515–6520 (2000).
- 27 Xayaphoummine, A., Bucher, T., Thalmann, F. & Isambert, H. Prediction and statistics of pseudoknots in RNA structures using exactly clustered stochastic simulations. PNAS 100, 15310–15315 (2003).
- 28 Xayaphoummine, A., Bucher, T. & Isambert, H. Kinefold web server for RNA/DNA folding path and structure prediction including pseudoknots and knots. Nucleic Acids Res 33, W605–610 (2005).
- 29 Danilova, L., Pervouchine, D., Favorov, A. & Mironov, A. RNAkinetics: a web server that models secondary structure kinetics of an elongating RNA. Journal of Bioinformatics and Computational Biology 4, 589–596 (2006).
- 30 Geis, M. et al. Folding kinetics of large RNAs. J Mol Biol 379, 160–173 (2008).
- 31 Schoemaker, R. J. W. & Gultyaev, A. P. Computer simulation of chaperone effects of Archael C/D box sRNA binding on rRNA folding. Nucleic Acids Res 34, 2015–2026 (2006).
- 32 Lai, D., Proctor, J. R., Zhu, J. Y. & Meyer, I. M. R-CHIE: a web server and R package for visualizing RNA secondary structures. Nucleic Acids Res 40, e95 (2012).
- 33 Cannone, J. et al. The Comparative RNA Web (CRW) Site: an online database of comparative sequence and structure information for ribosomal, intron, and other RNAs. BMC Bioinformatics 3, 2 (2002).
- 34 Edgar, R. MUSCLE: multiple sequence alignment with high accuracy and high throughput. Nucleic Acids Res 32, 1792–1797 (2004).
- 35 Griffiths-Jones, S. et al. Rfam: annotating non-coding RNAs in complete genomes. Nucleic Acids Res 33, D121–D124 (2005).
- 36 Nussinov, R. & Jacobson, A. Fast algorithm for predicting the secondary structure of single-stranded RNA. PNAS 77, 6309–6313 (1980).
- 37 Hofacker, I. et al. Fast Folding and Comparison of RNA Secondary Strutures. Monatshefte für Chemie (Chemical Monthly) 125, 167–188 (1994).
- 38 Lorenz, R. et al. ViennaRNA Package 2.0. Algorithms for Molecular Biology 6 (2011).
Acknowledgements
This project was supported by grants to I.M.M. from the Natural Sciences and Engineering Research Council (NSERC) of Canada and from the Canada Foundation for Innovation (CFI). J.R.P. holds an Alexander Graham Bell Canada Graduate Scholarship from NSERC, with additional funding from the CIHR/MSFHR Bioinformatics Training Program at the University of British Columbia. CIHR are the Canadian Institutes of Health Research and MSFHR is the Michael Smith Foundation for Health Research in Canada.
Author Contributions
Both authors were involved in every aspect of the research. J.R.P. programmed CoFold.
Author Information
Correspondence and requests for material should be addressed to I.M.M. (irmtraud.meyer@cantab.net).
Figures


Supplementary Information
CoFold: thermodynamic RNA structure prediction with a kinetic twist
Jeff R. Proctor and Irmtraud M. Meyer
Centre for High-Throughput Biology & Department of Computer Science and
Department of Medical Genetics, University of British Columbia,
2125 East Mall, Vancouver, BC,
Canada V6T 1Z4, irmtraud.meyer@cantab.net
July 15, 2012
Methods
(1) Compilation of the long and combined data sets
The long data set consists of 16S and 23S ribosomal RNAs only. 16S and 23S multiple-sequence alignments for bacteria, eukaryotes, archaea and chloroplasts were retrieved from the Comparative RNA Web site (CRW) 33. Because no consensus RNA structure is provided for each alignment, we projected the individual structures onto the alignment. The structure with the lowest mismatch score (defined in Equation (1)) was chosen as the consensus RNA structure for each alignment. For the calculation of the mismatch score, base pairs with a gap in one base position, and a non-gap in the other are considered one-sided gaps. Base pairs with gaps on both sides are considered two-sided gaps. Non-canonical pairs are those other than G-C, A-U, G-U. The length of the alignment is denoted by .
| (1) |
Sequences with large indels, many ambiguous nucleotides, or a poor fit to the consensus RNA structure were removed from the alignment. Unpaired regions of the alignment were realigned using MUSCLE 34. Individual sequences were extracted from each resulting alignment such that no pair of extracted sequences have a pairwise percent sequence identity greater than an alignment-specific threshold. The exact threshold varies to ensure no biological class or evolutionary clade is over-represented in the long data set (max %, Table 3). For each extracted sequence, the consensus alignment structure was projected onto the sequence by removing base pairs at gap positions, and removing any non-canonical base pairs. The resulting 61 sequences have a mean sequence length of nt and constitute the long data set (Table 2, Table 3 and Table 4).
The combined data set was constructed primarily for robustness of parameter training, and contains Rfam sequences from a wide variety of biological classes 35. Rfam alignments were chosen according to the following criteria:
-
•
mean sequence length greater than
-
•
covariation (defined in Equation (2)) greater than
-
•
minimum of sequences
-
•
mean percentage of canonical base pairs greater than %
-
•
diverse biological classes and evolutionary clades
Sequences were extracted from the Rfam alignments using the same protocol as for the CRW alignments described above. Specifically, no pair of sequences extracted from the same alignment share a pairwise percent sequence identity above an alignment-specific threshold (max %, Table 3). Consensus RNA structures were projected onto individual sequences by removing base pairs at gap positions, and by removing any non-canonical base pairs. The mean sequence length of the resulting Rfam sequences is nt, and the combined dataset has an average sequence length of nt (Table 2), see Table 3 for a description of biological class and sequence extraction details, and Table 4 for alignment quality metrics.
For a given multiple-sequence alignment, the covariation is defined as:
| (2) |
where
-
•
is the set of base pairs and in the consensus secondary structure.
-
•
is the number of sequences in the alignment.
-
•
is the Hamming distance between the strings and .
-
•
is an indicator function such that if and can form a canonical base-pair, and and can also form a canonical base-pair, (otherwise ).
-
•
is an indicator function such that if and and/or and cannot for a canonical base-pair, (otherwise ).
(2) Definition of performance metrics
Structure prediction accuracy is measured on a base pair level. True positives (TP) are correctly predicted base pairs. False positives (FP) are incorrectly predicted base pairs that are not part of the reference structure. True negatives (TN) are hypothetical base pairs that are not predicted, nor part of the reference structure. False negatives (FN) are reference base pairs missed by the prediction. Performance metrics for true positive rate (TPR), false positive rate (FPR), positive predictive value (PPV), and Matthew’s correlation coefficient (MCC) are defined as follows:
| (3) |
| (4) |
| (5) |
| (6) |
| (7) |
| (8) |
| (9) |
(3) Incorporating co-transcriptional folding into the prediction algorithm of CoFold
The Nussinov algorithm 36 was one of the first attempts at RNA secondary structure prediction. It is a dynamic programming method that efficiently calculates the secondary structure with the largest number of base pairs in time, where denotes the length of the input sequence. The algorithm solves the problem recursively by determining the optimal structure for sub-sequences, and using these solutions to derive optimal structures for successively larger subsequences. The output structure is the optimal solution for the full sequence. This algorithm, however, has several shortcomings. First, base pairs vary in stability; for example, G-C pairs are energetically more favourable than A-U pairs. The Nussinov algorithm weights all pairs equally. Second, The stability of a base pair depends highly on its neighbouring base pairs due to so-called stacking interactions between adjacent pairs, and this contextual effect is ignored by the algorithm.
The Zuker-Stiegler algorithm 3 is an advancement of the Nussinov algorithm. Rather than predicting the structure with the greatest number of pairs, the Zuker-Stiegler algorithm predicts the most thermodynamically favourable (and pseudo-knot free) RNA structure according to a set of free energy parameters. This structure is also called the minimum-free-energy (MFE) structure. The algorithm assigns a sequence-specific free energy value to various structural building blocks, such as stacking interactions between pairs of adjacent base pairs, unpaired nucleotides, and hairpin loops. The algorithm utilises dynamic programming similarly to the Nussinov algorithm, but calculates two energy values for all subsequences of a given input sequence , where :
-
•
: minimum free energy of subsequence given nucleotides i and j form a base pair
-
•
: minimum free energy of subsequence
| (10) |
| (11) |
and are calculated for each subsequence as the minimum of a well-defined set of rules (Equation (10), Equation (11)). The minimum free energy can be retrieved from the value at , where denotes the length of the input sequence. The corresponding MFE structure is retrieved by backtracking through the and matrices.
The Zuker-Stiegler algorithm requires a large set of thermodynamic parameters. In 1999, the Turner group published one such model, which included a combination of experimentally measured energies and estimated values 5. This parameter set (called Turner 1999 parameter set) is widely used by many state-of-the-art tools, including RNAfold37 and Mfold 4. Andronescu et al. improved estimated values in the Turner 1999 parameter set by applying sophisticated machine learning techniques to training 363 free parameter values 6 . These parameters were adjusted using a training set of 3439 reference structures and 946 thermodynamic measurements by optical melting resulting in the Andronescu 2007 parameter set. They observed an average performance increase of 7% on a test set of 1660 sequences containing several biological classes, including tRNA, RNase P, rRNA and SRP RNA.
The Zuker-Stiegler algorithm traditionally considers only the change in free energy for a given RNA secondary structure conformation in thermodynamic equilibrium, but does not consider the process of RNA structure formation, i.e. how the RNA sequence arrives at the MFE structure. Rather, the Zuker-Stiegler algorithm implicitly assumes that the input RNA sequence (1) is already fully synthesised, (2) in thermodynamic equilibrium and (3) will always be able to reach the RNA structure that minimises the overall free energy of the molecule. We know from a range of experiments, however, that RNA molecules start to fold while they emerge during transcription, that they are not necessarily in thermodynamic equilibrium during structure formation in vivo and that they may get trapped on their kinetic folding pathway. That RNA molecules overall proceed towards the MFE structure over time is only an approximation of the complex reality in vivo. As the molecule emerges from the polymerase, however, local structures immediately begin to form. Formation of long-range base pairs may require disruption of these local structures, and their folding rate may be prohibitively slow due to high energy barriers. That is, the molecule may never reach the minimum free energy structure due to kinetic considerations. The structure formation in vivo may get further complicated due trans interactions between the RNA sequence and other molecules in the living cell which we ignore for now.
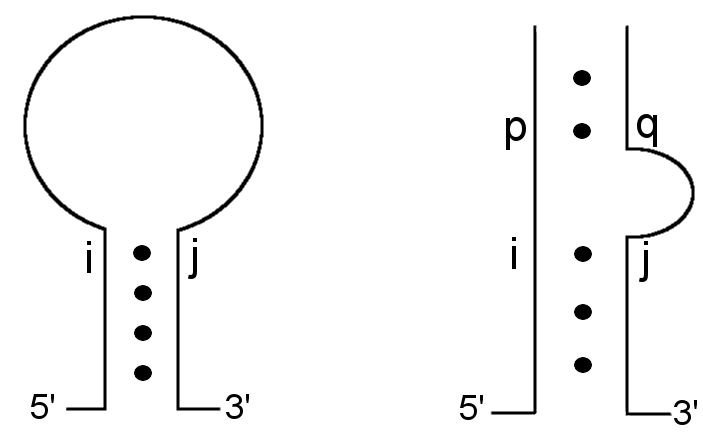
We propose a new method for RNA secondary structure prediction, CoFold, that takes into account some effects of co-transcriptional folding. The key effect that we aim to model is that during co-transcriptional folding in vivo, it does matter to a given sequence position whether a potential pairing partner is available for base-pairing or not. To capture this, we model the distance along the sequence between base pairing sequence positions. CoFold is a modification to the Zuker-Stiegler algorithm 3, and it was implemented using the RNAfold source code from the ViennaRNA package 37, 38.
CoFold calculates energies in the same fashion as in RNAfold, but all energy contributions associated with a base pair are modified by a scaling function according to the number of nucleotides between the pair (i.e. the distance ). This scaling function models the exponential decay in reachability as function of the nucleotide distance between the two potential pairing partners and depends on two parameters and (Equation (12), Figure 6). Both parameters have a straightforward interpretation. The value of specifies the range of the scaling function (e.g. when is , the affected free energies will range from % to % of their original values). The value of determines the rate of the exponential decay, where low values of result in a steep decay function.
| (12) |
The scaling function is only used in conjunction with energy values in the calculation because these correspond to predicted base pairs. The function is not applied to the energy of subsequences in order to avoid multiple applications to the same value. The function is applied both to elements with positive energy, such as loops and bulges, as well as to those with negative energy, such as stacking interactions. This is necessary to preserve the relative magnitude of the contributions from structural components, see Equation (13) and Figure 7 for modified . The calculation remains the same as in RNAfold.
| (13) |
The output of CoFold is an RNA secondary structure which promotes base pairs according to the above scaling function. The predicted RNA secondary structure therefore captures both thermodynamic contributions as well as effects due to co-transcriptional structure formation. Like RNAfold, CoFold allows the user to select a thermodynamic parameter set and the running time of CoFold also scales with , where denotes the length of the input sequence. For performance evaluation, we use both the Turner 1999 (CoFold) and the Andronescu 2007 (CoFold-A) parameter sets introduced above.
(4) Parameter training
CoFold has two free parameters: and . Due to the small number of parameters, they were trained using a simple brute force scheme. CoFold was run on all sequences of the combined data set and performance metrics were calculated for each combination in set (defined in Equation (14)). The Turner 1999 thermodynamic parameter set 5 was used for parameter training.
| (14) |
| (15) | ||||
| (16) |
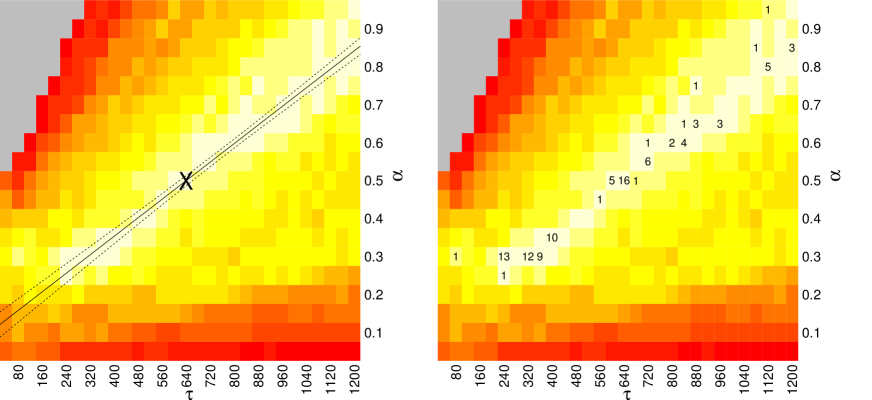
Performance metrics were found to be highly correlated in and (Figure 8 (right), Figure 9). To demonstrate this, linear regression was performed on the matrix (Figure 8 (left)). We first compiled a set of triples , for which is in the 97th quantile of the performance matrix. Weighted linear regression was performed with and as dimensions, and as the weight. The regression line fits the data with an value of %, indicating that variability in highly accounts for the variability in . Regression line (solid) and its % confidence region (dotted) are plotted in Figure 8 (left).
Twenty trials of five-fold cross validation were performed to determine robustness of parameter training. In each trial, the combined data set is randomly divided into five partitions . For each partition, the optimal parameter combination is determined for the remaining sequences (Equation (17)). The cross validation results are plotted in Figure 8 (right), where the integer in each cell indicates the number of trials where that parameter combination was optimal. The optimal parameter values highly cluster around the linear regression line show in Figure 8 (left).
| (17) | ||||
The default parameter combination for CoFold is . This parameter set maximises for the combined dataset. The default parameter combination is marked with an ”X” in Figure 8 (left) which shows that it lies directly on the linear regression line.
(5) Calculation of free energy differences
We define as the difference between the free energy () of a given prediction and the corresponding RNAfold prediction. We calculate these values for RNAfold-A, CoFold, and CoFold-A. Because the Andronescu 2007 parameters use modified the free energy values, we use RNAeval from the ViennaRNA package 37, 38 to calculate the free energy of each predicted structure on an equal footing. Unlike RNAfold which predicts a minimum free energy structure from a sequence, RNAeval calculated the free energy for an input RNA structure according to the provided thermodynamic parameters. For consistency, we use the parameters Turner 1999 thermodynamic model 5 for all calculation. For a prediction program which corresponds to RNAfold-A CoFold or CoFold-A, we define and as follows.
| (18) |
| (19) |
Tables
| long data set | combined data set | ||
|---|---|---|---|
| clade | 1000 nt | all | 1000 nt |
| Bacteria | 15 | 69 | (54) |
| Eukaryotes | 15 | 112 | (97) |
| Virus | 0 | 20 | (20) |
| Archea | 17 | 33 | (16) |
| Chloroplast | 14 | 14 | (0) |
| sum | 61 | 248 | (187) |
| sequence length (nt) | |||
| average | 2397 | 776 | (247) |
| minimum | 1245 | 110 | (110) |
| maximum | 3578 | 3578 | (628) |
| biological class | A.len | clade | N.seq | N.ext | max | source | ID |
| ppid | |||||||
| (nt) | (%) | ||||||
| 16S rRNA (archea) | 1545 | A | 40 | 8 | 85 | CRW | 16S archaea |
| 23S rRNA (archea) | 3153 | A | 40 | 9 | 85 | CRW | 23S archaea |
| 16S rRNA (bacteria) | 1661 | B | 144 | 7 | 70 | CRW | 16S bacteria |
| 23S rRNA (bacteria) | 3046 | B | 40 | 8 | 85 | CRW | 23S bacteria |
| 16S rRNA (chloroplast) | 1558 | C | 40 | 5 | 85 | CRW | 16S chloroplast |
| 23S rRNA (chloroplast) | 3722 | C | 40 | 9 | 80 | CRW | 23S chloroplast |
| 16S rRNA (eukaryote) | 1867 | E | 40 | 7 | 85 | CRW | 16S eukaryote |
| 23S rRNA (eukaryote) | 4105 | E | 40 | 8 | 85 | CRW | 23S eukaryote |
| snRNA | 184 | E | 87 | 14 | 80 | Rfam | RF00003 |
| U2 spliceosomal RNA | 270 | E | 181 | 10 | 50 | Rfam | RF00004 |
| Nuclear RNase P | 622 | E | 77 | 11 | 45 | Rfam | RF00009 |
| snoRNA | 236 | E | 14 | 9 | 85 | Rfam | RF01256 |
| snoRNA | 394 | E | 4 | 1 | 85 | Rfam | RF01267 |
| snoRNA | 373 | E | 18 | 9 | 85 | Rfam | RF01296 |
| U4 spliceosomal RNA | 273 | E | 160 | 11 | 50 | Rfam | RF00015 |
| U5 spliceosomal RNA | 178 | E | 153 | 9 | 45 | Rfam | RF00020 |
| ciliate telomerase RNA comp. | 270 | E | 19 | 11 | 80 | Rfam | RF00025 |
| RNase MRP | 903 | E | 40 | 12 | 50 | Rfam | RF00030 |
| RNase P | 511 | B | 88 | 8 | 60 | Rfam | RF00011 |
| CsrB RNA | 391 | B | 11 | 7 | 85 | Rfam | RF00018 |
| lysine riboswitch | 232 | B | 37 | 14 | 65 | Rfam | RF00168 |
| Mg riboswitch - Ykok leader | 216 | B | 85 | 14 | 65 | Rfam | RF00380 |
| Ornate extremophilic RNA | 676 | B | 7 | 6 | 85 | Rfam | RF01071 |
| Pestivirus IRES | 286 | V | 23 | 5 | 85 | Rfam | RF00209 |
| Tombusvirus 5’ UTR | 180 | V | 7 | 5 | 85 | Rfam | RF00171 |
| Aphthovirus IRES | 471 | V | 87 | 4 | 85 | Rfam | RF00210 |
| Cripavirus IRES | 208 | V | 6 | 6 | 80 | Rfam | RF00458 |
| tRNA-like structures | 137 | V | 5 | 5 | 80 | Rfam | RF01084 |
| Archaeal RNase P | 533 | A | 25 | 16 | 80 | Rfam | RF00373 |
| alignment (ID) | A.len | av. seq. | av. | gaps | n | bpairs | canonical | covar. |
| (nt) | length | ppid | (%) | (%) | bpairs | |||
| (nt) | (%) | (%) | ||||||
| 16S archaea | 1545 | 1477 | 81.8 | 4.4 | 458 | 95.2 | 0.343 | |
| 23S archaea | 3153 | 2945 | 74.9 | 6.6 | 852 | 95.0 | 0.408 | |
| 16S bacteria | 1661 | 1520 | 76.7 | 8.5 | 453 | 93.4 | 0.352 | |
| 23S bacteria | 3046 | 2904 | 79.2 | 4.6 | 868 | 94.3 | 0.358 | |
| 16S chloroplast | 1558 | 1490 | 90.2 | 4.4 | 440 | 93.9 | 0.113 | |
| 23S chloroplast | 3722 | 2941 | 74.8 | 21.0 | 869 | 90.1 | 0.253 | |
| 16S eukaryote | 1867 | 1708 | 73.3 | 8.5 | 370 | 84.3 | 0.162 | |
| 23S eukaryote | 4105 | 3476 | 78.7 | 15.3 | 998 | 88.1 | 0.084 | |
| RF00003 | 184 | 162 | 63.1 | 11.8 | 40 | 93.2 | 0.493 | |
| RF00004 | 270 | 193 | 58.4 | 28.4 | 45 | 92.8 | 0.496 | |
| RF00009 | 622 | 315 | 40.7 | 49.3 | 62 | 89.3 | 0.397 | |
| RF01256 | 236 | 208 | 60.6 | 11.9 | 54 | 92.7 | 0.457 | |
| RF01267 | 394 | 384 | 72.5 | 2.6 | 128 | 94.3 | 0.295 | |
| RF01296 | 373 | 325 | 63.7 | 13.0 | 57 | 91.4 | 0.339 | |
| RF00015 | 273 | 147 | 52.2 | 46.2 | 31 | 91.5 | 0.604 | |
| RF00020 | 178 | 117 | 51.7 | 34.1 | 30 | 94.0 | 0.694 | |
| RF00025 | 270 | 186 | 42.5 | 31.1 | 39 | 86.4 | 0.395 | |
| RF00030 | 903 | 303 | 34.7 | 66.5 | 74 | 88.3 | 0.470 | |
| RF00011 | 511 | 373 | 63.0 | 27.1 | 105 | 95.1 | 0.500 | |
| RF00018 | 391 | 350 | 62.4 | 10.5 | 49 | 96.8 | 0.368 | |
| RF00168 | 232 | 183 | 46.1 | 21.2 | 53 | 90.3 | 0.580 | |
| RF00380 | 216 | 170 | 59.6 | 21.4 | 47 | 94.5 | 0.471 | |
| RF01071 | 676 | 609 | 59.9 | 9.9 | 159 | 90.2 | 0.378 | |
| RF00209 | 286 | 275 | 89.2 | 3.9 | 75 | 98.8 | 0.191 | |
| RF00171 | 180 | 159 | 67.3 | 11.4 | 34 | 97.9 | 0.403 | |
| RF00210 | 471 | 461 | 85.4 | 2.1 | 122 | 98.3 | 0.181 | |
| RF00458 | 208 | 201 | 55.4 | 3.5 | 60 | 95.0 | 0.757 | |
| RF01084 | 137 | 128 | 51.0 | 6.9 | 43 | 97.2 | 0.795 | |
| RF00373 | 533 | 311 | 49.4 | 41.7 | 87 | 90.0 | 0.537 |
| long data set | ||||
|---|---|---|---|---|
| TPR (%) | FPR (%) | PPV (%) | MCC (%) | |
| RNAfold | 46.30 | 0.0176 | 39.74 | 42.81 |
| RNAfold-A | 52.02 | 0.0160 | 44.76 | 48.17 |
| CoFold | 52.83 | 0.0159 | 45.79 | 49.10 |
| CoFold-A | 57.80 | 0.0145 | 50.06 | 53.70 |
| combined data set | ||||
| TPR (%) | FPR (%) | PPV (%) | MCC (%) | |
| RNAfold | 57.87 | 0.1132 | 45.27 | 50.86 |
| RNAfold-A | 58.98 | 0.1152 | 46.16 | 51.83 |
| CoFold | 60.38 | 0.1097 | 47.56 | 53.26 |
| CoFold-A | 61.51 | 0.1112 | 48.42 | 54.22 |
| short sequences only | ||||
| TPR (%) | FPR (%) | PPV (%) | MCC (%) | |
| RNAfold | 61.64 | 0.1444 | 47.08 | 53.48 |
| RNAfold-A | 61.25 | 0.1475 | 46.61 | 53.02 |
| CoFold | 62.84 | 0.1403 | 48.14 | 54.62 |
| CoFold-A | 62.72 | 0.1428 | 47.88 | 54.39 |
| Summary of % G distributions | |||||||||
|---|---|---|---|---|---|---|---|---|---|
| long data set | combined data set | ||||||||
| 1000 nt | all | 1000 nt | |||||||
| av. stdev | min | max | av. stdev | min | max | av. stdev | min | max | |
| RNAfold-A | 1.4 | 11.1 | -2.3 | 15.4 | -2.3 | 15.4 | |||
| CoFold | 0.2 | 4.4 | -5.0 | 4.4 | -5.0 | 3.8 | |||
| CoFold-A | 1.7 | 13.1 | -2.3 | 18.2 | -2.3 | 18.2 | |||
| Linear fit to MCC versus % G distributions | |||
|---|---|---|---|
| long data set | |||
| 1000 nt | |||
| intercept stdev | slope stdev | R2 (%) | |
| RNAfold-A | |||
| CoFold | |||
| CoFold-A | |||
| combined data set | |||
| intercept stdev | slope stdev | R2 (%) | |
| RNAfold-A | |||
| CoFold | |||
| CoFold-A | |||
| short sequences only | |||
| 1000 nt | |||
| intercept stdev | slope stdev | R2 (%) | |
| RNAfold-A | |||
| CoFold | |||
| CoFold-A | |||
Figures