IGR J18179-1621: An obscured X-ray pulsar discovered by
We report on all the and Swift data collected during the first outburst observed from IGR J18179-1621. The broad-band spectral analysis showed that the X-ray emission from the source is heavily absorbed (1023 cm-2), and well-described by a flat power-law with a high energy rollover (cutoff energy 9-12 keV, e-folding energy 4-7 keV). We found some evidence of a cyclotron absorption feature at keV. Together with the pulsations at 11.8 s discovered in the XRT data, this evidence would suggest that IGR J18179-1621 is an obscured, magnetized, accreting neutron star that is possibly part of a supergiant high-mass X-ray binary or a Be X-ray binary system.
Key Words.:
X-rays: binaries - stars: individual IGR J18179-1621 - stars: neutron - X-rays: stars1 Introduction
IGR J18179-1621 was discovered by the hard X-ray imager ISGRI on-board on 2012 February 29 (Türler et al. 2012). The estimated source flux in the 20-40 keV energy band was 161 mCrab, erg cm-2 s-1. Follow-up observations with Swift and Chandra permitted to obtain the refined position of the source at =18h17m5219 and =-1621′317 (error-circle radius of 0.6 at 90% confidence level), and led to the identification of the candidate infrared (IR) counterpart 2MASS J181752181621316 (Li et al. 2012; Paizis et al. 2012). The narrow-field instrument on-board Swift, XRT, also measured a high absorption column-density in the direction of the source (1023 cm-2) and detected pulsations in its X-ray emission at a period of 11.82 s (Türler et al. 2012; Halpern 2012), which was confirmed using FERMI/GBM (Finger & Wilson-Hodge 2012). This evidence suggested that IGR J18179-1621 is a highly obscured X-ray pulsar, possibly part of a high-mass X-ray binary system.
In this paper, we report on the analysis of all the /ISGRI and Swift /XRT target-of-opportunity observations we requested to be performed in the direction of IGR J18179-1621, and discuss different interpretations of the nature of the source.
2 Data analysis and results
2.1
IGR J18179-1621 was detected simultaneously by IBIS/ISGRI (15-500 keV, Ubertini et al. 2003; Lebrun et al. 2003) and JEM-X (3-25 keV, Lund et al. 2003) for the first time during satellite revolution 1145, and observed throughout revolutions 1146 and 1147 (from MJD 55 986.1 to MJD 55 992.5). Further observations were inhibited by a bright solar flare that forced the instrument on-board to enter in “safe-mode” with no scientific data available111See http://www.isdc.unige.ch/integral/operations/reports. A complete log of these observations is provided in Table 1.
| Rev. | START TIME | STOP TIME | ISGRI | JEM-X1 | JEM-X2 |
|---|---|---|---|---|---|
| (MJD) | (MJD) | (ks) | (ks) | (ks) | |
| 1145 | 55986.1 | 55987.8 | 55.6 | 23.7 | 23.1 |
| 1146 | 55988.9 | 55990.8 | 62.8 | 35.3 | 34.6 |
| 1147 | 55991.8 | 55992.5 | 37.4 | 21.8 | 20.9 |
| Note: A selection for source off-set angles has been applied, see Sect. 2.1. | |||||
All data were analyzed using version 9.0 of the OSA software distributed by the ISDC (Courvoisier et al. 2003). observations are commonly divided into “science windows” (SCWs), i.e. pointings with typical durations of 2-3 ks. Because of uncertainties in the instrument responses for high off-axis angles, we selected for the spectral analysis only those SCWs for which the off-set angle of the source was 3.5 deg and 12 deg, respectively, for JEM-X and ISGRI. The total effective exposure-time resulting after this selection is reported in Table 1. In all revolutions, the source was relatively faint for the JEM-X sensitivity, thus we performed a spectral extraction by using the option flag=1 in the local source catalog222This means that the source spectrum is extracted at the given catalog position even if the source is not detected within a single science window, see http://www.isdc.unige.ch/integral/download/osa/doc/current/osa_um _jemx/node40.html. We checked a posteriori that this did not affect the discussion on the main spectral results reported in Sect. 2.2. Owing to the relatively low signal-to-noise ratio (S/N) of the data, no meaningful timing analysis could be carried out.
2.2 Swift
Swift /XRT observations were performed from a few hours up to 22 days following the discovery of the source (29 Feb 2012– 22 Mar 2012, see Table 2). Swift /XRT data were collected only in photon-counting (PC) mode and analyzed by using standard procedures (Burrows et al. 2005). The XRT data were processed with the xrtpipeline (v.0.12.6) and the latest calibration files available (see also Bozzo et al. 2009). When required, we corrected PC data for pile-up, and used the xrtlccorr to account for this correction in the background-subtracted light curves. Source and background-event lists (time resolution 2.5 s) were barycentered by using the barycorr tool.
| OBSa | STARTb | STOPb | Exp | c | d | /d.o.f. | |
| (day) | (day) | (ks) | (C-stat/d.o.f.) | ||||
| 01 | 0.85 | 0.92 | 2.0 | 10.9 | 0.10.5 | 2.9 | 0.6/31 |
| 02 | 1.64 | 1.67 | 1.9 | 17.7 | 0.6 | 2.8 | 1.0/25 |
| 04 | 2.92 | 3.00 | 2.3 | 13.3 | 0.3 | 2.6 | 1.0/23 |
| 05 | 3.32 | 3.47 | 2.2 | 9.2 | 0 | 2.8 | 0.8/26 |
| 06 | 4.52 | 4.74 | 2.2 | 14.7 | 0.2 | 2.0 | 1.2/37 |
| 07 | 6.12 | 6.40 | 1.9 | 9.2 | 0 | 1.6 | 1.2/25 |
| 08 | 7.33 | 7.82 | 2.2 | 12.6 | 0 | 1.3 | 0.9/35 |
| 09 | 9.22 | 10.23 | 2.2 | 16.6 | 0.6 | 1.0 | 1.0/37 |
| 10 | 11.21 | 11.45 | 1.3 | 10.9 | 0.3 | 0.87 | 1.1/19 |
| 12 | 13.03 | 13.70 | 1.5 | 10.4 | 0.4 | 0.54 | 0.9/14 |
| 13 | 17.63 | 17.64 | 1.3 | 15.4 | 1.7 | 0.19 | (19.7/22) |
| 14 | 18.30 | 18.31 | 1.1 | 18.3 | 0.7 | 0.23 | (14.5/17) |
| 15-17e | 19.31 | 21.79 | 3.1 | 25.4 | 3.0 | 0.08 | (28.1/29) |
| Note: all data were fit with a simple absorbed power-law model. | |||||||
| a: Only the last two digits of the observation ID.000322930** are shown. | |||||||
| b: Start and stop times of the observations are from MJD 55 986, 29 Feb 2012. | |||||||
| c: The absorption column density is in units of 1022 cm-2. | |||||||
| d: The absorbed X-ray flux is in units of 10-10 erg cm-2 s-1 | |||||||
| e: Owing to the relatively low statistics, the three observations 15, 16, and 17 were | |||||||
| merged to allow for a meaningful spectral extraction. | |||||||

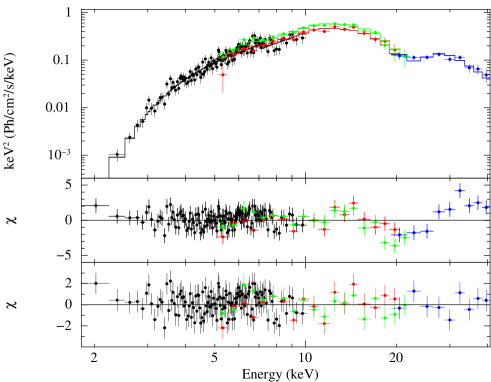
All XRT spectra were well-described by a power-law model with a relatively large absorption, 1023 cm-2 (we used the phabs model in Xspec12), and flat photon index (0; see Table 2). In order to obtain a better estimate of the source X-ray spectral properties, we performed a quasi-simultaneous fit of the XRT, JEM-X and ISGRI data. XRT observations from 00032293001 to 00032293006 were summed-up together to perform the quasi-simultaneous fit with the JEM-X and ISGRI data in revolutions 1145 and 1146, where the source displayed only a moderate change in the X-ray flux (we verified that no significant spectral variation occurred in the two revolutions by performing separate fits to the data). As the source flux during revolution 1147 is significantly lower than during the previous one, we performed a separate fit by combining the XRT spectrum obtained from the observation 00032293007 with the JEM-X and ISGRI spectra extracted during revolution 1147. The results of this analysis are shown in Fig. 5 and reported in Table 3.
Spectra from the first data-set (1145+1146) were fit first using a number of phenomenological models, including in all cases a normalization constant to take into account the systematic uncertainty in the inter-calibrations among the instruments and the possible variability of the source (the constant was fixed to 1 for XRT). A single absorbed power-law model failed to provide an acceptable fit to the spectra (3.5). The addition of a cut-off at the higher energies (highecut*pow in Xspec) significantly improved the fit (1.5), but left evident residuals above 10 keV (see Fig. 5). The widely used NPEX and Fermi-Dirac cut-off models (see e.g., Coburn et al. 2002) did not give a better fit () and left very similar residuals. We also tried the most widely used Comptonization models: BMC comprises black-body (BB) radiation up-scattered by a spherically symmetric in-falling plasma (Shrader & Titarchuk 1998) and provided a slightly better fit (=1.4). However, the temperature of the thermal seed photons was significantly higher (3 keV) than expected in the case of an accreting neutron star (0.8-1.5 keV; see e.g., Orlandini 2006). Similarly, a comptt model (Titarchuk 1994), which accounts for the thermal Comptonization of BB seed photons, was bounded to a temperature of the BB 2.5 keV. In all models, evident residuals were left above 10 keV. As suggested by the preliminary data analysis reported by Türler et al. (2012), the combination of a cut-off power-law model plus a cyclotron absorption line at 20 keV gave a reasonably good fit to the data. However, the cyclotron feature parameters could only be poorly constrained; we thus fixed the line width () to 3 keV, which is a reasonable value for an X-ray pulsar (see, e.g., Ferrigno et al. 2009, and Table 3). In revolution 1147, the S/N of the data was relatively low compared to data in revolutions 1145 and 1146, and the possible cyclotron feature was not formally required in the fit (an acceptable fit could be obtained by using an absorbed power-law model with a high energy cut-off, see Table 3). A further discussion of the interpretation of these results is given in Sect. 4.
| Rev. | a | /d.o.f. | ||||||||||||
| keV | keV | keV | keV | (10-10 erg cm-2 s-1) | ||||||||||
| 1145-6 | 14.0 | 0.50.2 | 11.00.8 | 6.2 | 21.9 | 3.0b | 8.1 | 1.2 | 1.00.1 | 1.30.1 | 2.6 | 6.5 | 1.2 | 1.0/173 |
| 1145-6N | 14.6 | 0.50.2 | 10.80.6 | 5.7 | — | — | — | 1.00.2 | 1.00.1 | 1.30.1 | 2.6 | 6.6 | 1.2 | 1.5/175 |
| 1147N | 11.1 | 0.10.6 | 10.6 | 4.8 | — | — | — | 0.8 | 1.4 | 1.4 | 1.6 | 5.5 | 0.6 | 1.1/40 |
| a: The is in units of 1022 cm-2. | ||||||||||||||
| b: This parameter was fixed (see text for details). | ||||||||||||||
| N: In these cases, no cyclotron feature was included in the fit. c Absorbed flux. | ||||||||||||||
We performed a detailed timing analysis of the XRT data. Pulsations were detected at a period of 11.82 s in all observations of a sufficiently long duration. In each of these observations, we measured the spin period by using statistics (Buccheri et al. 1983) and determined the associated uncertainty using a Monte-Carlo approach, where we simulated 1000 event files with the average modulation of the data and repeated the search on each of them. As detailed in the appendix, we estimate the reliability of the observation by setting a threshold confidence level (c.l.) at 99%. Only four observations were characterized by a sufficient high quality to permit a reliable determination of the spin period and its associated uncertainty. In the others, the spin period was determined at only a low confidence level and we were unable to reliably estimate the corresponding uncertainty (the folded lightcurve is reported for each observation in Fig. 2 to allow an easier comparison). For each XRT observation, we also computed the fractional root mean square (rms) and its uncertainty using the same Monte Carlo approach described above (we simulated 1000 pulse profiles for each observation, see Table 4). No significant variation in the rms with luminosity was found. All measurements are compatible with an rms value of 20%.
All the results of the timing analysis are summarized in Table 4, where we report the uncertainties associated with each spin-period measurement (1 c.l.) and a flag expressing the reliability of the measurement. Reliable periods from XRT, together with previous determinations from Fermi/GBM (see Sect. 1), are plotted in Fig. 3. The first two determinations (Observations 00032293001 and 00032293002) gave a value of the spin period compatible with that determined from the GBM data, whereas the spin-period values measured from observations 00032293004 and 00032293008 differed significantly from that. As discussed in Appendix A, the origin of this deviation cannot be firmly established at present, thus these two measurements should probably be taken with caution.
The XRT monitoring showed that the source began a relatively rapid decay in its X-ray flux after the initial brightening, and became fainter by a factor of 40 in about 22 days. On MJD 56007.78, the source was too faint to obtain meaningful spectral measurements with the available exposure times of the XRT pointings (1-2 ks), thus no further observations were performed.
| OBSa | START TIME | DURATION | Flagb | Fractional | |
| (MJD) | (days) | (sec) | rms | ||
| 01 | 55986.877 | 0.037 | 11.82300.0018 | Y | 0.200.03 |
| 02 | 55987.653 | 0.012 | 11.8190.006 | Y | 0.210.02 |
| 04c | 55988.957 | 0.040 | 11.79880.0016 | Y | 0.190.02 |
| 05 | 55989.395 | 0.074 | 11.7860 | N | 0.170.03 |
| 06 | 55990.632 | 0.110 | 11.8053 | N | 0.180.03 |
| 07 | 55992.261 | 0.139 | 11.8151 | N | 0.240.03 |
| 08c | 55993.572 | 0.247 | 11.82710.0003 | Y | 0.290.03 |
| 10 | 55997.219 | 0.008 | 11.81 | N | 0.250.04 |
| 12 | 55999.367 | 0.335 | 11.8447 | N | 0.310.05 |
| 15+16+17 | 56006.550 | 1.243 | 11.81 | N | 0.460.07 |
| a: Only the last two digits of the observation ID.000322930** are shown. | |||||
| b: The flag “Y” indicates a spin-period determination that is reliable | |||||
| at more than 99% c.l., “N” otherwise. | |||||
| c: To be considered with caution, see Appendix A. | |||||


3 Counterparts
The arcsecond localization of IGR J18179-1621 obtained first through the Swift observations and then refined with (see Sect. 1), permitted to search for possible associated counterparts to the source in the optical and IR domains. A search in the 2MASS catalog (Skrutskie et al. 2006) revealed that the object 2MASS is the most likely IR counterpart of the X-ray pulsar (see also Li et al. 2012; Paizis et al. 2012). We verified that the 2MASS object has been detected in K band with a magnitude of , while in the J and H bands only upper limits were reported (magnitudes of 16.7 and 15.9, respectively). No obvious counterpart could be found at the position of IGR J18179-1621 from the USNO B-1 catalog (Monet et al. 2003). At present, the lack of any detailed information in the J and H bands, combined with the unknown distance to the source, does not allow us to significantly constrain the nature of the companion to IGR J18179-1621.
4 Discussion and conclusions
IGR J18179-1621 was detected for the first time with during the period ranging from 55 986.1 MJD to 55 992.5 MJD, even though Fermi/GBM data indicated that the outburst of the source might have already started on 55977 MJD. A follow-up monitoring with XRT was initiated shortly after the discovery and continued until 56 007.8 MJD, measuring a decay in the source X-ray flux of a factor of 40 (from 2.910-10 erg cm-2 s-1to 810-12 erg cm-2 s-1) in 22 days. The detection of pulsations at 11.82 s with the GBM and XRT, led soon to classifying IGR J18179-1621 as an accreting X-ray pulsar (Halpern 2012).
The spectral analysis of all the available and Swift data collected during the outburst revealed that the X-ray emission from the source was heavily obscured. We estimated an absorption column density of about an order of magnitude higher than the Galactic value expected in that direction (1022 cm-2 Dickey & Lockman 1990). In the brightest phase of the outburst (from MJD 55 986.1 to MJD 55 990.8), the broad-band XRT/JEM-X/ISGRI spectrum could be well fit with a cut-off power-law model (, keV, keV), but some significant residuals were left above 10 keV. Following Türler et al. (2012), we showed in Sect 2.2 that the fit could be improved by adding a cyclotron absorption feature with a centroid energy at () keV. The feature was not significantly detected during the latest stages of the outburst (from MJD 55 991 onward), most likely owing to the relatively low S/N of the data. As the centroid energy of the line lies in the energy range in which the JEM-X and ISGRI instrument responses overlap, we caution that at present it is impossible to firmly exclude that some calibration uncertainties might have affected this detection. Future observations are thus needed to establish its presence. This feature would however not be unexpected in the case of an X-ray pulsar.
A hard spectrum with is sometimes observed from sources that display cyclotron lines (Coburn et al. 2002), and could be related to the effects of cyclotron scattering (Ferrigno et al. 2009).
Cyclotron resonant-scattering features (hereafter CRSFs) might also appear in the spectra of these objects in the form of absorption lines. The latter are caused by resonant scattering of photons off the electrons in Landau levels in the strong magnetic field of the neutron star (1011-1013 G). The centroid energy of the fundamental absorption feature is related to the strength of the magnetic field in the scattering region by the equation (see e.g., Wasserman & Shapiro 1983) 11.6/(1+z)(B/1012 G) keV, where is the magnetic field strength in gauss and +1=1.31 is the gravitational redshift (we used the canonical neutron-star mass and radius of 1.4 M☉ and 10 km, respectively). If the cyclotron feature is confirmed in the future, we will be able to infer for IGR J18179-1621 a magnetic field strength of 21012 G.
A similar magnetic field strength, associated with pulsations at 12 s, would make IGR J18179-1621 a likely Be X-ray binary candidate (hereafter BeXBs; see e.g. Reig 2011, for a review). According to this interpretation, the Corbet diagram (Corbet 1986) suggests for this source an orbital period in the range 20-50 days. Despite this apparently straightforward association, such a relatively short orbital period makes the interpretation of the event recorded by and Swift in terms of the so-called BeXB “type-I” outbursts challenging (see e.g., Reig 2011). As the latter occur almost regularly at each periastron passage in these systems, previous detections of IGR J18179-1621 should probably be expected during the long-term monitoring of the sky around the source performed so far with . By using the online tool HEAVENS333http://www.isdc.unige.ch/heavens/, we checked that the total effective exposure-time at the coordinates of IGR J18179-1621 is 2.4 Ms for ISGRI and 410 ks for JEM-X (considering all publicly available data from 2003 February 28 to 2010 March 1). A search in these archival data did not result in any previous significant detection of the source, and we derived a 5 upper limit to the source flux of 0.5 mCrab in the 17-40 keV energy band and 1.7 mCrab in the 3-10 keV energy band. The interpretation of the event recorded from IGR J18179-1621 as a rare BeXB type-II outburst (Stella et al. 1986), might also be questionable. The X-ray luminosity reached during these events is typically on the order of 1038 erg , and would thus imply an unrealistically large distance for IGR J18179-1621 (10 kpc, using the peak flux measured in Sect. 2.2). If the event reported here is the first episode of intense X-ray activity ever displayed by IGR J18179-1621, this source could be a further example of those “dormant” X-ray binaries that spent most of their time life in a quiescent state before suddenly changing into bursting X-ray sources (see e.g. the case of RX J0440.94431; Tsygankov et al. 2012; Usui et al. 2012).
At odds with typical BeXBs, IGR J18179-1621 appears to be characterized by a peculiar high absorption column-density. A value of 1023 cm-2 is more commonly observed in the so-called highly obscured high-mass X-ray binaries (HMXBs; see e.g. Chaty et al. 2010, for a review). A case of a highly absorbed HMXB displaying a cyclotron scattering feature is the persistent source GX 3012 (see Suchy et al. 2012, and references therein). In these sources, the neutron star is accreting matter from the intense wind of its massive companion giving rise to a fairly persistent X-ray luminosity in the range 1034-1036 erg s-1 (the exact value depends mainly on the strength of the wind and on the orbital separation between the supergiant and the neutron star). Bright short flares, lasting a few hours and reaching a peak flux 10-50 higher than the persistent emission, are sporadically observed from these objects and ascribed to episodes of accretion from high density “clumps” of stellar wind material (in’t Zand 2005; Bozzo et al. 2008; Kreykenbohm et al. 2008; Negueruela 2010; Bozzo et al. 2011). The dynamic range of the X-ray flux measured from IGR J18179-1621 (taking into account the upper limit derived above), might thus still be marginally compatible with that measured for the highly obscured HMXBs, although the scale time of the outburst decay inferred from the Swift monitoring (22 days) seems hardly reconcilable with that expected for an episode of clumpy wind accretion.
Even though some of the results from the timing analysis of the XRT data have to be interpreted with caution (see A), in Sect. 2 we reported the possible detection of a spin-period variation from the source. If this is interpreted in terms of an accretion torque, the average spin-up and spin-down rates inferred from a linear fit to the measurements before and after MJD 55 989.13 (see Fig. 3) would be on the order of s/s, i.e. compatible with those measured in a number of accreting high-mass X-ray binaries (Bildsten et al. 1997; Ferrigno et al. 2007, see also the case of GX 1-4). We note that similar changes in the spin period of the source might also be due to the orbital modulation, but the limited number of currently available estimates of do not allow us to investigate further this possibility. Future observations of the source in outburst are needed to strengthen and confirm any detection of spin-period variations in IGR J18179-1621.
As an alternative interpretation, we also suggest that IGR J18179-1621 might be another example of those peculiar binaries displaying a complex X-ray variability with intermediate properties in-between those of young wind-accreting systems and more evolved disk accretors. The latter can display prolonged periods of quiescence and undergo moderate to bright outbursts owing to instabilities in the accretion disk (see e.g., Lasota 2001, and references therein). Among the known peculiar disk-accreting systems, a particularly relevant case here is Her X-1, which is also known to display a cyclotron absorption line at 40 keV (see e.g., Vasco et al. 2011, and references therein). Spectroscopic observations of IGR J18179-1621 in other energy domains (e.g. IR) might help in clarifying the nature of its companion star and unveil the real nature of the mechanism regulating the X-ray variability displayed by this new transient.
Acknowledgements.
We thank the Swift team for the prompt scheduling of all the follow-up observations performed after the discovery of IGR J18179-1621. We acknowledge P. Kretschmar and an anonymous referee for carefully reading the manuscript and giving valuable comments.References
- Bildsten et al. (1997) Bildsten, L., Chakrabarty, D., Chiu, J., et al. 1997, ApJS, 113, 367
- Bozzo et al. (2008) Bozzo, E., Falanga, M., & Stella, L. 2008, ApJ, 683, 1031
- Bozzo et al. (2011) Bozzo, E., Ferrigno, C., Falanga, M., & Walter, R. 2011, A&A, 531, A65
- Bozzo et al. (2009) Bozzo, E., Giunta, A., Stella, L., et al. 2009, A&A, 502, 21
- Buccheri et al. (1983) Buccheri, R., Bennett, K., Bignami, G. F., et al. 1983, A&A, 128, 245
- Burrows et al. (2005) Burrows, D. N., Hill, J. E., Nousek, J. A., et al. 2005, Space Sci. Rev., 120, 165
- Chaty et al. (2010) Chaty, S., Zurita Heras, J. A., & Bodaghee, A. 2010, in Proceedings of the 8th INTEGRAL Workshop ”The Restless Gamma-ray Universe” (INTEGRAL 2010). September 27-30 2010. Dublin Castle, Dublin, Ireland.
- Coburn et al. (2002) Coburn, W., Heindl, W. A., Rothschild, R. E., et al. 2002, ApJ, 580, 394
- Corbet (1986) Corbet, R. H. D. 1986, MNRAS, 220, 1047
- Courvoisier et al. (2003) Courvoisier, T., Walter, R., Beckmann, V., et al. 2003, A&A, 411, L53
- Dickey & Lockman (1990) Dickey, J. M. & Lockman, F. J. 1990, ARA&A, 28, 215
- Ferrigno et al. (2009) Ferrigno, C., Becker, P. A., Segreto, A., Mineo, T., & Santangelo, A. 2009, A&A, 498, 825
- Ferrigno et al. (2007) Ferrigno, C., Segreto, A., Santangelo, A., et al. 2007, A&A, 462, 995
- Finger & Wilson-Hodge (2012) Finger, M. H. & Wilson-Hodge, C. A. 2012, The Astronomer’s Telegram
- Halpern (2012) Halpern, J. P. 2012, The Astronomer’s Telegram, 3949
- in’t Zand (2005) in’t Zand, J. J. M. 2005, A&A, 441, L1
- Kreykenbohm et al. (2008) Kreykenbohm, I., Wilms, J., Kretschmar, P., et al. 2008, A&A, 492, 511
- Lasota (2001) Lasota, J.-P. 2001, New A Rev., 45, 449
- Lebrun et al. (2003) Lebrun, F., Leray, J. P., Lavocat, P., et al. 2003, A&A, 411, L141
- Li et al. (2012) Li, J., Zhang, S., Chen, Y. P., et al. 2012, The Astronomer’s Telegram, 3950
- Lund et al. (2003) Lund, N., Budtz-Jørgensen, C., Westergaard, N. J., et al. 2003, A&A, 411, L231
- Monet et al. (2003) Monet, D. G., Levine, S. E., Canzian, B., et al. 2003, AJ, 125, 984
- Negueruela (2010) Negueruela, I. 2010, in Astronomical Society of the Pacific Conference Series, Vol. 422, High Energy Phenomena in Massive Stars, ed. J. Martí, P. L. Luque-Escamilla, & J. A. Combi, 57
- Orlandini (2006) Orlandini, M. 2006, Advances in Space Research, 38, 2742
- Paizis et al. (2012) Paizis, A., Nowak, M., Rodriguez, J., et al. 2012, The Astronomer’s Telegram, 3988
- Reig (2011) Reig, P. 2011, Ap&SS, 4
- Sheskin (2007) Sheskin, D. J. 2007, in Handbook of Parametric and Nonparametric Statistical Procedures: Fourth Edition, 197–198
- Shrader & Titarchuk (1998) Shrader, C. & Titarchuk, L. 1998, ApJL, 499, L31
- Skrutskie et al. (2006) Skrutskie, M. F., Cutri, R. M., Stiening, R., et al. 2006, AJ, 131, 1163
- Stella et al. (1986) Stella, L., White, N. E., & Rosner, R. 1986, ApJ, 308, 669
- Suchy et al. (2012) Suchy, S., Fürst, F., Pottschmidt, K., et al. 2012, ApJ, 745, 124
- Titarchuk (1994) Titarchuk, L. 1994, ApJ, 434, 570
- Tsygankov et al. (2012) Tsygankov, S. S., Krivonos, R. A., & Lutovinov, A. A. 2012, MNRAS, 421, 2407
- Türler et al. (2012) Türler, M., Chenevez, J., Bozzo, E., et al. 2012, The Astronomer’s Telegram, 3947
- Ubertini et al. (2003) Ubertini, P., Lebrun, F., Di Cocco, G., et al. 2003, A&A, 411, L131
- Usui et al. (2012) Usui, R., Morii, M., Kawai, N., et al. 2012, ArXiv e-prints/1201.6491
- Vasco et al. (2011) Vasco, D., Klochkov, D., & Staubert, R. 2011, A&A, 532, A99
- Wasserman & Shapiro (1983) Wasserman, I. & Shapiro, S. L. 1983, ApJ, 265, 1036
Appendix A Spin-period determination
The uncertainty and the significance of the pulse period derived using the statistics in each of the XRT observations reported in Sect. 2.2, could be reliably estimated only by performing Monte Carlo simulations, as the individual determinations obtained by scanning frequencies from a single event file are not independent. Furthermore, we verified that the formal significance of the peak is not a good estimate of the reliability of the measurement for the Swift observations. The latter comprise several relatively short (1 ks) snapshots containing only a few hundreds photons each and, as a result, the corresponding periodogram has the shape of a wide-peak (the diffraction figure of the window function) with evident interference fringes produced by the fragmentation of the observations (see Fig. 6).


To perform the Monte Carlo simulations, we determined in each observation the best pulse period and approximated the corresponding pulse profile by using its first two Fourier components (a check was performed a posteriori to verify that this description is accurate in each case by inspecting the single pulse profiles; see Fig. 2). Event files with an average event rate equal to that measured from the source were then simulated in the good time intervals (GTIs) of the observations by introducing two sinusoidal modulations at the estimated spin period and its first harmonic. The amplitudes of the modulations were assumed to be the same as those measured from the Fourier decomposition of the real source pulse profiles. In each of the simulated event files, the pulse period was then measured with the -statistics method and recorded. We report the results of this analysis in Fig. 7.
The spin periods determined from the simulated files cluster around the real value measured in the corresponding observations and follow roughly a Gaussian distribution. The shape of the Gaussian could in principle be used to estimate in each case the uncertainty in the spin-period determination, but this procedure is complicated in all cases by a certain number of ”outliers”. The number of these points, whose ”wrong” value of the spin period is due to the sporadic displacement of the peak in the -statistics periodogram at the moment of the best period determination, is larger for shorter observations and observations characterized by a smaller number of source events. In Bozzo et al. (2011), we argued that the number of outliers with respect to the total number of measurements could give an estimate of the reliability (significance) of the spin-period detection in an observation.
To identify the outliers in the present case, we: (i) collected all the spin periods determined from the 90% of the simulations that gave periods closer to those measured from the real data (”central spin periods”), (ii) estimated the average spin period and the variance of the corresponding Gaussian distribution, and (iii) identified all the remaining realizations that gave a spin period differing by more that 2.6 from the averaged one. We rejected as ”not-reliable” the XRT observations in which the number of outliers were found to significantly exceed (99% c.l., taking into account also the intrinsic uncertainty in and the Poissonian nature of the key variables; see e.g., Sheskin 2007) the value expected from the Gaussian distribution of the simulated central spin periods.
As a final remark, we note that, in all cases, the timing analysis was performed on XRT event files that were uncorrected for pile-up (see sect. 2), as the latter is known to affect mostly the spectral energy distribution of photons recorded from the source444See http://www.swift.ac.uk/analysis/xrt/pileup.php. We checked a posteriori that an analysis similar to that described above performed on the pile-up corrected XRT event files of the reliable spin-period determinations in observations 00032293001 and 00032293002 would give values fully in agreement (to within the uncertainties) with those reported in Table 4. For the observations 00032293004 and 00032293008, the lower flux and/or number of counts led, in contrast to an unreliable spin-period determination once the corresponding data are corrected for pile-up. As the effect of pile-up on these observations cannot be checked further owing to the limited statistics, the corresponding values of the spin periods reported in Table 4 should be interpreted with caution.