The impact of baryons on the spins and shapes of dark matter haloes
Abstract
We use numerical simulations to investigate how the statistical properties of dark matter (DM) haloes are affected by the baryonic processes associated with galaxy formation. We focus on how these processes influence the spin and shape of a large number of DM haloes covering a wide range of mass scales, from galaxies to clusters at redshifts zero and one, extending to dwarf galaxies at redshift two. The haloes are extracted from the OverWhelmingly Large Simulations (OWLS), a suite of state-of-the-art high-resolution cosmological simulations run with a range of feedback prescriptions. We find that the median spin parameter in DM-only simulations is independent of mass, redshift and cosmology. At baryons increase the spin of the DM in the central region () by up to 30 per cent when feedback is weak or absent. This increase can be attributed to the transfer of angular momentum from baryons to the DM, but is no longer present at . We also present fits to the mass dependence of the DM halo shape at both low and high redshift. At the sphericity (triaxiality) is negatively (positively) correlated with halo mass and both results are independent of cosmology. Interestingly, these mass-dependent trends are markedly weaker at . While the cooling of baryons acts to make the overall DM halo more spherical, stronger feedback prescriptions (e.g. from active galactic nuclei) tend to reduce the impact of baryons by reducing the central halo mass concentration. More generally, we demonstrate a strongly positive (negative) correlation between halo sphericity (triaxiality) and galaxy formation efficiency, with the latter measured using the central halo baryon fraction. In conclusion, our results suggest that the effects of baryons on the DM halo spin and shape are minor when the effects of cooling are mitigated, as required by realistic models of galaxy formation, although they remain significant for the inner halo.
keywords:
methods: numerical - galaxies: clusters: general - galaxies: evolution - galaxies:haloes - cosmology: theory1 Introduction
A natural consequence of the standard hierarchical structure formation paradigm is that the shapes of dark matter haloes are triaxial, a property that is inherited from their progenitor density perturbations (Bardeen et al., 1986). This additionally leads to aspherical growth as the halo accretes matter from preferential directions, associated with the surrounding sheets and filaments. The anisotropic accretion history of a halo also affects its angular momentum distribution, through the presence of non-zero torques. It is therefore clear that both the shape and spin of a dark matter halo are important diagnostics for an accurate determination of their structure and formation history.
While the spin and shape of a dark matter halo are not directly observable, they have important consequences for the structure and dynamics of galaxies. For example, halo spin is an important parameter in galaxy formation models as it affects the size of the embedded galactic disc (e.g. Mo et al. 1998, but see Sales et al. 2012). Deviations from axisymmetry in elliptical galaxies are likely to influence the gas kinematics of the system (de Zeeuw & Franx, 1989), and may be responsible for exciting or sustaining warps and stabilising or deforming polar rings (Steiman-Cameron et al., 1992). Axisymmetry may also influence the fuelling efficiency of the central black hole (Franx et al., 1991). Misalignment of the angular momentum of the halo and the galaxy may be responsible for the anisotropic distribution of subhaloes and satellite galaxies (Holmberg 1969; Knebe et al. 2004; Kang et al. 2005; Libeskind et al. 2005; Zentner et al. 2005; Libeskind et al. 2007; Knebe et al. 2010) and could cause galactic warps (Ostriker & Binney 1989; Debattista & Sellwood 1999; Bailin & Steinmetz 2004).
On cluster scales, asphericity in the dark matter halo will naturally correspond to asphericity in the gas density and will impact the shape of X-ray isophotes and the Sunyaev-Zel’dovich signal. Understanding the intrinsic shape of dark matter haloes is also important for weak lensing analysis (see, for example, the discussions in Becker & Kravtsov 2011; Bett 2012) and it is well known that intrinsic ellipticity can contribute significantly to a lensing halo’s ability to form arcs (Oguri et al., 2003).
Several methods are used to constrain galaxy and halo shapes observationally (see, for example, Sackett 1999; Merrifield 2004). Unfortunately studies performed to date do not yet reveal a consistent picture (see the discussion in O’Brien et al. 2010). The observations cover a large range of systems and vary in the extent to which the halo is probed, making a direct comparison somewhat difficult. Whether the discrepancies result from halo-to-halo scatter or from systematic errors in the observed estimates is unclear. However, given the rapidly accumulating number of data sets, ever increasing sophistication of the data analysis tools and the development of more realistic mock observations from simulations, one can soon expect the situation to change substantially.
Theoretically, the predictions for the distribution of angular momentum and halo shapes have been studied extensively, primarily using cosmological -body simulations (Frenk et al. 1988; Dubinski & Carlberg 1991; Warren et al. 1992; Cole & Lacey 1996; Bullock 2002; Jing & Suto 2002; Bailin & Steinmetz 2005; Allgood et al. 2006; Bett et al. 2007; Macciò et al. 2008; Jeeson-Daniel et al. 2011; Vera-Ciro et al. 2011; Bett 2012; Zemp et al. 2012). There is a general consensus that cold dark matter haloes have approximately log-normal spin distributions and are triaxial, with sphericities, 111Where are the eigenvalues of the halo’s inertia tensor. and elongations, . Furthermore, haloes are generally found to be highly flattened and show a tendency toward prolate shapes , especially in the inner regions. There is also general agreement that the sphericity decreases with increasing halo mass and that the spin is independent of mass (Bullock 2002; Jing & Suto 2002; Springel et al. 2004; Hopkins et al. 2005; Bett et al. 2007; Macciò et al. 2008; Jeeson-Daniel et al. 2011). In addition, Jeeson-Daniel et al. (2011) have shown that sphericity is strongly correlated with concentration, while both triaxiality and spin are anti-correlated with concentration.
While these results are interesting, a significant uncertainty is how the dark matter halo is affected by the additional, non-gravitational processes acting on the baryons. Recent work has clearly established that the condensation of baryons to the centre of dark matter haloes tends to increase the central angular momentum of the halo (see for example, Sharma & Steinmetz 2005; Tonini et al. 2006a; Kaufmann et al. 2007; Abadi et al. 2010; Bett et al. 2010) and to make the halo more spherical or axisymmetric (see, for example, Katz & Gunn 1991; Dubinski 1994; Evrard et al. 1994; Barnes & Hernquist 1996; Tissera & Dominguez-Tenreiro 1998; Springel et al. 2004; Kazantzidis et al. 2004; Debattista et al. 2008; Pedrosa et al. 2010; Tissera et al. 2010; Bryan et al. 2012; Zemp et al. 2012). This result has been used to explain the discrepancy between the strongly-prolate triaxial shape found in -body simulations and the more spherical central regions of observed systems.
Incorporating baryonic physics in cosmological simulations is a non-trivial task and the computational cost of this process has placed limits on both the parameter space and the size of the sample of haloes explored to date. The detailed nature of the baryonic processes involved in galaxy formation and the precise influence of these processes on galaxies therefore remains largely uncertain. In this paper, we attempt to make progress on both fronts, by studying the spin and shape distributions for a large () sample of dark matter haloes, spanning a range of mass (from dwarf galaxies to clusters) and redshift ( and ). We do this using the OverWhelmingly Large Simulations (OWLS; Schaye et al. 2010) – a suite of cosmological hydrodynamical simulations run with many different physical prescriptions for the baryons. By providing identical simulations run with different implementations of the subgrid physics, OWLS offers the opportunity to explore the effects of baryons under a range of physical conditions, for the same population of haloes. In particular, we use the OWLS data to quantify, in a statistically meaningful way, the influence of feedback processes (from no feedback, to feedback from stars and black holes) on the spin and shape distributions of dark matter haloes.
The paper is organised as follows. The simulations used in this analysis, and the methods used to identify haloes and to estimate their spins and shapes are outlined in section 2. Our results are presented in section 3, including fitting formulae for the predicted correlations between halo shape and mass. The robustness of our results is demonstrated via a resolution study, given in the appendix. Finally, we summarise our main results in section 4.
2 Methodology
2.1 Simulation details
| Name | Description | Box length | |||
| ( Mpc) | |||||
| DMONLY | Dark matter only runs | ||||
| WMAP 1 | - | ||||
| WMAP 3 | - | () | |||
| WMAP 3 | - | ||||
| WMAP 5 | - | () | |||
| WMAP 5 | - | ||||
| NOSN_NOZCOOL | No feedback, primordial abundances for cooling | () | |||
| REF | Weak stellar feedback, metal cooling | () | |||
| WDENS | Strong stellar feedback, metal cooling | () | |||
| AGN | Weak stellar & AGN feedback, metal cooling | () |
The haloes used for this analysis were extracted from a subset of the OWLS runs. For detailed information about these simulations the reader is referred to Schaye et al. (2010); here, the most relevant aspects are briefly reviewed for convenience.
For all runs, cosmological initial conditions were set up using a transfer function generated with cmbfast (Seljak & Zaldarriaga, 1996). Initial () positions and velocities were computed using the Zel’dovich (1970) approximation from an initial glass-like state (White, 1996). All simulations were run using a modified version of GADGET-3 (Springel, 2005). For a given box size the same initial conditions were used in each run, allowing us to directly compare the same haloes evolved using different prescriptions for the sub-grid physics. A summary of the simulations used in this analysis, including values for key numerical parameters, can be found in Table 1.
We begin by exploring dark matter only (DMONLY) simulations, as this allows us to validate our results by comparing to the existing literature, as well as to set the scene for exploring the impact of baryons. We consider three sets of dark matter only simulations, each run with different values for the cosmological parameters. Our main results (including baryons) assume values taken from the 3rd year Wilkinson Microwave Anisotropy Probe data (WMAP 3; Spergel et al. 2007) with ,. This model was run with dark matter only, using particles in three box sizes. The two larger boxes ( and ) were run to while a smaller, high-resolution box () was run to ; we use the latter to study the properties of haloes at high redshift. The comoving softening length was set to of the initial mean interparticle spacing until ; below this redshift the softening was held fixed in proper units. The maximum physical softening length in the box was 0.5 , while in the and it was 4 and 16 times larger respectively. We also present results for the newer WMAP 5 cosmology (Komatsu et al. 2009) with , using the same boxes as before. Finally, we consider a run with the WMAP 1 cosmology (Spergel et al., 2003) with ,. This simulation was run using particles in a 50 Mpc box, matching the resolution of the Millennium Simulation (Springel et al. 2005), which was also run with the WMAP 1 parameters.
To study the effect of varying levels of feedback on the spin and shape parameters of haloes extracted from CDM simulations, four baryon runs from the OWLS simulations are considered, all run with the WMAP 3 cosmology. These runs model the gaseous component using smoothed particle hydrodynamics (SPH).
All of the simulations include radiative cooling (Wiersma et al. 2009a), star formation (Schaye & Dalla Vecchia 2008) and metal enrichment (Wiersma et al. 2009b), but differ in their feedback prescriptions (for more details see Dalla Vecchia & Schaye 2008). All models followed the timed release of H, He and 9 different heavy elements produced by massive stars, AGB stars and supernovae of type I and II (Wiersma et al. 2009b) The first run (NOSN_NOZCOOL) did not include any feedback processes222This simulation also neglects enhanced cooling through metal-lines.; the second (REF) includes weak feedback from stellar winds and supernovae; the third (WDENS) includes stronger stellar feedback with a wind-speed that depends on the local gas density; and the final run (AGN), feedback from both stars and active galactic nuclei (Booth & Schaye 2009). In the feedback models, enhanced cooling from metal lines was also accounted for. All four models were run using the box (to ) and the box (to ). The same number of gas particles as dark matter particles () was adopted for each box.
2.2 Halo sample
Haloes were extracted from each simulation using the Friends-of-Friends (FoF) algorithm (Davis et al., 1985) which links particles together within a fixed comoving separation. This separation, known as the linking length, was set to 0.2 times the mean inter-particle distance. The FoF groups were then decomposed into self-bound sub-haloes using the subfind algorithm (Springel et al., 2001; Dolag et al., 2008). Finally, a sphere was grown around the most bound particle of the most massive sub-halo until the mean total mass density was equal to 200 times the critical density. We choose to define our haloes as including all particles contained within this sphere. The mass and radius of the halo are referred to as and respectively.
Only haloes that contain at least 1000 particles are considered in this analysis, as this ensures that the results are fully converged (see the appendix for a discussion of the effects of resolution). While estimates of the spin parameter are found to be well resolved for haloes with more than 300 particles (as in Bett et al. 2007) a larger number of particles is required to resolve the halo shape (in particular the triaxiality of the halo), in agreement with Macciò et al. (2008). This cut imposes a minimum halo mass of at and at , for our WMAP 3 runs.
We have investigated whether our results are affected by restricting our sample to dynamically relaxed haloes. We estimated the dynamical state using the centroid shift, defined to be the distance between the minimum potential position (the halo centre) and the centre of mass of the halo. In accordance with Neto et al. (2007), a halo is defined to be relaxed if the centroid shift is less than . We find that while relaxed haloes are typically more spherical and less triaxial, this restriction does not affect the trends found in this work and so we chose to present our analysis for the total halo sample (except where explicitly stated otherwise). Not only does this result in larger numbers of objects, our choice is also motivated by the fact that an observational cut based on the relaxation state of a halo is not a straightforward task.
| Simulation | ||||||
|---|---|---|---|---|---|---|
| DMONLY WMAP 1 | 431 | 1.7 | - | - | - | - |
| DMONLY WMAP 3 | 7094 | 2.3 | 3765 | 0.77 | 5334 | 0.030 |
| DMONLY WMAP 5 | 8188 | 3.6 | - | - | - | - |
| AGN | 3878 | 0.88 | 3375 | 0.83 | 4743 | 0.033 |
| WDENS | 3884 | 0.91 | 3371 | 0.84 | 4699 | 0.035 |
| REF | 3990 | 0.99 | 3580 | 0.93 | 4823 | 0.044 |
| NOSN_NOZCOOL | 4634 | 1.0 | 4041 | 0.91 | 5683 | 0.040 |
The numbers of haloes in our final samples are presented in Table 2. Note that the number of haloes in DMONLY WMAP 3 at is almost twice as large as in the baryon runs; this is due to the inclusion of haloes from the box in the former case. Overall, our DMONLY sample spans around three orders of magnitude in mass (from galaxy to cluster scales, i.e. ) at . Our sample covers a similar dynamic range but at lower mass (dwarf galaxy to group scales, ).
2.3 Defining halo spin and shape
The dimensionless spin parameter provides a useful measure of the amount of rotational support present within a dark matter halo. We estimate this property for the dark matter particles using the modified expression given by Bullock et al. (2001)
| (1) |
where is the angular momentum of the DM within a sphere of radius , containing mass and is the halo circular velocity at this radius. This expression reduces to the standard spin parameter (Peebles 1969) when measured at the virial radius of a truncated singular isothermal halo. For a comparison of the different definitions for the spin parameter, see Macciò et al. (2007); hereafter we drop the prime and refer to the modified spin parameter as .
To characterise the halo shape, we use the mass distribution tensor which has been used extensively in the halo shape literature (e.g. Cole & Lacey 1996; Bailin & Steinmetz 2005). The components of the tensor (a square matrix) are
| (2) |
where the index runs over all dark matter particles within a given radius, is the mass of the th particle and the th component of its position vector from the halo centre. The square roots of the eigenvalues of the mass distribution tensor, obtained using Jacobi transformations, are defined as (where ) and are used to measure the shape of the simulated haloes. Note that the shapes obtained using the inertia tensor and the mass distribution tensor are equivalent (Bett et al. 2007).
Our shape results are presented using the following parameters: is used as a measure of halo sphericity; as a measure of elongation; and as a measure of the triaxiality of the halo. A purely spherical halo will have with being undefined. Low values of () correspond to oblate haloes while high values () correspond to prolate haloes.
We note that computation of the mass tensor in a spherical region biases the shape towards higher sphericity; this is corrected for, as suggested in Bailin & Steinmetz 2005, by re-scaling the axis ratios and . While our adopted method described above may not be the most robust way of describing the physical halo shape (e.g. see the discussion in Zemp et al. 2011), we follow Bett (2012) and use this simple approach as it is most directly comparable with observations and is adequate for the comparison we wish to present here. We checked that using the reduced mass distribution tensor, and also using an iterative technique to determine the halo shapes, do not result in systematically different results.
Our main results for spin and shape parameters are presented for the dark matter within , but we also consider results within the central region () where baryonic physics plays a more significant role. The convergence radius (see Power et al. 2003) is less than for almost all of the haloes considered here. (The haloes that are not converged within are excluded from the studies of the central region. In all cases this is less than one per cent of the sample). Resolution tests for this region are discussed in the appendix.
3 Results
We begin by presenting our results for the halo spin parameter, then go on to explore the shapes of a large number of haloes selected from our cosmological sample. In both cases, we first discuss the results from dark matter only simulations before studying the impact of the baryons. Quantities are measured within the central region () and at .
3.1 Halo Spin
 |
 |
 |
 |
| Within | Within | |||||||
|---|---|---|---|---|---|---|---|---|
| Simulation | skew | skew | ||||||
| DMONLY WMAP 1 | -3.41 | -3.38 | 0.60 | -0.47 | -3.50 | -3.51 | 0.63 | -0.19 |
| DMONLY WMAP 3 | -3.34 | -3.29 | 0.62 | -0.49 | -3.34 | -3.31 | 0.62 | -0.36 |
| DMONLY WMAP 5 | -3.33 | -3.30 | 0.62 | -0.46 | -3.37 | -3.33 | 0.63 | -0.40 |
| AGN | -3.33 | -3.28 | 0.60 | -0.50 | -3.36 | -3.32 | 0.63 | -0.49 |
| WDENS | -3.32 | -3.27 | 0.60 | -0.58 | -3.34 | -3.29 | 0.62 | -0.46 |
| REF | -3.33 | -3.28 | 0.61 | -0.62 | -3.29 | -3.23 | 0.61 | -0.54 |
| NOSN_NOZCOOL | -3.29 | -3.24 | 0.61 | -0.65 | -3.12 | -3.05 | 0.60 | -0.69 |
| DMONLY WMAP 3 | -3.26 | -3.22 | 0.62 | -0.62 | -3.18 | -3.14 | 0.60 | -0.34 |
| AGN | -3.30 | -3.24 | 0.59 | -0.51 | -3.22 | -3.16 | 0.60 | -0.50 |
| WDENS | -3.30 | -3.26 | 0.60 | -0.58 | -3.24 | -3.20 | 0.61 | -0.52 |
| REF | -3.32 | -3.27 | 0.61 | -0.63 | -3.21 | -3.17 | 0.58 | -0.41 |
| NOSN_NOZCOOL | -3.31 | -3.25 | 0.59 | -0.56 | -3.12 | -3.08 | 0.57 | -0.57 |
| DMONLY WMAP 3 | -3.26 | -3.22 | 0.60 | -0.54 | -3.10 | -3.07 | 0.60 | -0.40 |
| AGN | -3.31 | -3.27 | 0.58 | -0.47 | -3.17 | -3.12 | 0.59 | -0.55 |
| WDENS | -3.31 | -3.26 | 0.59 | -0.54 | -3.19 | -3.16 | 0.58 | -0.49 |
| REF | -3.32 | -3.28 | 0.59 | -0.53 | -3.20 | -3.15 | 0.59 | -0.54 |
| NOSN_NOZCOOL | -3.35 | -3.32 | 0.59 | -0.62 | -3.16 | -3.11 | 0.59 | -0.71 |
3.1.1 Dark Matter Simulations
The distribution of dark matter halo spin is typically found to be well characterised by a log-normal distribution 333Although we note that a more accurate fitting formula for the distribution of halo spins is presented in Bett et al. (2007).
| (3) |
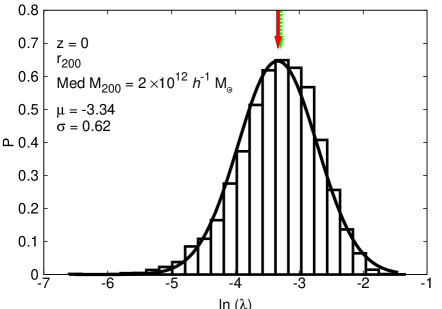
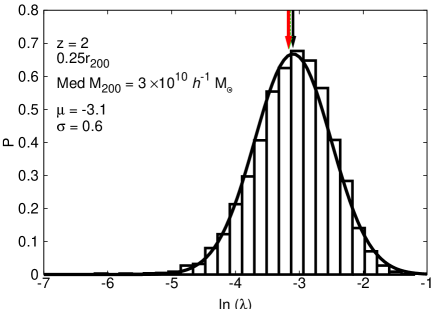
where and are free parameters, determining the mean and standard deviation respectively. We confirm this result in Fig. 1, where the distribution from the DMONLYWMAP 3 haloes is shown as a histogram. Values for the mean and standard deviation of the sample are also given, and are used together with Equation 3, to predict the equivalent log-normal spin distribution (shown as the solid curve). The left panels show the results for haloes at while results for the haloes are presented in the right panels. Top panels correspond to spin parameters computed using all dark matter particles within , while the bottom panels are for the inner region (). Table 3 lists values for the mean, standard deviation, median and skewness of for all runs, and at and 2.
At we find ) = (or ) and , for our DMONLYWMAP 3 run, when all dark matter particles within are considered. These values are in good agreement with those found in previous analyses such as Bullock et al. (2001), who obtained best-fit values of and ; Bailin & Steinmetz (2005), who measured and ; and Macciò et al. (2008), who found a mean value of and . Our median spin parameter () is also in good agreement with the analysis of Bett et al. (2007), who found (depending on the definition of the halo). The spin parameters of the higher redshift ( and 2) samples are found to be slightly higher than those at . For example, at , the mean spin parameter of the DMONLYWMAP 3 haloes is , around 8 per cent higher. At least part of this (statistically significant) shift can be explained by a very weak dependence of spin with halo mass (see below and Muñoz-Cuartas et al. 2011), given that the mean mass of our haloes at is lower than at .
We also checked whether excluding unrelaxed haloes (centroid shift ) from our sample made any difference to our results, as Macciò et al. (2006) found that this reduced the mean spin parameter by per cent and Jeeson-Daniel et al. (2011) found that spin correlates with the relaxedness of the halo444A low value of relaxedness corresponds to a relaxed halo. (they demonstrated that this is due to the strong anti-correlation of both spin and relaxedness with concentration). Our results are broadly in agreement: at we find a reduction in of around 12 per cent while at , this increases to 17 per cent.
At , we find that the inner region (, shown in the bottom left panel of Fig. 1) is characterised by nearly the same distribution as the overall halo. However, this does not hold at (bottom right panel) where we find that the mean spin parameter is significantly higher ( = ) than that of the whole halo ( = ). Interestingly, this difference is even stronger for the relaxed sample at , where the inner region of the relaxed dark matter haloes exhibits a mean spin, while the mean spin computed over the whole halo is found to be . The difference is likely due to the increased merger rate at . The lower mass haloes at are strongly affected by frequent mergers. Subhaloes transfer their angular momentum to the inner region as they fall into the centre of the halo. After a major merger the inner part of the halo loses angular momentum to the outer part of the halo due to dynamical friction (inside-out transfer of angular momentum) as discussed in Sharma et al. (2012).
 |
 |
 |
 |
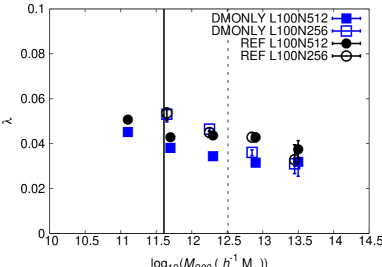
We have also considered the effects of cosmology on the spin parameter distribution of dark matter haloes, comparing the spin distributions from dark matter only simulations run with the WMAP 1, WMAP 3 and WMAP 5 cosmological parameters at . The mean, median, standard deviation and skewness for the distributions of the log of the spin parameters are also listed in Table 3. It is evident from this table (as in Macciò et al. 2008) that the spin distribution is not sensitive to the exact choice of cosmological parameters. We note that the largest change in the models we have considered is the value of , which varies from 0.7 in WMAP 3 to 0.9 in WMAP 1. Haloes in a lower cosmology are expected to form later and be less concentrated than those in a higher cosmology (Navarro et al. 1997). The spin distribution itself remains almost unchanged for the range of parameters explored here, although we note a slight decrease in the spin parameter for the WMAP 1 haloes, consistent with the anti-correlation of spin with concentration (as discussed in Macciò et al. 2008 and Jeeson-Daniel et al. 2011). Haloes formed in this cosmology are expected to have the highest concentrations and hence may be expected to have the lowest spin values.
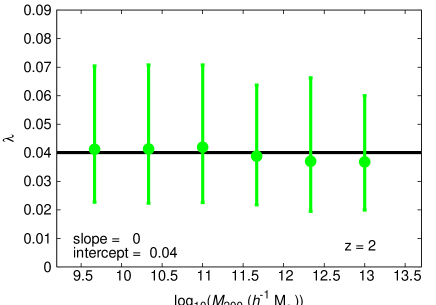
We explore the relationship between spin and mass in Fig. 2. In this figure we show the median spin value and the halo-to-halo scatter for several mass bins, for each of the three cosmologies that we have considered at (left panel) and for the WMAP 3 cosmology only at (right panel). We use least-squares fitting of the median in each mass bin to determine the slope and intercept of the relation in each simulation set, assuming a pivot mass of . The spin parameter is largely insensitive to halo mass; a weak trend is seen (which may explain the slight redshift dependence seen earlier, due to our two samples covering a different mass range), but is not statistically significant (we find the best-fitting slope to be consistent with zero at the level in all cases - where the confidence is determined using bootstrap resampling). Once again, we can clearly see that the effect of cosmology on the spin parameter is negligible.
3.1.2 Effect of baryons on DM halo spin
Following on from the dark matter only case, we now consider the distribution of DM halo spin parameters computed from the baryon runs. We only include dark matter particles in our determination of specific angular momentum to directly assess the effects of baryons on the dark matter component. The mean, median, standard deviation and skewness for the distribution of spin parameters in each run is presented in Table 3. For ease of comparison with the dark matter only case, we show in Fig. 1 the mean value for two of the most extreme feedback schemes we have considered: the no feedback case (NOSN_NOZCOOL; green arrow) and the stellar and AGN feedback run (AGN; red arrow).
From Fig. 1 and Table 3 we see that, at , the baryons induce a small increase in the mean (and median) value of within . For NOSN_NOZCOOL (where feedback is absent), the increase is around 5 per cent, but for the more realistic555The AGN run reproduces the observed relations between black holes and the mass and velocity dispersion of their host galaxies (Booth & Schaye 2009), as well as the observed optical and X-ray properties of the groups in which they reside (McCarthy et al. 2010). Whether the AGN model is also the most realistic simulation at high redshift is unclear. AGN run (where feedback is strongest), it is only 1 per cent. At higher redshift ( and 2), the effect of baryons on the mean spin parameter is weak but tends to decrease the spin in all cases. It is also interesting to note that, within the central region (0.25), the baryon runs have distributions that are skewed to lower values than the DMONLY run (also true for the whole halo at ).
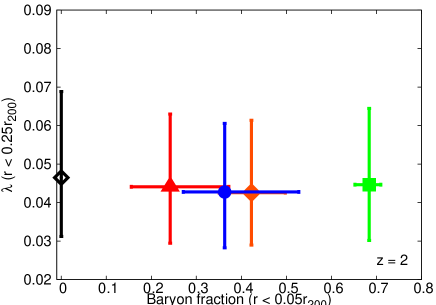
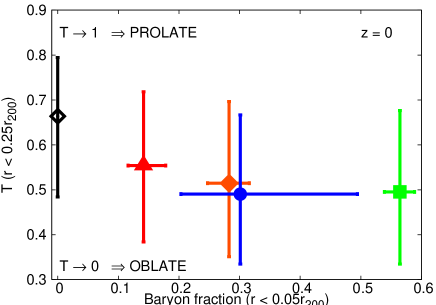
The effects of baryons are stronger in runs with weak or no feedback, when we consider dark matter particles within the central region (consistent with the findings of Bett et al. 2010, who studied the effects of baryons using a more restricted set of simulations). At , the mean spin parameter computed within the central region increases by 25 per cent in NOSN_NOZCOOL (but again, is almost unchanged in AGN). This effect is shown more clearly in Fig. 3, where we plot666Note: To ensure that mass dependent trends do not influence our comparison we do not include the 400 box dark matter simulation when directly comparing runs at . This leaves us with a sample of 4329 haloes in the DMONLY simulation at with a median mass of comparable to the median mass in the baryon runs. the median spin parameter for the central region () against the baryon fraction within the very centre (). The latter is used as a proxy for galaxy formation efficiency, as weaker feedback leads to stronger gas cooling and a larger central baryon fraction, associated with the galaxy at the centre of the halo. It is clear that there is a positive correlation between the two quantities at but this correlation has all but disappeared at .
We find that baryons do not influence the mass dependence of the spin parameter (in almost all cases, the slope is consistent with zero at and in all cases it is consistent with zero at ). The trends found in this analysis are also preserved when only the sub-set of relaxed haloes is considered.
3.1.3 Origin of spin variations in the DM
 |
 |
From equation 1, it is clear that the increase in must be due to an increase of the specific angular momentum of the dark matter, or a decrease in the enclosed mass. As discussed in Bett et al. (2010), an increase in specific angular momentum can result from two factors. The first is the transfer of angular momentum from gas to dark matter via tidal torques and dynamical friction (see for example Tonini et al. 2006b). The second is the contraction of the dark matter in response to the deepened potential well of the system (assuming angular momentum is conserved).
To explore this further, we apply the approach of Bett et al. (2010) to our haloes at and . We begin by matching haloes between the DMONLY and baryon runs; a match is identified by selecting the halo from the baryon run that contains the most of the most-bound particles from the dark matter simulation. We then compute the DM mass ratio (within ) for each matched pair of haloes. If the DM halo has contracted due to the presence of baryons, the mass should increase with respect to the mass in the DMONLY halo. We then compare the specific angular momentum of the dark matter within from the baryon run , to the corresponding halo in DMONLY, within a radius containing the equivalent mass, . If the halo contracts due to the presence of baryons and conserves its angular momentum (i.e. if there is no transfer from the baryons) then this ratio will be unity.
The results for each baryon run are shown in Fig. 4, where we show the ratio of specific angular momentum versus the mass ratio within for the 500 (1000; 500 from each box) most massive haloes that we are able to match777A match is found in 92 per cent of the cases (and at least 72 per cent of these matches have ratios within 30 per cent and minimum potential positions within 30 per cent of of each other). between runs at (). From this figure, it can clearly be seen that the AGN feedback acts to reduce the mass in the central regions, but as galaxy formation efficiency increases, we see the effect of halo contraction (see Eggen et al. 1962; Zeldovich et al. 1980). This effect was studied in detail for the same set of runs by Duffy et al. (2010).
If we now consider the ratio of specific angular momentum at , we find that the AGN result is consistent with no transfer, but as galaxy formation (and thus halo contraction) is more efficient, a net transfer from the baryons to the dark matter does occur (this is also seen in Kaufmann et al. 2007; Abadi et al. 2010; Bett et al. 2010). At there is no evidence for a trend in the transfer of angular momentum with galaxy formation efficiency.
In summary, we find that in all baryon runs with efficient galaxy formation at there is evidence for the transfer of angular momentum from baryons to dark matter. This is likely due to the fact that satellites are able to survive infall into the host halo. The effect of feedback on the halo central density and on satellites is discussed in, for example, Pedrosa et al. (2010), Duffy et al. (2010) and Libeskind et al. (2010). The haloes in the weak/no feedback runs also experience a net increase in the dark matter within the central region (contraction). These two effects combine, resulting in an increased spin parameter in the baryon runs when compared to dark matter only simulations. In the lower mass haloes at there is no evidence for the transfer angular momentum within the central regions. The slight decrease we see in the spin parameter at can be understood as arising from the decreased specific angular momentum (shallower potential well) in the case of expansion in the strong feedback runs (AGN and WDENS) and as a result of the increased circular velocity in the case of contraction in the weak/no feedback runs (NOSN_NOZCOOL and REF).
3.2 Halo Shapes
 |
 |
 |
 |
 |
 |
| Slope | Intercept | Slope | Intercept | Slope | Intercept | |
|---|---|---|---|---|---|---|
| DMONLY WMAP 1 | ||||||
| DMONLY WMAP 3 | ||||||
| DMONLY WMAP 5 | ||||||
| AGN | ||||||
| WDENS | ||||||
| REF | ||||||
| NOSN_NOZCOOL | ||||||
| DMONLY WMAP 3 | ||||||
| AGN | ||||||
| WDENS | ||||||
| REF | ||||||
| NOSN_NOZCOOL | ||||||
| DMONLY WMAP 3 | ||||||
| AGN | ||||||
| WDENS | ||||||
| REF | ||||||
| NOSN_NOZCOOL | ||||||
3.2.1 Dark matter only simulations
Before turning our attention to the effect of baryons on halo shape, we will analyse the DMONLY runs. Of particular interest is the relationship between the shape parameters, , and , and mass, , of the dark matter halo. Previous work has shown that and are negatively correlated with mass, and positively correlated (e.g. Bett et al. 2007; Macciò et al. 2008; Jeeson-Daniel et al. 2011). Our dark matter only results extend this work by studying the dependence of these correlations on both cosmology and redshift, as well as establishing the baseline for the runs with baryons.
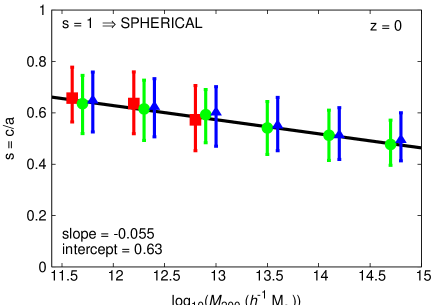
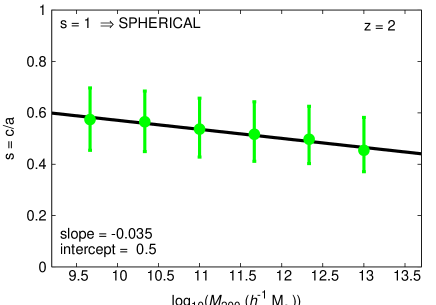
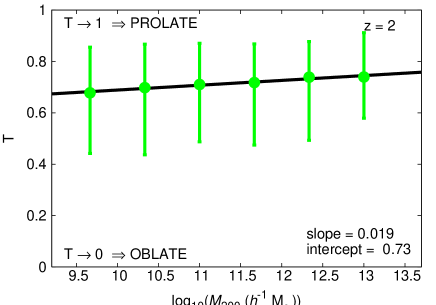
The mass dependence of the shape parameters is shown in Fig. 5. In each panel we show the median value for , and , within several mass bins, while the error bars represent the halo-to-halo scatter. Again, haloes are required to contain at least 1000 particles and the mass bins at least 20 haloes. We use least-squares fitting to determine the slope and intercept of the mass relation for each parameter, using a pivot mass of . In the left panels we show the median values for all three cosmological models at , but for clarity, only plot the fit to the DMONLY WMAP 3 haloes. The corresponding results for the DMONLY WMAP 3 run at are shown in the right panels. The best-fit parameters for the mass dependence of all simulation sets are presented in Table 4.
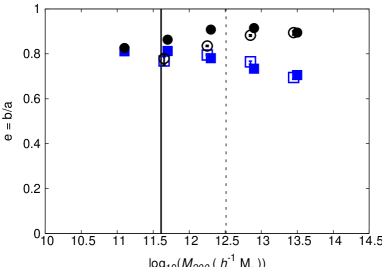
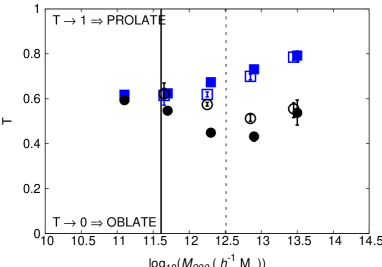
As with the spin parameter, it is clear from the left panels of Fig. 5, that there is no significant difference between the different cosmological models studied here. At there is a strong trend for more massive haloes to have smaller axis ratios. Quantitatively, the sphericity varies from for haloes of mass , to for haloes of mass . Since decreases faster with mass than does, the triaxiality parameter increases with mass; over the same range in mass, the triaxiality parameter increases from to . In short, high-mass haloes are less spherical and more prolate than their lower-mass counterparts. This is likely a consequence of their more recent formation time (as discussed in Springel et al. 2004; Jeeson-Daniel et al. 2011). Our results are in agreement with previous studies (Bett et al. 2007; Macciò et al. 2008; Jeeson-Daniel et al. 2011).
At , we find that the correlations between the shape parameters and mass are much weaker, but still present. For example, at but at . A similar trend is seen in the evolution of the concentration-mass relation (Zhao et al., 2003; Duffy et al., 2008) and again, is likely to reflect that haloes have had less time to collapse, so exhibit a narrower range in formation times (and therefore internal properties). This explanation is consistent with the findings of Jeeson-Daniel et al. (2011), who used a principal components analysis to show that concentration, which they found to be essentially equivalent to formation time, is the most fundamental property of dark matter haloes in that scatter in this quantity accounts for much of the scatter in the other dimensionless properties of dark matter haloes, including the shape parameters investigated here.
3.2.2 Effect of baryons on DM halo shape
 |
 |
 |
 |
 |
 |
Runs with more efficient galaxy formation (weaker feedback) contain haloes that are more spherical and less prolate than runs with stronger feedback.
Baryons are known to have a significant effect on the shapes of haloes. As gas cools and condenses within the centre of a halo, it reduces the fraction of box orbits present in the dark matter and stars, resulting in a more spherical structure. Feedback prevents cooling and acts to expel gas from the central region, resulting in a lower central mass concentration, more box orbits and a more triaxial shape (see, for example, Debattista et al. 2008; Bryan et al. 2012). Here, we quantify the impact of these effects for our range of feedback prescriptions, over a wide range in halo mass, and at low and high redshift.
The mass dependence of the halo shape parameters in the baryon runs is summarised in Table 4. Again, this is for the shape determined within using only the dark matter particles. From this we see that the trends seen in the DMONLY runs are still present in the runs with baryons. However, it is interesting to note that the baryons are able to affect the shape of the halo out to , albeit in a minor way. The axis ratio intercepts (both and ) systematically increase with increasing galaxy formation efficiency, while the triaxiality parameter decreases accordingly.
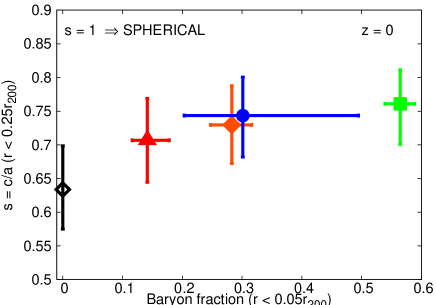
The baryons have a larger impact on the shape of the central region of the dark matter halo. To quantify this, we compare the median values for and within to the central baryon fraction (within ) for each of the simulation runs. Note: To ensure that mass dependent trends do not influence our comparison we do not include the 400 box dark matter simulation at when directly comparing runs. These results are presented in Fig. 6. From this figure we can see that there is a clear trend for and to increase with increasing baryon fraction, while the triaxiality decreases with increasing baryon fraction. This trend is apparent both at and . At , the median sphericity is increased by per cent when comparing the extreme (DMONLY and NOSN_NOZCOOL) cases, while the triaxiality is reduced by approximately the same factor. The change is still significant in the more realistic AGN model, where the sphericity increases by around 10-15 per cent and the triaxiality decreases by a similar factor. As expected, these results are consistent with the idea that gas cooling to the centre of haloes results in more spherical haloes. It also drives down the value of the triaxiality parameter, tending to make the haloes considerably less prolate than seen in dark matter only runs. Feedback reduces the amount of gas that is able to cool and condense to the centre of the halo (resulting in a lower central baryon fraction) and hence reduces the impact on the shape of the halo.
4 Summary
In this paper, we have exploited a subset of runs from the OverWhelmingly Large Simulations (OWLS; Schaye et al. 2010) to investigate the impact of baryons (through gas cooling, star formation and feedback from stars and black holes) on the spin and shape of dark matter haloes. Our results allow statistically meaningful conclusions to be drawn regarding the impact of baryons on these properties, due to the large number of haloes spanning a wide dynamic range in mass. We have also checked whether our results depend on cosmology and redshift. Our main results are summarised below.
-
1.
The spin distribution of dark matter haloes in simulations without baryons is characterised by a log-normal curve, with best-fit values of and at (2), in agreement with previous work (Bullock et al., 2001; Bailin & Steinmetz, 2005; Bett et al., 2007; Macciò et al., 2008). The distribution is very similar for the WMAP 1, WMAP 3 and WMAP 5 cosmologies, suggesting that there is no strong dependence on (the parameter that varies the most between the three models). No significant dependence of spin with mass is seen, both at and . At the spin parameter remains essentially unchanged if computed using only mass within the central region (), as found by Bailin & Steinmetz (2005). However, at the inner region of haloes has a higher mean spin than that computed over the whole halo. Restricting our sample to relaxed haloes causes a small (10-15 per cent) decrease in the mean value (in agreement with Macciò et al. 2006 and Jeeson-Daniel et al. 2011).
-
2.
At the spin distribution of dark matter haloes extracted from the baryon runs is not significantly different to that of dark matter only haloes when computed using all dark matter particles within . However, in the central regions (), where baryons are expected to play an important role, haloes in runs with absent or weak stellar feedback tend to have higher median spin values than those from stronger feedback runs (which are very similar to the dark matter only case). We showed that this is, at least in part, due to the transfer of angular momentum from the baryons to the dark matter in the former runs. At the baryon runs exhibit slightly lower median spin values than the dark matter only case, an effect that is likely due to the increased circular velocity in weak feedback runs and decreased specific angular momentum within the central regions in the strong feedback runs.
-
3.
Dark matter only haloes extracted from OWLS typically have sphericities of to and triaxialities of between 0.6 and 0.8 (indicating triaxial to prolate shapes) over the mass and redshift ranges we have explored. More massive haloes have less spherical and more prolate shapes. Again, we find that halo shape is insensitive to the choice of cosmological model. Galaxies and groups at show the same trends with mass as the groups and clusters at , but weaker.
-
4.
When baryons are included, we find that the mass dependent trends remain, and that the intercepts of the relation between sphericity (triaxiality) and mass slowly increase (decrease) with increasing galaxy formation efficiency. At , baryons increase the dark matter shape parameters by around 10 per cent in the most extreme case (no feedback). A similar result is seen at higher redshift. Larger differences are again seen when we consider only the central regions of the halo.
In conclusion, we find that the baryons have a very minor effect on the spin and overall shape of the entire dark matter halo when the feedback is strong enough to match observed stellar mass fractions. In particular, the model with AGN feedback can reproduce several observational properties on galactic and groups scale at by removing gas, suppressing the baryonic impact on the dark matter halo shape. It should therefore be safe to assume results from dark matter only simulations when considering the overall halo properties, at least on the scales resolved by our simulations. However, even when feedback is strong we find that baryons have a significant effect on the shape of the inner halo.
Acknowledgements
We thank Volker Springel for the use of gadget and subfind and Mareike Haberichter for useful discussions. The simulations presented here were run on Stella, the LOFAR Blue Gene/L system in Groningen, on the Cosmology Machine at the Institute for Computational Cosmology in Durham (which is part of the DiRAC Facility jointly funded by STFC, the Large Facilities Capital Fund of BIS, and Durham University) as part of the Virgo Consortium research programme, and on Darwin in Cambridge. This work was sponsored by the National Computing Facilities Foundation (NCF) for the use of supercomputer facilities, with financial support from the Netherlands Organization for Scientific Research (NWO). This work was supported by an NWO VIDI grant and by the Marie Curie Initial Training Network CosmoComp (PITN-GA-2009-238356). SEB acknowledges support provided by the EU Framework 6 Marie Curie Early Stage Training Programme under contract number MEST-CT-2005-19669 “ESTRELA”. STK was supported by the Science and Technology Facilities Council (STFC) through grant ST/G002592/1.
References
- Abadi et al. (2010) Abadi M. G., Navarro J. F., Fardal M., Babul A., Steinmetz M., 2010, MNRAS, 407, 435
- Allgood et al. (2006) Allgood B., Flores R. A., Primack J. R., Kravtsov A. V., Wechsler R. H., Faltenbacher A., Bullock J. S., 2006, MNRAS, 367, 1781
- Bailin & Steinmetz (2004) Bailin J., Steinmetz M., 2004, ApJ, 616, 27
- Bailin & Steinmetz (2005) Bailin J., Steinmetz M., 2005, ApJ, 627, 647
- Bardeen et al. (1986) Bardeen J. M., Bond J. R., Kaiser N., Szalay A. S., 1986, ApJ, 304, 15
- Barnes & Hernquist (1996) Barnes J. E., Hernquist L., 1996, ApJ, 471, 115
- Becker & Kravtsov (2011) Becker M. R., Kravtsov A. V., 2011, ApJ, 740, 25
- Bett (2012) Bett P., 2012, MNRAS, 420, 3303
- Bett et al. (2007) Bett P., Eke V., Frenk C. S., Jenkins A., Helly J., Navarro J., 2007, MNRAS, 376, 215
- Bett et al. (2010) Bett P., Eke V., Frenk C. S., Jenkins A., Okamoto T., 2010, MNRAS, 404, 1137
- Booth & Schaye (2009) Booth C. M., Schaye J., 2009, MNRAS, 398, 53
- Bryan et al. (2012) Bryan S. E., Mao S., Kay S. T., Schaye J., Dalla Vecchia C., Booth C. M., 2012, MNRAS, 422, 183
- Bullock (2002) Bullock J. S., 2002, in The Shapes of Galaxies and their Dark Matter Haloes, P. Natarajan, ed., pp. 109–113
- Bullock et al. (2001) Bullock J. S., Dekel A., Kolatt T. S., Kravtsov A. V., Klypin A. A., Porciani C., Primack J. R., 2001, ApJ, 555, 240
- Cole & Lacey (1996) Cole S., Lacey C., 1996, MNRAS, 281, 716
- Dalla Vecchia & Schaye (2008) Dalla Vecchia C., Schaye J., 2008, MNRAS, 387, 1431
- Davis et al. (1985) Davis M., Efstathiou G., Frenk C. S., White S. D. M., 1985, ApJ, 292, 371
- de Zeeuw & Franx (1989) de Zeeuw T., Franx M., 1989, ApJ, 343, 617
- Debattista et al. (2008) Debattista V. P., Moore B., Quinn T., Kazantzidis S., Maas R., Mayer L., Read J., Stadel J., 2008, ApJ, 681, 1076
- Debattista & Sellwood (1999) Debattista V. P., Sellwood J. A., 1999, ApJL, 513, L107
- Dolag et al. (2008) Dolag K., Borgani S., Schindler S., Diaferio A., Bykov A. M., 2008, Space Sci. Rev., 134, 229
- Dubinski (1994) Dubinski J., 1994, ApJ, 431, 617
- Dubinski & Carlberg (1991) Dubinski J., Carlberg R. G., 1991, ApJ, 378, 496
- Duffy et al. (2008) Duffy A. R., Schaye J., Kay S. T., Dalla Vecchia C., 2008, MNRAS, 390, L64
- Duffy et al. (2010) Duffy A. R., Schaye J., Kay S. T., Dalla Vecchia C., Battye R. A., Booth C. M., 2010, MNRAS, 405, 2161
- Eggen et al. (1962) Eggen O. J., Lynden-Bell D., Sandage A. R., 1962, ApJ, 136, 748
- Evrard et al. (1994) Evrard A. E., Summers F. J., Davis M., 1994, ApJ, 422, 11
- Franx et al. (1991) Franx M., Illingworth G., de Zeeuw T., 1991, ApJ, 383, 112
- Frenk et al. (1988) Frenk C. S., White S. D. M., Davis M., Efstathiou G., 1988, ApJ, 327, 507
- Holmberg (1969) Holmberg E., 1969, Arkiv for Astronomi, 5, 305
- Hopkins et al. (2005) Hopkins P. F., Bahcall N. A., Bode P., 2005, ApJ, 618, 1
- Jeeson-Daniel et al. (2011) Jeeson-Daniel A., Dalla Vecchia C., Haas M. R., Schaye J., 2011, MNRAS, 415, L69
- Jing & Suto (2002) Jing Y. P., Suto Y., 2002, ApJ, 574, 538
- Kang et al. (2005) Kang X., Mao S., Gao L., Jing Y. P., 2005, A&A, 437, 383
- Katz & Gunn (1991) Katz N., Gunn J. E., 1991, ApJ, 377, 365
- Kaufmann et al. (2007) Kaufmann T., Mayer L., Wadsley J., Stadel J., Moore B., 2007, MNRAS, 375, 53
- Kazantzidis et al. (2004) Kazantzidis S., Kravtsov A. V., Zentner A. R., Allgood B., Nagai D., Moore B., 2004, ApJL, 611, L73
- Knebe et al. (2004) Knebe A., Gill S. P. D., Gibson B. K., Lewis G. F., Ibata R. A., Dopita M. A., 2004, ApJ, 603, 7
- Knebe et al. (2010) Knebe A., Libeskind N. I., Knollmann S. R., Yepes G., Gottlöber S., Hoffman Y., 2010, MNRAS, 405, 1119
- Komatsu et al. (2009) Komatsu E. et al., 2009, ApJS, 180, 330
- Libeskind et al. (2007) Libeskind N. I., Cole S., Frenk C. S., Okamoto T., Jenkins A., 2007, MNRAS, 374, 16
- Libeskind et al. (2005) Libeskind N. I., Frenk C. S., Cole S., Helly J. C., Jenkins A., Navarro J. F., Power C., 2005, MNRAS, 363, 146
- Libeskind et al. (2010) Libeskind N. I., Yepes G., Knebe A., Gottlöber S., Hoffman Y., Knollmann S. R., 2010, MNRAS, 401, 1889
- Macciò et al. (2008) Macciò A. V., Dutton A. A., van den Bosch F. C., 2008, MNRAS, 391, 1940
- Macciò et al. (2007) Macciò A. V., Dutton A. A., van den Bosch F. C., Moore B., Potter D., Stadel J., 2007, MNRAS, 378, 55
- Macciò et al. (2006) Macciò A. V., Moore B., Stadel J., Diemand J., 2006, MNRAS, 366, 1529
- McCarthy et al. (2010) McCarthy I. G. et al., 2010, MNRAS, 406, 822
- Merrifield (2004) Merrifield M. R., 2004, in IAU Symposium, Vol. 220, Dark Matter in Galaxies, S. Ryder, D. Pisano, M. Walker, & K. Freeman, ed., p. 431
- Mo et al. (1998) Mo H. J., Mao S., White S. D. M., 1998, MNRAS, 295, 319
- Muñoz-Cuartas et al. (2011) Muñoz-Cuartas J. C., Macciò A. V., Gottlöber S., Dutton A. A., 2011, MNRAS, 411, 584
- Navarro et al. (1997) Navarro J. F., Frenk C. S., White S. D. M., 1997, ApJ, 490, 493
- Neto et al. (2007) Neto A. F. et al., 2007, MNRAS, 381, 1450
- O’Brien et al. (2010) O’Brien J. C., Freeman K. C., van der Kruit P. C., 2010, A&A, 515, A63
- Oguri et al. (2003) Oguri M., Lee J., Suto Y., 2003, ApJ, 599, 7
- Ostriker & Binney (1989) Ostriker E. C., Binney J. J., 1989, MNRAS, 237, 785
- Pedrosa et al. (2010) Pedrosa S., Tissera P. B., Scannapieco C., 2010, MNRAS, 402, 776
- Peebles (1969) Peebles P. J. E., 1969, ApJ, 155, 393
- Power et al. (2003) Power C., Navarro J. F., Jenkins A., Frenk C. S., White S. D. M., Springel V., Stadel J., Quinn T., 2003, MNRAS, 338, 14
- Sackett (1999) Sackett P. D., 1999, in Astronomical Society of the Pacific Conference Series, Vol. 182, Galaxy Dynamics - A Rutgers Symposium, D. R. Merritt, M. Valluri, & J. A. Sellwood, ed., p. 393
- Sales et al. (2012) Sales L. V., Navarro J. F., Theuns T., Schaye J., White S. D. M., Frenk C. S., Crain R. A., Dalla Vecchia C., 2012, MNRAS, 423, 1544
- Schaye & Dalla Vecchia (2008) Schaye J., Dalla Vecchia C., 2008, MNRAS, 383, 1210
- Schaye et al. (2010) Schaye J. et al., 2010, MNRAS, 402, 1536
- Seljak & Zaldarriaga (1996) Seljak U., Zaldarriaga M., 1996, ApJ, 469, 437
- Sharma & Steinmetz (2005) Sharma S., Steinmetz M., 2005, ApJ, 628, 21
- Sharma et al. (2012) Sharma S., Steinmetz M., Bland-Hawthorn J., 2012, ApJ, 750, 107
- Spergel et al. (2007) Spergel D. N. et al., 2007, ApJS, 170, 377
- Spergel et al. (2003) Spergel D. N. et al., 2003, ApJS, 148, 175
- Springel (2005) Springel V., 2005, MNRAS, 364, 1105
- Springel et al. (2004) Springel V., White S. D. M., Hernquist L., 2004, in IAU Symposium, Vol. 220, Dark Matter in Galaxies, S. Ryder, D. Pisano, M. Walker, & K. Freeman, ed., p. 421
- Springel et al. (2005) Springel V. et al., 2005, Nature, 435, 629
- Springel et al. (2001) Springel V., White S. D. M., Tormen G., Kauffmann G., 2001, MNRAS, 328, 726
- Steiman-Cameron et al. (1992) Steiman-Cameron T. Y., Kormendy J., Durisen R. H., 1992, AJ, 104, 1339
- Tissera & Dominguez-Tenreiro (1998) Tissera P. B., Dominguez-Tenreiro R., 1998, MNRAS, 297, 177
- Tissera et al. (2010) Tissera P. B., White S. D. M., Pedrosa S., Scannapieco C., 2010, MNRAS, 406, 922
- Tonini et al. (2006a) Tonini C., Lapi A., Salucci P., 2006a, ApJ, 649, 591
- Tonini et al. (2006b) Tonini C., Lapi A., Shankar F., Salucci P., 2006b, ApJL, 638, L13
- Vera-Ciro et al. (2011) Vera-Ciro C. A., Sales L. V., Helmi A., Frenk C. S., Navarro J. F., Springel V., Vogelsberger M., White S. D. M., 2011, MNRAS, 416, 1377
- Warren et al. (1992) Warren M. S., Quinn P. J., Salmon J. K., Zurek W. H., 1992, ApJ, 399, 405
- White (1996) White S. D. M., 1996, in Cosmology and large scale Structure, R. Schaeffer, J. Silk, M. Spiro, & J. Zinn-Justin, ed., p. 349
- Wiersma et al. (2009a) Wiersma R. P. C., Schaye J., Smith B. D., 2009a, MNRAS, 393, 99
- Wiersma et al. (2009b) Wiersma R. P. C., Schaye J., Theuns T., Dalla Vecchia C., Tornatore L., 2009b, MNRAS, 399, 574
- Zel’dovich (1970) Zel’dovich Y. B., 1970, A&A, 5, 84
- Zeldovich et al. (1980) Zeldovich Y. B., Klypin A. A., Khlopov M. Y., Chechetkin V. M., 1980, Sov. J. Nucl. Phys., 31, 664
- Zemp et al. (2011) Zemp M., Gnedin O. Y., Gnedin N. Y., Kravtsov A. V., 2011, ApJS, 197, 30
- Zemp et al. (2012) Zemp M., Gnedin O. Y., Gnedin N. Y., Kravtsov A. V., 2012, ApJ, 748, 54
- Zentner et al. (2005) Zentner A. R., Kravtsov A. V., Gnedin O. Y., Klypin A. A., 2005, ApJ, 629, 219
- Zhao et al. (2003) Zhao D. H., Jing Y. P., Mo H. J., Börner G., 2003, ApJL, 597, L9
Appendix A Resolution Tests
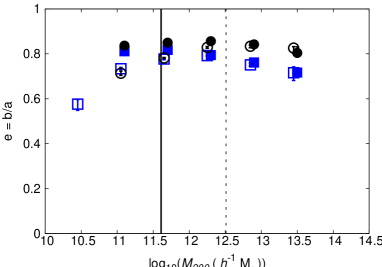
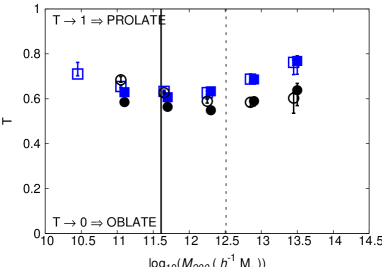
In order to quantify the effects of resolution, the shapes of haloes extracted from a particle run with a maximum force softening length of 2 kpc (used in this analysis) are compared with those from a corresponding lower-resolution run (containing particles with a maximum softening length of 4 kpc). Resolution tests for the central regions () of dark matter only haloes and the haloes from the weak stellar feedback run are shown in Fig. 7, while the resolution tests for the overall properties computed within are shown in Fig. 8. These figures show the spin (), , and triaxiality (), respectively, as a function of halo mass. In each of these plots the properties of haloes extracted from the particle simulations are shown with filled symbols and the results from the lower-resolution run with particles are shown with open symbols. Dark matter only runs are shown as blue squares while the weak stellar feedback runs are shown as black circles. The error bars are the one-sigma bootstrap resampled median distributions (1000 bootstrap samples have been used). Vertical lines show the 1000-particle cuts that have been used in this analysis. Clearly, the properties we discuss are well resolved beyond 1000 particles.
 |
 |
 |
 |
 |
 |
 |
 |