An inventory of the stellar initial mass function in early-type galaxies
Abstract
Given a flurry of recent claims for systematic variations in the stellar initial mass function (IMF), we carry out the first inventory of the observational evidence using different approaches. This includes literature results, as well as our own new findings from combined stellar-populations synthesis (SPS) and Jeans dynamical analyses of data on 4500 early-type galaxies (ETGs) from the SPIDER project. We focus on the mass-to-light ratio mismatch relative to the Milky Way IMF, , correlated against the central stellar velocity dispersion, . We find a strong correlation between and , for a wide set of dark matter (DM) model profiles. These results are robust if a uniform halo response to baryons is adopted across the sample. The overall normalization of , and the detailed DM profile, are less certain, but the data are consistent with standard cold-DM halos, and a central DM fraction that is roughly constant with . For a variety of related studies in the literature, using SPS, dynamics, and gravitational lensing, similar results are found. Studies based solely on spectroscopic line diagnostics agree on a Salpeter-like IMF at high , but differ at low . Overall, we find that multiple independent lines of evidence appear to be converging on a systematic variation in the IMF, such that high- ETGs have an excess of low-mass stars relative to spirals and low- ETGs. Robust verification of super-Salpeter IMFs in the highest- galaxies will require additional scrutiny of scatter and systematic uncertainties. The implications for the distribution of DM are still inconclusive.
Subject headings:
galaxies: evolution — galaxies: general — galaxies: elliptical and lenticular, cD1. Introduction
The stellar Initial Mass Function (IMF) is fundamentally important to understanding both stellar populations and galaxies. The Milky Way (MW) IMF was originally characterized as a power-law mass-distribution, , with (Salpeter, 1955), and subsequently refined to flatten at lower masses (; Kroupa 2001; Chabrier 2003).
Whether or not the MW IMF describes stellar populations elsewhere in the Universe cannot yet be said through direct star counts. There have been some indirect observational hints of IMF variations, and ample theoretical motivation for these, but no broadly convincing evidence has emerged (cf. Bastian et al. 2010).
This situation has recently changed, with a flurry of studies of early-type galaxies (ETGs) turning up indirect evidence for systematic IMF variations. These studies use models of stellar population synthesis (SPS) to fit integrated-light data (broad-band colors and spectroscopic features), and fall into two broad categories: “pure” SPS, and “hybrid” SPS+gravitating mass analyses.
The pure analyses rely on spectral lines that are differentially sensitive to giant or dwarf stars. These include the TiO feature at 6130 Å, the Na I doublet near 8190 Å, the Ca II triplet near 8600 Å, the Wing–Ford [Fe/H] band at 9915 Å, and the Ca I line at 10345 Å (e.g., Cenarro et al. 2003; van Dokkum & Conroy 2010; Spiniello et al. 2012; Conroy & van Dokkum 2012, hereafter CvD12; Ferreras et al. 2012; Smith et al. 2012).
The hybrid analyses assume an IMF and infer a stellar mass-to-light ratio using a more conventional SPS approach based on colors, and age- and metallicity-sensitive spectral lines. Estimates of are also derived using dynamics or gravitational lensing. Comparison of the independent results then yields a revised IMF (e.g., Cappellari et al. 2006, 2012a, 2012b; Ferreras et al. 2008; Tortora et al. 2009, 2010; Grillo & Gobat 2010; Grillo 2010; Treu et al. 2010; Napolitano et al. 2010, 2011; Auger et al. 2010; Thomas et al. 2011; Spiniello et al. 2011; Dutton et al. 2012b, a; Sonnenfeld et al. 2012; Wegner et al. 2012; Tortora et al. 2012).
One may characterize a revised IMF through its relative to a MW-disk IMF, (the “mismatch parameter”), where for reference we adopt the Chabrier IMF. Remarkably, almost all the above studies found “heavy” IMFs () for the most massive ETGs. Less massive ETGs, and spiral galaxies, appear to have “normal/light” IMFs (; e.g., Bell & de Jong 2001; Bershady et al. 2011; Suyu et al. 2012; Brewer et al. 2012) and the bulge components of spirals may also have a similar mass dependence to ETGs (de Blok et al. 2008; Ferreras et al. 2010, F+10; Dutton et al. 2012c, D+12c).
These IMF findings are both potentially revolutionary, and highly controversial, and demand further investigation. In particular, with hybrid analyses there are lingering questions about degeneracies associated with the distribution of non baryonic dark matter (DM). The time is also ripe to inventory the results to date, and see if the apparent emerging consensus holds up under quantitative, systematic comparison – which could provide pressing motivation for understanding the physical origins of the trends. Comparisons were made for some hybrid analyses (Thomas et al., 2011; Dutton et al., 2012a; Wegner et al., 2012), but nor for the pure SPS work.
In this Letter we carry out such an inventory, while presenting our own novel results for a large sample of ETGs for reference, following the dynamicalSPS analyses of Tortora et al. (2012, hereafter T+12). We focus on the trends in with central stellar velocity dispersion, , and discuss some implications for the central DM fraction. is widely considered as crucially connected to galaxy evolution, and unlike , is relatively independent of the bandpass, and of .
2. Data and analysis methods
We apply a combination of SPS and stellar dynamical models to a sample of giant ETGs, in the redshift range of –, drawn from the SPIDER project (La Barbera et al. 2010b). Our data include opticalnear-infrared photometry [from the Sloan Digital Sky Survey (SDSS) and the UKIRT Infrared Deep Sky Survey-Large Area Survey]222http://www.sdss.org, http://www.ukidss.org, high-quality measurements of galactic structural parameters (effective radius and Sérsic index ), and SDSS central-aperture velocity dispersions . The sample galaxies are defined as bulge dominated systems with passive spectra while late-type systems are efficiently removed through the SDSS classification parameters based on the spectral type and the fraction of light which is better described by a de Vaucouleurs (1948) profile (see T+12 for further details). The structural parameters are measured using 2DPHOT (La Barbera et al. 2008) and are found to be significantly different from the SDSS estimates (La Barbera et al. 2010b). The sample is complete at a stellar mass of , which corresponds to .
The SPS-based values were derived by fitting Bruzual & Charlot (2003) models to the multi-band photometry, assuming a Chabrier IMF. These results have been shown to be consistent with independent literature (e.g., MPA masses in Dutton et al. 2012a), while possible systematics in stellar mass () estimates are discussed in Swindle et al. (2011) and T+12. Despite the well known age-metallicity degeneracies in photometric data, these conspire to keep the stellar mass-to-light ratio well constrained, with scatter of dex. The agreement is also excellent when our colour derived masses are compared with spectroscopic estimates. The largest systematical uncertainty in our analysis comes from our ignorance on the IMF shape, which can produce variations of the stellar M/L of a factor as large as . For this reason IMF is a key issue in stellar population analysis and the central topic of this paper.
Our dynamical-mass estimates use spherical isotropic Jeans equations fitted to the data. We also extend the T+12 analysis using two-component mass models: a Sérsic-based stellar distribution following the -band light, and a standard DM profile. For the latter we adopt a series of plausible assumptions (cf. Cappellari et al. 2012a), as the data do not allow us to constrain both components simultaneously.
Our DM models are based on the Navarro et al. (1996, hereafter NFW) profile, with an adjustable degree of baryon-induced adiabatic contraction (AC). For the virial mass and concentration (, ), we adopt mean trends for a WMAP5 cosmology (Macciò et al., 2008), for the – relation we used Moster et al. (2010, M+10 hereafter). Each galaxy’s mass model then has one free parameter, , plus optional AC (Gnedin et al., 2004, G+04 hereafter), providing our no-AC-NFW and AC-NFW base-models.
We explore the sensitivity of our results to these assumptions by doing the analyses with the following alternatives: a) AC recipes of varying strengths (Blumenthal et al. 1986, B+86; Abadi et al. 2010, A+10); b) with a fixed value for the entire sample: , , or ; c) WMAP3-based – relation (Macciò et al., 2008); d) no DM is present; e) mild kinematic anisotropy, with or ; f) – relation altered to mimic a warm dark matter (WDM) cosmology, assuming different particle masses (Schneider et al., 2012, S+12a hereafter).
To study the mean trends of with velocity dispersion, we construct “average” galaxies by dividing our sample into 10 -bins, for which we compute median values of , , , and . We show these values, and their 25–75 percentile scatter, in Figure 1. For each -bin and a given DM model, we solve the radial Jeans equation for the value which matches the observed .

Our final analysis-products, for each galaxy bin and mass model, will be the SPS-determined , the dynamically-determined , the inferred , and the inferred central DM-fraction, . For homogeneity, we convert to (the value at ), using the best-fitting relation in Cappellari et al. (2006) (also done for the literature results later).
3. Results: IMF and DM fraction trends
Our main IMF results are shown in Figure 2. The two thick black curves correspond to our standard no-AC-NFW (solid) and AC-NFW (long-dashed) models, and the suite of alternative models are also plotted, as labeled.
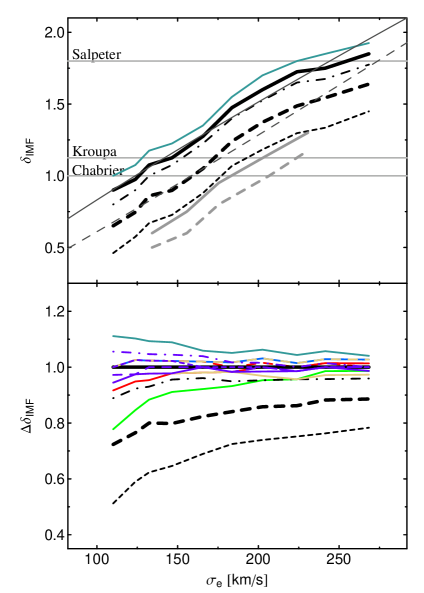

It is clear that the overall normalization of is degenerate with the adopted halo model, as DM can be traded against stellar mass. This degeneracy is most severe when allowing for uncertainties in the halo response to baryons (more so than with the virial mass assumptions). However, for a given flavor of halo model, there is always a strong correlation between and (the – trend is weaker). We quantify this correlation for each model with a log–log fit, reporting the best-fit parameters in Table 1 (also plotted in Figure 2 for the two reference models333We note that a log–log fit although crude is a good approximation of the trends in Fig. 2.); the typical relation is .
| Model | ||
|---|---|---|
| –(M+10) | ||
| –(M+10) + AC (G+04) | ||
| –(M+10) + AC (A+10) | ||
| –(M+10) + AC (B+86) | ||
| –(M+10) - WMAP3 | ||
| no DM | ||
| CDM (S+11) | ||
| (S+11) | ||
| (S+11) | ||
| (S+11) |
Other models of potential interest are low-density DM cores (Burkert, 1995), and alternatives to DM (e.g., Milgrom 1983). These would imply similar – slopes to our limiting no-DM model. The no-DM assumption produces the uppermost curve in Fig. 2, and is qualitatively consistent with a slightly expanded NFW model. The same results, using the same dataset, but somewhat different mass modeling assumptions, have been anticipated in Tortora et al. (2012).
One could alter these slopes with additional model-tuning; e.g., with strong-AC at high- and halo expansion at low-, one could completely flatten out the trend. On the other hand, decreasing the AC at the high and increasing the strength of the AC toward lower would make the trend even steeper. We currently have no a priori motivation for either direction for the AC variations, thus we cannot argue in favor of a IMF universality for the former case nor for a very strong IMF non universality in the latter one.
We next examine the overall IMF normalization, with the no-AC-NFW and AC-NFW cases bracketing the most plausible range of models. For reference, we show predictions for several standard IMFs (Salpeter, Kroupa, Chabrier). We note that at a fixed IMF, age, and metallicity, the and values are uniquely predicted, but the reverse is not true. A given result can imply multiple IMF solutions, particularly if one allows for mass-functions more complicated than a pure power-law.
If we adopt a no-AC-NFW model, a MW-like IMF is implied for low- galaxies, and a Salpeter IMF for high-. For AC-NFW, the low- galaxies have sub-MW IMFs, and the high- ones have IMFs intermediate to Kroupa and Salpeter.
In all cases, extremely bottom-heavy IMFs (assumed single power-law, ) are ruled out, on average. Even if one assumed no DM, such IMFs would violate the dynamical constraints on the overall mass-to-light ratio.
Although resolving the remaining IMF–DM degeneracy will require more extensive analysis, we carry out a simple exercise to provide initial clues, inspired by Dutton et al. (2012b). As in that paper, we select the galaxies with mean central stellar surface-densities 2500 pc-2, and analyze them the same as the full sample. The rationale is that such galaxies are the most star-dominated, and the least sensitive to DM uncertainties. The results are shown by the gray curves in Figure 2, where as expected, the model curves are closer together. The implied normalization is fairly low – similar to the full-sample AC results. We may then apply this IMF result to the full sample if we assume no additional systematic – correlation (cf. Schulz et al. 2010).
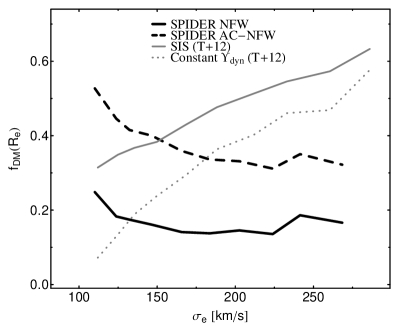
Although this paper is primarily concerned with the IMF, we briefly examine some implications for the central DM content. Our main mass models are, by construction, fully consistent with current expectations for CDM halo profiles, while also agreeing with the observations for a plausible IMF range ( 0.5–2.0).
We show the implied within 1 in Figure 3. We find fairly universal values of and for the no-AC-NFW and AC-NFW models, respectively. These results are not altered appreciably in the alternative models explored above. Note also that the high- test above prefers the AC-NFW model.
The Figure also shows that if we adopted a constant IMF, then we would infer a strong increase of with . Such behavior has been invoked as the driver for the “tilt” of the ETG fundamental plane (see Tortora et al. 2009 and references therein), but now with renewed comparison to realistic DM halo models, we find that the tilt is driven in part by the IMF. Put differently, the observed – relation is too steep to explain through standard DM models, and requires an additional factor.
4. Literature comparisons
We now compare our SPIDER-based results with an inventory of other literature results for ETGs in Figure 4 and late-type galaxies in Figure 5.
4.1. Early-type galaxies
We discuss the results for ETGs in Figure 4, starting with those studies that used similar hybrid approaches, comparing SPS-mass estimates to total mass using dynamics or lensing. Rather than exhaustively comparing all such results, we will focus on the studies that explicitly derived for large samples of low- ETGs.
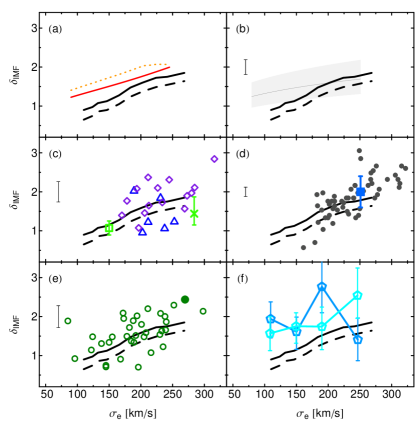
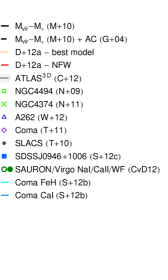
The study most closely related to ours is Dutton et al. (2012a), who analyzed SDSS data for ETGs (colors and , with SPSJeans modeling). Their sample was much larger but without the Sérsic models and near-infrared photometry from SPIDER. Their results for a no-AC-NFW model are shown as a dotted orange curve in panel (a), which is reassuringly similar to our no-AC-NFW result, with the 30% residual difference in illustrating the level of systematic uncertainties for a fixed dataset and method. Although a conclusive answer on the origin of this discrepancy is not available, we have found that shallower light profiles (as may be equivalent to the combination of the and profiles in Dutton et al. 2012a) produce larger . Finally, the solid line shows their refined result from a multi-parameter fit: they find DM halos that are slightly expanded, and consequently a slightly heavier IMF.
In panel (b) we show results from the ATLAS3D survey of nearby ETGs, using both spectroscopically-based SPS models and detailed two-dimensional Jeans dynamical analyses (Cappellari et al., 2012b, where we show their no-AC-NFW results). As with SPIDER, the ATLAS3D project found that the overall normalization was degenerate to the DM assumptions, but the trend with was robust. Direct comparison in Figure 4 reveals that these results are consistent with SPIDER within the errors, which is also the case for an earlier study of ETGs with SAURON (Cappellari et al., 2006) and for an analysis of high- galaxies (Cappellari et al., 2009).
Panel (c) shows results from Thomas et al. (2011) and Wegner et al. (2012), who carried out spectroscopic SPS and detailed orbit-modeling of ETGs found in clusters (including Coma), using a variety of mass models (constant-, no-AC-NFW, and cored halos). We see no systematic difference between the results obtained with different mass models. A systematic offset in between the two studies is found, but overall, the results are consistent with our no-AC-NFW results, both in amplitude and in slope.
Panel (d) shows gravitational lensing results, primarily from the SLACS survey of ETGs (Treu et al., 2010), using no-AC-NFW models as well as color-based SPS models and stellar-dynamics constraints. Their normalization agrees well overall with ours, but their slope is somewhat steeper.444Not all of the analyses of the SLACS data performed by non-SLACS teams agree about the IMF conclusions. But we note that our own analysis in Tortora et al. (2010) agrees with the SLACS-team analysis. Note also that the SPIDER and SLACS samples are selected on luminosity and velocity dispersion, respectively.
Our results, along with the four hybrid studies from the literature, all suggest that the IMF of ETGs varies from MW-like at low to Salpeter-like at high , modulo some lingering uncertainties from the DM–IMF degeneracy.
In addition to the large-sample studies, we examine a few key single-galaxy results. These include extended kinematics data with NFW-based modeling (Napolitano et al., 2009, 2011), as shown in panel (c), and the “Jackpot” double lens (Sonnenfeld et al., 2012), in panel (d), and all look consistent with the trend from SPIDER.
Our culminating comparisons are with a completely different set of results, based purely on modeling of IMF-sensitive spectral lines (see Section 1). Most of these lines are susceptible to degeneracies with elemental abundances (e.g., sodium or calcium), and we consider only those studies that have directly accounted for such effects.
We first show in panel (e) the results from CvD12. They fitted spectral features across a wide wavelength range, focusing on the IMF indicators Na I, Ca II, and the Wing–Ford band, while adopting a broken-power-law IMF form and fitting for the relevant elemental abundances. Their inferred values turn out to agree well with both the normalization and the trend versus from the SPIDER results (for the no-AC-NFW models in particular)555CvD12 compared their results to total dynamical values from SAURON in order to check that they did not violate those constraints. However, they did not compare to decomposed dynamical inferences for consistency as we do here.. Recalling that the high values from hybrid studies could be due to either a bottom-heavy (extra dwarfs) or a top-heavy (extra remnants) IMF, the CvD12 results agree with only the first solution.
Note that the apertures probed here are different: for CvD12, and 0.3–0.7 for SPIDER (decreasing with ). The close agreement of the results on average thus implies that the IMF does not vary spatially on these scales, or that the AC model is the correct solution, and decreases with galactocentric radius, which is plausible (e.g., Carter et al. 1986; see also Fig. 13 of CvD12).
Panel (f) shows results from Smith et al. (2012), who studied a large sample of Coma-cluster ETGs. They used the same SPS models as CvD12 to fit near-infrared spectroscopic line-indices, analyzing the Wing–Ford band and the Ca I line separately. The former line was susceptible to uncertainties in the Na abundance, but not the latter. We have converted their results to inferred by straightforward interpolation between the Chabrier, Salpeter, and models in their figure 10. The final results are somewhat noisy and uncertain, but imply an overall Salpeter-like normalization, and no obvious trend with . This agrees with all the aforementioned results at high-, but not at low-. It is possible that these Coma-cluster galaxies are genuinely different. As environmental classification is part of the SPIDER dataset (La Barbera et al. 2010a; La Barbera et al. 2010c; Tortora et al. 2012), we have investigated the impact of environment on our results and found very little effect on . But we also have very few cluster galaxies in our sample and a definitive comparison with those Coma-cluster results is not possible.
Spiniello et al. (2012) analyzed NaD, Na I, and TiO2 lines in SDSS spectra of ETGs with km s-1, comparing to the same SPS models as CvD12. They inferred a Salpeter-like IMF at low , which is consistent with SPIDER. At high , they inferred , which would imply and violate the total mass constraints both from SPIDER and from the lens galaxy that these authors also studied. This conflict suggests either further work is needed on the line-index modeling, or the IMF shape deviates from a simple power-law.
An ideal comparison with our SPIDER results would be the work of Ferreras et al. (2012), who analyzed Na I and TiO line-strengths from the SPIDER parent dataset. Although they did not provide values that we could compare to our results, their illustrative trends versus (at fixed metallicity and age) are qualitatively similar. They also demonstrated that the inferences in their approach could depend strongly on the detailed shape assumed for the IMF.
4.2. Late-type galaxies
It would also be fascinating to see whether or not bulges/disks follow the same – trends as ETGs. Unfortunately, although direct inferences from star counts are possible in the Milky Way and nearby galaxies, the literature in the field is not sufficient to investigate with accuracy IMF variations with mass or , if any. However, it appears that a general consensus is arising within the community, which points to Kroupa/Chabrier type. In general, IMF looks similar in the field, dense massive clusters and diffuse low density star-forming regions, with some deviations observed in a handful of other regions (see Bastian et al. 2010 and Kroupa et al. 2011 for a review of the main results). Analysis of masses above have been performed in nearby galaxies (for instance the irregular LMC, the dwarf SMC and the spiral M33), ruling out strong IMF variations. Similarly, starburst galaxies and their embedded young massive clusters imply no IMF variation and no influence of the local environment.
Such analyses provide only limited information on a restricted sample of galaxies. However, in the recent years, similarly to the ETGs case, studies of variations with galaxy mass have been accumulating. For example, Falcón-Barroso et al. (2003) found that bulges of spirals showed anti-correlations between and Ca II line-strengths, similar to ETGs, but they could not determine if this was an IMF effect.
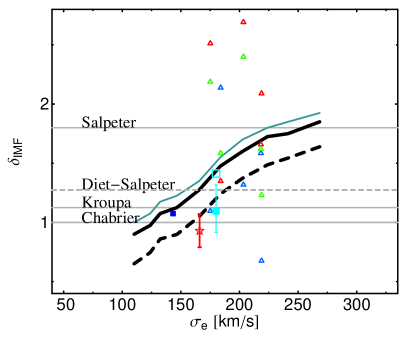
We have attempted to investigate further, using inferences for bulges and disks from the literature (e.g., de Blok et al. 2008; F+10; Barnabè et al. 2012, B+12; CvD12; D+12c). This comparison is shown in Figure 5.
Using bulges from de Blok et al. (2008) we find that correlates with stellar mass, giving hints of an ETG-like – correlation, but we also find the same for the disks, which would be peculiar. Note that initial results on dynamical masses of nearby spiral disks suggest (Bershady et al. 2011; Westfall et al. 2011).
We show the results for a sample of five massive spiral galaxies from Dutton et al. (2012c), who found a) stellar mass carrying out a photometric SPS and b) an independent IMF estimate, using strong gravitational lensing and gas kinematics. The apparent scatter for both bulges and disks is enormous, suggesting more work is needed to address the systematic errors, and to understand any additional trends with detailed morphology. However, the IMF normalization is higher in the bulges than in the disks.
A similar analysis has been performed in B+12 (updating the results in Dutton et al. 2011) where gravitational lensing, gas rotation curve and stellar kinematics for the lens galaxy SDSS J2141-0001 are used. They found a which is fully consistent with an intermediate-normalization IMF (in between a Salpeter and a Chabrier IMF), but taking into account the expected cold gas fraction (which had not been included in the fitting procedure) they find lower , agreeing with a Chabrier/Kroupa IMF. A bottom-light IMF is also found by F+10, who analyzed the strong lensing features of the Einstein Cross (Q2237+0305), and Conroy & van Dokkum (2012) using spectral lines in the nuclear bulge of M31.
5. Discussion and conclusions
We have analyzed the dynamics and stellar populations of a large sample of ETGs from the SPIDER project, and found compelling evidence for heavier IMFs in the central regions of higher- galaxies. The IMF mismatch relative to Chabrier is 0.5–1.1 at 125 km s-1, and 1.2–1.8 at at 250 km s-1. The – trend is robust to a wide set of modeling assumptions, and accounts for much of the tilt in the fundamental plane. The distribution of DM is degenerate with the overall IMF normalization and difficult to constrain, and therefore we have assumed that any halo contraction is invariant with . Some ways to break the degeneracy between IMF and halo contraction are to a) analyze cases with extended velocity dispersion or X-ray emission profiles (e.g., Napolitano et al. 2009, 2011), or b) incorporate complementary data from strong/weak gravitational lensing (e.g. Auger et al. 2010). However, we have argued that the only way to preserve the IMF universality is to allow for halo contraction at high- and halo expansion at low-.
We have performed the first general inventory of IMF results from a variety of studies in the literature, using both pure and hybrid techniques, and found that these generally agree well with our SPIDER results. There is remarkably widespread agreement on a Salpeter-like IMF for massive ETGs ( 200 km s-1). At lower , the data are still somewhat limited and the different results have not yet converged, but most of the studies point to MW-like IMFs. Agreement on a super-Salpeter IMF in the most massive galaxies ( 275 km s-1) is also not yet universal.
These results appear to be fully compatible with underlying CDM halos. However, more detailed conclusions about halo contraction or expansion are still elusive, and the data on galaxy centers do not clearly rule out alternative DM models once the variable IMF is accounted for.
More work is clearly needed to understand the systematics in the different analyses; to build up better statistics on a wide range of galaxy types, environments, and redshifts; and to determine which parameters correlate best with IMF variations (e.g., metallicity or starburst intensity; CvD12; Smith et al. 2012). It may also be particularly helpful to venture beyond the centers of galaxies, using data from a wide baseline in radius to help break the IMF–DM degeneracies.
It appears we are nearing convergence on determining what the basic components of galaxies are (distributions of stars and DM). The next challenge will be to understand why these arrive at their distributions. What drives the power-spectrum in cloud fragmentation and star formation? How do baryonic processes interact with and re-shape their surrounding DM halos?
References
- Abadi et al. (2010) Abadi, M. G., Navarro, J. F., Fardal, M., Babul, A., & Steinmetz, M. 2010, MNRAS, 407, 435, (A+10)
- Auger et al. (2010) Auger, M. W., Treu, T., Gavazzi, R., et al. 2010, ApJ, 721, L163
- Barnabè et al. (2012) Barnabè, M., Dutton, A. A., Marshall, P. J., et al. 2012, MNRAS, 423, 1073, (B+12)
- Bastian et al. (2010) Bastian, N., Covey, K. R., & Meyer, M. R. 2010, ARA&A, 48, 339
- Bell & de Jong (2001) Bell, E. F., & de Jong, R. S. 2001, ApJ, 550, 212
- Bershady et al. (2011) Bershady, M. A., Martinsson, T. P. K., Verheijen, M. A. W., et al. 2011, ApJ, 739, L47
- Blumenthal et al. (1986) Blumenthal, G. R., Faber, S. M., Flores, R., & Primack, J. R. 1986, ApJ, 301, 27, (B+86)
- Brewer et al. (2012) Brewer, B. J., Dutton, A. A., Treu, T., et al. 2012, MNRAS, 422, 3574
- Bruzual & Charlot (2003) Bruzual, G., & Charlot, S. 2003, MNRAS, 344, 1000
- Burkert (1995) Burkert, A. 1995, ApJ, 447, L25
- Cappellari et al. (2006) Cappellari, M., Bacon, R., Bureau, M., et al. 2006, MNRAS, 366, 1126, (C+06)
- Cappellari et al. (2009) Cappellari, M., di Serego Alighieri, S., Cimatti, A., et al. 2009, ApJ, 704, L34
- Cappellari et al. (2012a) Cappellari, M., McDermid, R. M., Alatalo, K., et al. 2012a, Nature, 484, 485
- Cappellari et al. (2012b) —. 2012b, MNRAS, submitted, arXiv:1208.3523, (C+12)
- Carter et al. (1986) Carter, D., Visvanathan, N., & Pickles, A. J. 1986, ApJ, 311, 637
- Cenarro et al. (2003) Cenarro, A. J., Gorgas, J., Vazdekis, A., Cardiel, N., & Peletier, R. F. 2003, MNRAS, 339, L12
- Chabrier (2003) Chabrier, G. 2003, PASP, 115, 763
- Conroy & van Dokkum (2012) Conroy, C., & van Dokkum, P. G. 2012, ApJ, 760, 71
- de Blok et al. (2008) de Blok, W. J. G., Walter, F., Brinks, E., et al. 2008, AJ, 136, 2648
- de Vaucouleurs (1948) de Vaucouleurs, G. 1948, Annales d’Astrophysique, 11, 247
- Dutton et al. (2012a) Dutton, A. A., Maccio’, A. V., Mendel, J. T., & Simard, L. 2012a, MNRAS, submitted, arXiv:1204.2825, (D+12a)
- Dutton et al. (2012b) Dutton, A. A., Mendel, J. T., & Simard, L. 2012b, MNRAS, 422, L33
- Dutton et al. (2011) Dutton, A. A., Brewer, B. J., Marshall, P. J., et al. 2011, MNRAS, 417, 1621
- Dutton et al. (2012c) Dutton, A. A., Treu, T., Brewer, B. J., et al. 2012c, MNRAS, in press, arXiv:1206.4310, (D+12c)
- Falcón-Barroso et al. (2003) Falcón-Barroso, J., Peletier, R. F., Vazdekis, A., & Balcells, M. 2003, ApJ, 588, L17
- Ferreras et al. (2012) Ferreras, I., La Barbera, F., de Carvalho, R. R., et al. 2012, MNRAS, in press, arXiv:1204.3823
- Ferreras et al. (2008) Ferreras, I., Saha, P., & Burles, S. 2008, MNRAS, 383, 857
- Ferreras et al. (2010) Ferreras, I., Saha, P., Leier, D., Courbin, F., & Falco, E. E. 2010, MNRAS, 409, L30, (F+10)
- Gnedin et al. (2004) Gnedin, O. Y., Kravtsov, A. V., Klypin, A. A., & Nagai, D. 2004, ApJ, 616, 16, (G+04)
- Grillo (2010) Grillo, C. 2010, ApJ, 722, 779
- Grillo & Gobat (2010) Grillo, C., & Gobat, R. 2010, MNRAS, 402, L67
- Kroupa (2001) Kroupa, P. 2001, MNRAS, 322, 231
- Kroupa et al. (2011) Kroupa, P., Weidner, C., Pflamm-Altenburg, J., et al. 2011, ArXiv e-prints
- La Barbera et al. (2010a) La Barbera, F., de Carvalho, R. R., de La Rosa, I. G., & Lopes, P. A. A. 2010a, MNRAS, 408, 1335
- La Barbera et al. (2010b) La Barbera, F., de Carvalho, R. R., de La Rosa, I. G., et al. 2010b, MNRAS, 408, 1313
- La Barbera et al. (2008) La Barbera, F., de Carvalho, R. R., Kohl-Moreira, J. L., et al. 2008, PASP, 120, 681
- La Barbera et al. (2010c) La Barbera, F., Lopes, P. A. A., de Carvalho, R. R., de La Rosa, I. G., & Berlind, A. A. 2010c, MNRAS, 408, 1361
- Macciò et al. (2008) Macciò, A. V., Dutton, A. A., & van den Bosch, F. C. 2008, MNRAS, 391, 1940
- Milgrom (1983) Milgrom, M. 1983, ApJ, 270, 371
- Moster et al. (2010) Moster, B. P., Somerville, R. S., Maulbetsch, C., et al. 2010, ApJ, 710, 903, (M+10)
- Napolitano et al. (2010) Napolitano, N. R., Romanowsky, A. J., & Tortora, C. 2010, MNRAS, 405, 2351
- Napolitano et al. (2009) Napolitano, N. R., Romanowsky, A. J., Coccato, L., et al. 2009, MNRAS, 393, 329, (N+09)
- Napolitano et al. (2011) Napolitano, N. R., Romanowsky, A. J., Capaccioli, M., et al. 2011, MNRAS, 411, 2035, (N+11)
- Navarro et al. (1996) Navarro, J. F., Frenk, C. S., & White, S. D. M. 1996, ApJ, 462, 563
- Salpeter (1955) Salpeter, E. E. 1955, ApJ, 121, 161
- Schneider et al. (2012) Schneider, A., Smith, R. E., Macciò, A. V., & Moore, B. 2012, MNRAS, 424, 684, (S+12a)
- Schulz et al. (2010) Schulz, A. E., Mandelbaum, R., & Padmanabhan, N. 2010, MNRAS, 408, 1463
- Smith et al. (2012) Smith, R. J., Lucey, J. R., & Carter, D. 2012, MNRAS, 426, (S+12b)
- Sonnenfeld et al. (2012) Sonnenfeld, A., Treu, T., Gavazzi, R., et al. 2012, ApJ, 752, 163, (S+12c)
- Spiniello et al. (2011) Spiniello, C., Koopmans, L. V. E., Trager, S. C., Czoske, O., & Treu, T. 2011, MNRAS, 417, 3000
- Spiniello et al. (2012) Spiniello, C., Trager, S. C., Koopmans, L. V. E., & Chen, Y. P. 2012, ApJ, 753, L32
- Suyu et al. (2012) Suyu, S. H., Hensel, S. W., McKean, J. P., et al. 2012, ApJ, 750, 10
- Swindle et al. (2011) Swindle, R., Gal, R. R., La Barbera, F., & de Carvalho, R. R. 2011, AJ, 142, 118
- Thomas et al. (2011) Thomas, J., Saglia, R. P., Bender, R., et al. 2011, MNRAS, 415, 545, (T+11)
- Tortora et al. (2012) Tortora, C., La Barbera, F., Napolitano, N. R., de Carvalho, R. R., & Romanowsky, A. J. 2012, MNRAS, 425, 577
- Tortora et al. (2009) Tortora, C., Napolitano, N. R., Romanowsky, A. J., Capaccioli, M., & Covone, G. 2009, MNRAS, 396, 1132
- Tortora et al. (2010) Tortora, C., Napolitano, N. R., Romanowsky, A. J., & Jetzer, P. 2010, ApJ, 721, L1
- Treu et al. (2010) Treu, T., Auger, M. W., Koopmans, L. V. E., et al. 2010, ApJ, 709, 1195, (T+10)
- van Dokkum & Conroy (2010) van Dokkum, P. G., & Conroy, C. 2010, Nature, 468, 940
- Wegner et al. (2012) Wegner, G. A., Corsini, E. M., Thomas, J., et al. 2012, AJ, 144, 78, (W+12)
- Westfall et al. (2011) Westfall, K. B., Bershady, M. A., Verheijen, M. A. W., et al. 2011, ApJ, 742, 18