Searching for Massive Outflows in Holmberg IX X-1 and NGC 1313 X-1: The Iron K Band
Abstract
We have analysed all the good quality XMM-Newton data publicly available for the bright ULXs Holmberg IX X-1 and NGC 1313 X-1, with the aim of searching for discrete emission or absorption features in the Fe K band that could provide observational evidence for the massive outflows predicted if these sources are accreting at substantially super-Eddington rates. We do not find statistically compelling evidence for any atomic lines, and the limits that are obtained have interesting consequences. Any features in the immediate Fe K energy band (6–7 ) must have equivalent widths weaker than 30 eV for Holmberg IX X-1, and weaker than 50 eV for NGC 1313 X-1 (at 99 per cent confidence). In comparison to the sub-Eddington outflows observed in GRS 1915+105, which imprint iron absorption features with equivalent widths of 30 eV, the limits obtained here appear quite stringent, particularly when Holmberg IX X-1 and NGC 1313 X-1 must be expelling at least 5–10 times as much material if they host black holes of similar masses. The difficulty in reconciling these observational limits with the presence of strong line-of-sight outflows suggests that either these sources are not launching such outflows, or that they must be directed away from our viewing angle.
keywords:
X-rays: binaries – black hole physics1 Introduction
Ultraluminous X-ray Sources (ULXs) are extra-nuclear point sources in external galaxies observed to be more luminous in X-rays than the Eddington luminosity for a stellar mass (10) black hole ( erg s-1); on rare occasions ULX luminosities have been observed to exceed erg s-1 (Walton et al. 2011b; Sutton et al. 2012) and even to reach as high as erg s-1 (Farrell et al. 2009). This combination has led to extended debate over the nature of these sources. The majority of early theories were based around either the presence of intermediate mass black holes (IMBHs: ; Colbert & Mushotzky 1999), super-Eddington accretion states for standard mass binary systems (e.g. Poutanen et al. 2007, Finke & Böttcher 2007) or the inferred luminosities being artificially high due to anisotropic emission (King et al. 2001), although observations of excited emission lines, typically He II 4686, from either the accretion disc of the ULX or its surrounding nebula appear to rule out highly beamed emission via photon counting arguments (e.g. Pakull & Mirioni 2002, Kaaret et al. 2004, and Berghea et al. 2010).
More recently, proposed interpretations for bright ULXs ( erg s-1) tend to incorporate elements from each of these three ideas, invoking black holes only slightly larger than those seen in Galactic binary systems ( 100 ) with mildly super-Eddington accretion rates (luminosities up to a few times ), such that the accretion disc is geometrically thicker than the standard thin discs predicted for more moderate accretion rates (Shakura & Sunyaev 1973) and forces some mild anisotropy (‘slim’ discs; see e.g. Abramowicz et al. 1980). For recent reviews on the observational status and the potential nature of ULXs see Roberts (2007) and Feng & Soria (2011).
| Source | RA | DEC | OBSID | Obs. Date | Duration | Good Exposure | ||
|---|---|---|---|---|---|---|---|---|
| (h:m:s) | (d:m:s) | (Mpc) | (ks) | (EPIC-pn; ks) | ||||
| Holmberg IX X-1 | 09:57:53.2 | +69:03:48.3 | 3.55 | 0.000153 | 0112521001 | 10/04/2002 | 11 | 7 |
| 0112521101 | 16/04/2002 | 12 | 8 | |||||
| 0200980101 | 26/09/2004 | 119 | 88 | |||||
| NGC 1313 X-1 | 03:18:20.0 | -66:29:11.0 | 3.7 | 0.001568 | 0106860101 | 17/10/2000 | 42 | 27 |
| 0150280601 | 08/01/2004 | 55 | 10 | |||||
| 0150181101 | 16/01/2004 | 9 | 6 | |||||
| 0205230201 | 01/05/2004 | 13 | 3 | |||||
| 0205230301 | 05/06/2004 | 12 | 9 | |||||
| 0205230601 | 07/02/2005 | 14 | 10 | |||||
| 0405090101 | 15/10/2006 | 123 | 99 |
One of the observational results in recent X-ray studies of ULXs that has sparked significant interest is that many of these sources display curvature in their X-ray continuum above 3 (Stobbart et al. 2006; Gladstone et al. 2009; Walton et al. 2011a). Although some of these are lower luminosity sources that display (hot) thermal disc-like spectra, in which high energy curvature would naturally be expected, even the brighter ULXs with two apparently distinct emission components, potentially analogous to the disc and Comptonised corona observed in Galactic black hole binaries (BHBs), also appear to show curvature in their high energy components. The hard, Comptonised emission rarely displays similar curvature in the standard sub-Eddington accretion states of BHBs (for a recent review see Remillard & McClintock 2006), and if this is an intrinsic difference in the high energy continuum, it could imply that there are fundamental differences between the accretion onto ULXs and their lower luminosity BHB cousins. Given that the basic accretion geometry is not expected to evolve with black hole mass, this might indirectly suggest we are not viewing sub-Eddington accretion.
In this high-Eddington framework, Gladstone et al. (2009) propose that the high energy curvature could be due to Comptonisation in an optically thick corona, which shrouds the inner accretion disc. The effect of the corona causes the observed temperature of the disc (identified here with the soft component) to appear artificially low as only the outer disc is observed directly. Low disc temperatures have frequently been inferred for bright ULXs, which if otherwise associated with the inner disc would imply the presence of IMBHs (see e.g. Miller et al. 2004). This interpretation has been slightly modified by Middleton et al. (2011), who propose that the cool, quasi-thermal emission previously associated with the disc is instead thermalised emission from a photosphere associated with the base of an outflowing wind, as strong outflows are ubiquitously predicted by models for high and particularly super-Eddington accretion (see Ohsuga & Mineshige 2011, and references therein).
Galactic BHBs frequently display evidence for mass outflows, which at moderately high accretion rates (during the thermal dominated states) take the form of equatorial disc winds with outflow velocities . Prominent examples are the BHBs GRO J1655-40 (Miller et al. 2006; Díaz Trigo et al. 2007) and GRS 1915+105 (Kotani et al. 2000; Lee et al. 2002; Ueda et al. 2009; Neilsen & Lee 2009). When these outflows impinge upon our line of sight to the central source, their observational consequence is to imprint absorption features onto the intrinsic X-ray continuum, typically in the form of narrow absorption lines from highly ionised species, with the most prominent features arising from the transitions of highly ionised iron (Fe XXV and/or XXVI). In the case of GRS 1915+105, perhaps the best studied BHB outflow, Neilsen & Lee (2009) show that the strength of the absorption features generally increases as the luminosity of the source, and hence its Eddington ratio increases. The mass of this source is relatively well known ( = ; Greiner et al. 2001), and it is observed to radiate up to, and possibly slightly in excess of its Eddington limit (Vierdayanti et al. 2010). While the geometry of the BHB disc winds observed at moderate accretion rates are largely equatorial, the scale height of these winds is generally expected to increase with Eddington ratio (see e.g. Abramowicz 2005, King 2009), so at higher accretion rates the outflows should probably cover a larger solid angle.
If instead, super-Eddington outflows are present in ULXs but, despite their potential large scale heights, do not occur along our line of sight, rather than viewing absorption features we should instead observe reprocessed emission from the material in the outflow. Indeed, reprocessed emission lines consistent with neutral (or moderately ionised) iron are seen ubiquitously in the spectra of Galactic high mass X-ray binaries (HMXBs; see Torrejón et al. 2010), which are expected to accrete largely from the stellar winds launched by their massive companions. Furthermore, the majority of ULXs themselves are widely expected to be HMXB analogues, owing to the their apparent correlation with recent star formation (Swartz et al. 2009). Recent population studies of ULXs appear to support this picture, as their luminosity function appears consistent with being a smooth extrapolation of the HMXB luminosity function (at least for sources in spiral/irregular type galaxies; Grimm et al. 2003, Walton et al. 2011b, Swartz et al. 2011).
Here, we present an analysis of the Fe K band for two bright ( erg s-1) ULXs with hard X-ray spectra, Holmberg IX X-1 (also known as M 81 X-9) and NGC 1313 X-1, in which we search for evidence of atomic iron features that could be associated with outflowing material. These sources have been selected as they represent the datasets with the highest quality data at high energies for such bright, isolated ULXs. The paper is structured as follows: section 2 describes our data reduction prodecure, and section 3 describes the analysis performed. We discuss our results in section 4 and summarise our conclusions in section 5.
2 Observations and Data Reduction
| Source | Obs. | (/d.o.f.) | ||||
|---|---|---|---|---|---|---|
| ( cm-2) | (keV) | (keV) | ||||
| Holmberg IX X-1 | Combined | 1.08 (1998/1851) | ||||
| 0200980101 | 1.02 (1804/1762) | |||||
| NGC 1313 X-1 | Combined | 1.16 (1867/1608) | ||||
| 0405090101 | 1.08 (1415/1305) |
In this work we make use of all the publically available XMM-Newton observations with good EPIC-pn (Strüder et al. 2001) and EPIC-MOS (Turner et al. 2001 spectra of the two bright ULXs considered, Holmberg IX X-1 and NGC 1313 X-1. In the latter case, there are a number of observations pointed at NGC 1313 X-2 in which X-1 fell on a chip gap in one or more of the XMM-Newton detectors which were not included in our analysis. In addition, we only consider observations in which the respective sources are detected reliably above background up to 10 . Data reduction was carried out with the Science Analysis System (SAS v11.0.0) largely according to the standard prescription provided in the online guide111http://xmm.esac.esa.int/.
Observation data files were processed using EPCHAIN and EMCHAIN to produce calibrated event lists for the EPIC-pn and EPIC-MOS detectors respectively. Spectra were produced separately for each observation by selecting only single and double events (single to quadruple events) for EPIC-pn (EPIC-MOS) using XMMSELECT, and periods of high background were treated according to the method outlined by Piconcelli et al. (2004) with the signal-to-noise ratio maximised for the full energy band considered (0.3–10.0 ). Circular source regions were used, and although the exact size varied from observation to observation depending on the location of chip gaps, etc. these were typically of radius 30–40”. Larger circular regions typically of radius 50” and 75” free of other sources and on the same CCD as the ULX were selected in order to sample the background for the EPIC-pn and EPIC-MOS detectors respectively. Redistribution matrices and auxiliary response files were generated with RMFGEN and ARFGEN. After performing the data reduction separately for each of the observations, the spectra were then combined using the FTOOL222http://heasarc.nasa.gov/ftools/ftools_menu.html ADDSPEC in order to maximise the data quality in the Fe K band. Finally, EPIC-pn and EPIC-MOS spectra were re-binned using GRPPHA to have a minimum of 25 counts in each energy bin, so that the probability distribution of counts within each bin can be considered Gaussian, and hence the use of the statistic is appropriate when performing spectral fits.
The observations that met our selection criteria and are hence included in our analysis are listed in Table 1; the resulting good exposure times obtained in the stacked spectra are 103 and 238 ks with the EPIC-pn and combined EPIC-MOS detectors respectively for Holmberg IX X-1, and 162 and 381 ks for NGC 1313 X-1, although these are largely dominated by the single full orbit observations available for each source (contributing 88/200 ks to the EPIC-pn/EPIC-MOS spectra of Holmberg IX X-1, and 90/215 ks to the spectra of NGC 1313 X-1 respectively).
3 Spectral Analysis
Throughout this work, spectral modelling is performed with XSPEC v12.7.0r (Arnaud 1996), and all quoted uncertainties are the 90 per cent confidence limits for a single parameter of interest, unless stated otherwise. In the following, Holmberg IX X-1 and NGC 1313 X-1 are modelled over the full 0.3–10.0 energy range. The EPIC-pn and EPIC-MOS spectra are modelled simultaneously with all parameters tied between the two spectra, although we do include a multiplicative constant in the EPIC-MOS spectrum in order to account for possible cross-calibration uncertainties between the detectors. This value is always found to be within 10 per cent of unity.
3.1 Continuum Model
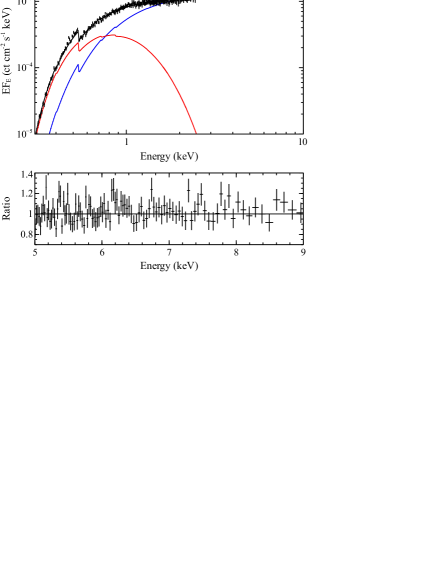
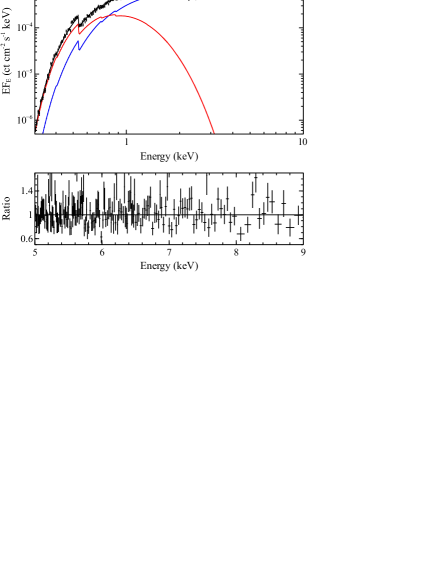
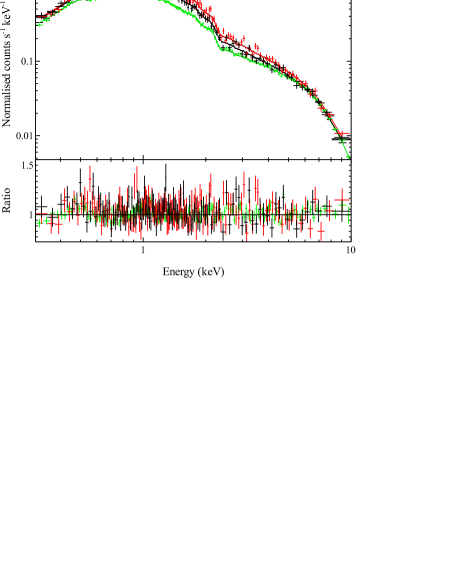
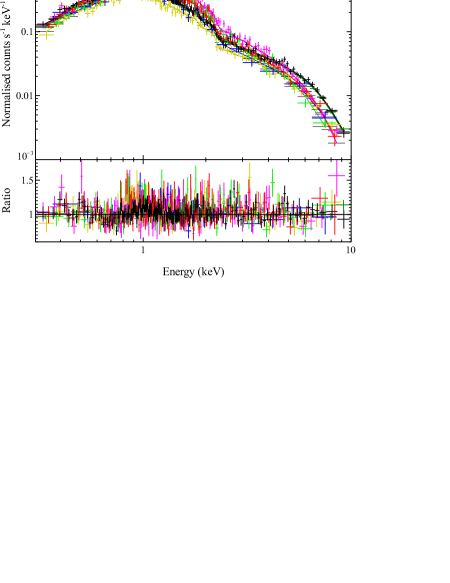
We begin by modelling the stacked spectra of these sources with a simple phenomenological interpretation of the ultraluminous state concept, including a cool disc (DISKPN ; Gierliński et al. 1999) to model the soft component and cool, optically thick thermal Comptonisation (COMPTT; Titarchuk 1994) to model the curvature of the hard component. The inner radius of the disc is fixed at 6 (= GM/c2) and the seed photon temperature for COMPTT is linked to the inner temperature of the disc. Both components are modified by neutral absorption with solar abundances (TBABS; Wilms et al. 2000). The overall quality of fit obtained over the full 0.3–10.0 band is generally fairly good, with = 1998/1851 and 1867/1608 for the stacked spectra of Holmberg IX X-1 and NGC 1313 X-1 respectively, but if we focus on the quality of fit obtained with these models (without refitting) at higher energies (2–10 ) we find it to be much improved, with = 1429/1394 and 1218/1151. We therefore conclude that the continuum is well modelled over the energy band of interest for this study (5–9 ) for both sources, see Fig. 1. The results obtained for the key continuum parameters are quoted in Table 2. For comparison, we also repeat our analysis for the long observations of each source separately; we obtain good agreement with the results initially presented in Gladstone et al. (2009).
To confirm whether it is reasonable to combine the individual observations into a single spectrum, we also apply this continuum model to each of the observations individually. For each source we model all the individual observations considered simultaneously, requiring that the neutral absorption remains the same for each observation, but allowing the other key parameters to vary (see Appendix A for full details). The key parameters obtained for each of the observations are all quite similar, therefore we conclude it is reasonable to combine the observations included in this work.
3.2 Fe K Band
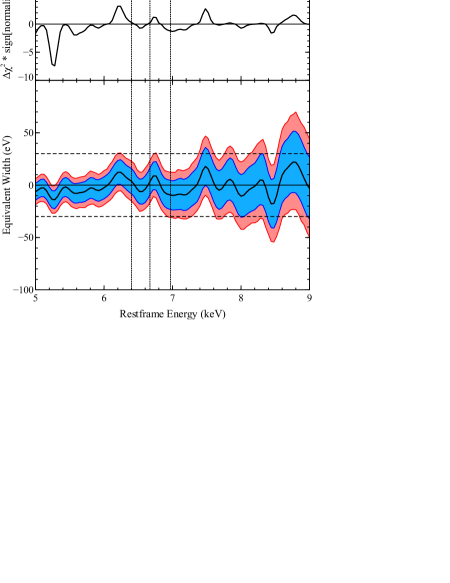
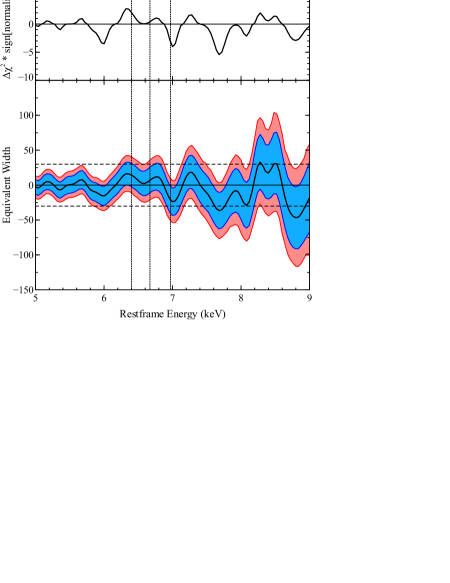
Having successfully reproduced the shape of the continuum for these two sources, we now proceed to search for evidence of narrow iron emission or absorption features which might indicate a large, super-Eddington outflow. We are primarily interested in iron in this work owing to its high cosmic abundance and fluorescent yield, and also owing to the fact that it is difficult to fully ionise. Furthermore, the XMM-Newton response function varies slowly and smoothly over the iron K bandpass. To search for these features, we add a narrow ( eV) Gaussian feature with a normalisation that can either be positive to model potential emission features, or negative to model potential absorption features. The restframe energy of this component (taking into account the redshift adopted for each source, as quoted in Table 1) is systematically varied across the energy range 5–9 in 100 steps, in order to incorporate the key iron transitions and also (generously) allow for any potential blue shifts, as would be expected for absorption features from a strong outflow. This approach is broadly similar to that adopted in the recent works by Tombesi et al. (2010a, b) during their initial search for potential emission and absorption features in the high energy spectra of active galaxies. At each energy increment we record the improvement provided by the inclusion of the Gaussian feature, as well as the equivalent width () of any potential feature at that energy, and its 90 and 99 per cent confidence limits333Note that these are confidence limits on line strength, which are not strictly the same as the upper limits on the strength of lines that should be detected at a given detection confidence level (see Kashyap et al. 2010), but are simpler to calculate in this instance, and should most likely provide more conservative estimates for the maximum strength of any lines intrinsically present.. These are obtained with the EQWIDTH command in XSPEC by generating 10000 parameter sets based on the best fit model and the covariance matrix, which contains information on the parameter uncertainties obtained with this fit, and extracting the 90 and 99 per cent uncertainty limits from the distribution of equivalent width values obtained from each of these parameter sets.
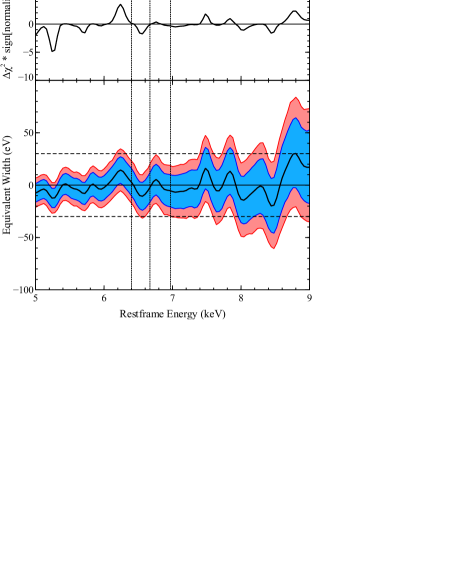
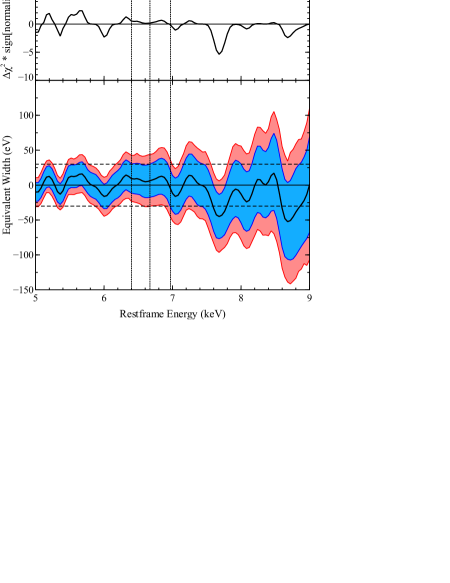
The results obtained for Holmberg IX X-1 and NGC 1313 X-1 are shown in Fig. 2 and Fig. 3 respectively; in each case the left panel displays the results obtained with the stacked spectrum, and the right panel displays the results obtained when considering only the longest observation of the source. The top panels display the improvement as a function of line energy, multiplied by the sign of the normalisation to differentiate between emission and absorption, and the lower panels display the limits on the equivalent widths obtained. For clarity, we highlight the energies of the transitions of neutral iron, iron XXV and iron XXVI with dotted vertical lines. We also show 30 eV with dashed horizontal lines, which roughly represent the strongest absorption features observed in GRS 1915+105 by Neilsen & Lee (2009), although as noted by those authors the values obtained in that work are actually likely to be lower limits owing to their continuum fitting technique, and in GRO J1655-40 by Miller et al. (2006).
First of all, we wish to stress that we have not found any statistically significant detections of any features, either in absorption or in emission. Although a few energies are picked out by our analysis as offering the most improvement, this is never greater than over the energy range considered. Therefore our discussion is restricted to the limits that can be placed instead, although these are interesting to consider in their own right. We find that the data are of sufficient quality to exclude very strong ( eV) iron features in either absorption or emission across a large portion of energy range immediately around the Fe K transitions, although the constraints naturally become less restrictive at very high energies (7.5–8.0 ) as the data quality declines. The high energy data quality is better for Holmberg IX X-1, so the limits that can be placed are strongest in this case, where any persistent atomic features in the spectrum below 7.5 must have an equivalent width less than 30 eV. In the case of NGC 1313 X-1, a moderately strong ( eV) emission feature consistent with neutral iron and absorption feature consistent with iron XXVI are both still permissable. In the following section we discuss the implications of these limits on the potential presence of large outflows and the accretion geometry for these ULXs.
4 Discussion
We have analysed the available XMM-Newton observations for two bright ULXs with hard X-ray spectra, Holmberg IX X-1 and NGC 1313 X-1, with the purpose of searching for direct observational evidence of massive super-Eddington outflows via atomic features in the iron K band. In order to maximise the high energy data quality we stacked the available data with simultaneous EPIC-pn and EPIC-MOS coverage, and proceeded to search for narrow features in either absorption or emission. We do not find any statistically compelling evidence for any narrow features, so instead we examine the limits that can be placed on any features intrinsically present in the spectrum that remain undetected. For comparison we also analyse the full orbit observations available for these two sources separately, which make up 85 and 55 per cent of the total good exposure time analysed for Holmberg IX X-1 and NGC 1313 X-1 respectively. In the latter case the additional observations contribute more significantly to the stacked spectrum, and a more noticable improvement is obtained with their inclusion. However, the results are similar in both cases, and we focus our discussion on the limits obtained with the stacked spectra.
4.1 Absorption Lines
First we consider the limits that can be placed on persistent absorption features, given the strong outflows expected from super-Eddington accretion. For Holmberg IX X-1 any absorption features in the immediate Fe K band (6–7 ) must have an equivalent width less than 30 eV, based on the more conservative 99 per cent limits obtained. The constraints are not so strong for NGC 1313 X-1, where an absorption feature consistent with Fe XXVI could potentially still have an equivalent width of up to 50 eV. The implication is that any line-of-sight outflows present cannot have any greater impact on the spectrum of Holmberg IX X-1 than the strongest sub-Eddington Galactic BHB outflows, observed in GRS 1915+105 and GRO J1655–40, and can only have at most a moderately stronger impact for NGC 1313 X-1. Furthermore, we also draw attention to the outflow in the Galactic BHB candidate IGR J17091–3624 (King et al. 2012). This source displays strong similarities to GRS 1915+105 (Altamirano et al. 2011), and though its distance and mass are not currently known, through this comparison it has tentatively been suggested that it could also be emitting at close to, or even in excess of its Eddington limit. Although the statistical significances of the iron features in this source are not particularly high, if real their reported equivalent widths are 40 and 90 eV for Fe XXV and XXVI when using a cool, optically thick Comptonisation model for the continuum (similar to that observed in GRS 1915+105, and to the ultraluminous state interpretation). Any undetected features in the immedite Fe K band must be much weaker than these.
However, assuming black hole masses of 10 for Holmberg IX X-1 and NGC 1313 X-1, these sources are observed to persistently radiate at 5–10 times their Eddington limits. In this scenario, we would expect them to be ejecting at least 5–10 times the amount of material as a similar source accreting at the Eddington limit (i.e. GRS 1915+105). Ponti et al. (2012) find that, even under the assumption of a constant wind opening angle, the ratio of the mass outflow rate to the innermost accretion rate, out/acc, increases with increasing Eddington ratio, so increasing the luminosity by a factor of 10 increases the amount of material expelled by an even larger factor (assuming this increase in luminosity relates to an equivalent increase in acc). Given that scales roughly linearly with absorbing column density, if the ionisation state and abundances of the winds remained constant we might therefore have expected to see iron absorption features with eV if these sources are at 10 times the Eddington limit and their associated outflows are along our line-of-sight, assuming solar abundances. For the abundances of the host galaxies in these cases (Makarova et al. 2002; Hadfield & Crowther 2007; Pintore & Zampieri 2012), the expectation would still be eV.
If these outflows are truly absent, this would argue very strongly against a highly super-Eddington interpretation for these ULXs. Both sources display hard X-ray spectra with evidence for two separate continuum emission components, similar to some of the complex ‘intermediate’ sub-Eddington states, with very cool disc temperatures (0.2 ) obtained when associating the soft component with the accretion disc. However, both sources also display evidence for the high energy curvature in their hard components that might distinguish ULXs from the typical sub-Eddington states seen in BHBs, and is potentialy the key signature of the proposed ‘ultraluminous’ accretion state (Gladstone et al. 2009). In fact, GRS 1915+105 may show some similar spectral characteristics, including the high energy curvature, when radiating close to its Eddington limit (Vierdayanti et al. 2010), although the presence of a reflection component in this source complicates the issue. If the predicted outflows for strong super-Eddington accretion really are absent, this curvature might still indicate another high Eddington-ratio accretion state, but one that is still roughly Eddington limited rather than strongly super-Eddington, and observed when . This would suggest the black hole masses of Holmberg IX X-1 and NGC 1313 X-1 are 50–100 .
There are, however, some important caveats to these limits that must be considered, especially given the ionised nebulae that many bright ULXs are observed to reside within. In some cases, including Holmberg IX X-1, the outer regions of these nebulae appear to be more consistent with being ionised by shocks instead of X-ray photoionisation, and these regions are observed to be expanding (Pakull & Mirioni 2002; Abolmasov et al. 2007; Cseh et al. 2012). Where present, these shock-ionised regions have generally been interpreted as potential evidence for the large scale impact on the ISM of strong winds launched from the central ULX (although, of course, the mere presence of an outflow from the accretion disc does not by itself imply super-Eddington accretion). Historically, interpretations in which they are instead the expanding remnants of the explosive event in which the ULX was formed have also been proposed (see e.g. Roberts et al. 2003), but given the typical ages of the surrounding stellar populations (see e.g. Grisé et al. 2011), the nebulae appear more consistent with the wind inflated scenario. Therefore, we now consider whether, despite the absorption limits obtained from our X-ray analysis, we could still be viewing these bright ULXs through strong, super-Eddington outflows.
First, we note briefly that when considering the stacked spectra we are strictly obtaining limits on persistent features, and that the outflows observed in BHBs do vary with time, broadly correlating with accretion state (see e.g. Miller et al. 2006, Miller et al. 2008, Neilsen & Lee 2009, Ponti et al. 2012). However, although the sources do display some mild long term flux variability between the observations considered here, it is certainly not clear that these variations are related to accretion state changes, particularly given that the individual spectra obtained from the observations included in this work all appear intrinsically similar (see appendix A). Therefore, a search for persistent features seems reasonable. Furthermore, similar (if mildly weaker) constraints are obtained with the single full-orbit observations of each source, in which virtually no short term variability is observed (Heil et al. 2009).
Although the limits obtained across the immediate Fe K band (6–7 ) are fairly stringent, they naturally become less restrictive at higher energies. Stronger absorption features could still be present in the spectrum were they to arise in winds with very high outflow velocities. This is particularly true for NGC 1313 X-1 where persistent narrow absorption features with equivalent widths up to 75 eV (or even 100 eV at truly extreme velocities) could still currently be present. In contrast, even high velocity features are constrained to have eV for Holmberg IX X-1. In either case, outflow velocities of 20,000 (0.08) would be required in order to invoke absorption features significantly stronger than currently possible in the immediate Fe K band. To date, the fastest potential outflow observed in any BHB has a velocity of 10,000 (IGR J17091–3624; King et al. 2012), although much more typical velocities are . However, there is growing evidence for winds with in active galaxies (Pounds & Reeves 2009; Reeves et al. 2009; Tombesi et al. 2010a). Indeed, the outflows required in order to inflate the shocked regions of the observed nebulae may need to have mildly relativistic outflow velocities (Pakull & Mirioni 2002; Abolmasov et al. 2007), similar to those seen in the Galactic system SS 433 (see Fabrika 2004 and references therein). Outflows with extreme velocities therefore remain an intriguing possibility for ULXs, particularly if IGR J17091–3624 turns out to be radiating at super-Eddington luminosities.
However, the most obvious possibility, assuming that these sources do launch strong, super-Eddington outflows along our line of sight, is that in contrast to Galactic BHBs, the ionisation state of the material is such that it is not readily observable via iron absorption. The ionisation state of a photoionised plasma is typically quantified as , where is the ionising luminosity from the source at a distance and is the density of the plasma. The outflows in GRS 1915+105 typically display ionisation parameters of . We know how changes between GRS 1915+105 and these bright ULXs, and therefore how the ionisation should change for a constant outflow density and distance, but the combination of is not easy to constrain and will determine how the ionisation truly evolves.
Observationally, a lower ionisation outflow does not seem particularly likely in these cases as a massive (high column) outflow with relatively low ionisation should have very obvious effects elsewhere in the spectrum, around the oxygen transitions (0.5–1.0 ). Indeed, for brief illustration, we insert a moderately ionised absorber using the XSTAR photoionisation code into the model used for Holmberg IX X-1, fixing the ionisation at and requiring that the redshift of the absorber is either consistent or blueshifted with respect to the redshift of the host galaxy. Applying this absorber to the full continuum model, we find that the column density of any moderately ionised material must be atom cm-2 (note that the model used has a lower limit of atom cm-2 to the allowed column densities), compared to the columns of 1023 atom cm-2 seen in the sub-Eddington outflows of GRS 1915+105 and GRO J1655-40.
It is therefore probably more likely, based on these observational constraints, that the ionisation state of any line-of-sight wind is such that the bulk of the iron is close to being fully ionised, and hence is prevented from imprinting any strong features on the spectrum. Indeed, continuing their detailed study of the wind in GRS 1915+105, Neilsen et al. (2012) present tentative evidence that the wind in this source may start becoming overionised at the highest luminosities. However, we note that at the ionisation states typically displayed by the wind in GRS 1915+105, increasing by a factor of 10, in line with the differences in luminosity between this source and the ULXs considered here, only decreases the of the iron features that would be observed by a factor of 2 (for a constant column density), so even accounting for the sub-solar metallicity of the host galaxy, this scenario would require that the ionisation increase by a substantially larger factor than could be accounted for simply by the difference in luminosity.
Such a large increase in ionisation could potentially occur through either a simultaneous decrease in the distance between the ionising source and the outflow material, i.e. the launch radius of the wind decreasing, or through a simultaneous decrease in outflow density. Given that we expect more material to be expelled at higher Eddington ratios, we consider the latter evolution to be unlikely. However, the former would be contrary to the larger radius invoked in the toy model for highly super-Eddington outflows proposed by Middleton et al. (2011), and the more general theoretical prediction that the radius from which outflows are launched by radiation pressure increases with increasing acc (Shakura & Sunyaev 1973). Therefore, such a large increase in ionisation appears difficult to justify on physical grounds. Furthermore, we note that if IGR J17091–3624 does turn out to be a strongly super-Eddington source, this overionised scenario would be ruled out on observational grounds.
Individually or in combination, all of these effects can increase the difficulty of detecting strong line-of-sight outflows via iron absorption, even if such outflows are present. Nonetheless, the limits that can currently be placed on any persistent iron absorption features in the spectra of Holmberg IX X-1 and NGC 1313 X-1, when considered in the context of the behaviour of sub-Eddington BHBs, are clearly already beginning to tell us something about their accretion/outflow processes. Any interpretation invoking highly super-Eddington accretion with outflows along our line of sight for these sources must be able to explain the surprising lack of strong iron features in comparison to sub-Eddington BHBs given the expected increase in outflow rates. However, given the apparent difficulty in explaining the increase in outflow ionisation required for the geometry in which the outflows cross our line of sight to remain plausible, the lack of strong absorption features appears to imply that either super-Eddington outflows are not present in these sources, which if true would strongly argue agaist the highly super-Eddington interpretation, or that if they are present they must be directed away from our line of sight to the central accretion flow. If weaker outflows are detected in the future with more sensitive observations of these sources, this would suggest that the latter scenario is not the case.
4.2 Emission Lines
Until this point, we have been discussing the potential presence of the strong outflows associated with highly super-Eddington accretion specifically assuming the ejected material impinges our line of sight to the central accretion flow. We now consider the possibility that strong super-Eddington outflows are present in Holmberg IX X-1 and NGC 1313 X-1 but, despite the large solid angles such outflows are expected to cover, are directed away from our line of sight. In this scenario, one might expect to see evidence of emission features as the outflowing material absorbs and reprocesses X-rays from the central source. Narrow iron emission features, particularly from neutral iron, are ubiquitously observed in the X-ray spectra of Galactic HMXBs, as the strong stellar winds from the massive companions reprocess the X-rays from the central black hole (see Torrejón et al. 2010). As with HMXBs, the stellar companions of ULXs are also expected to be fairly young, relatively massive stars (confirmed in the case of Holmberg IX X-1 by Grisé et al. 2011) which should naturally eject strong stellar winds regardless of the nature of the compact object powering the ULX.
Again considering the immediate Fe K band, we find very similar constraints to those placed on absorption features; any narrow emission features present must have equivalent widths less than 30 and 50 eV for Holmberg IX X-1 and NGC 1313 X-1 respectively. Furthermore, emission features should not display the significant velocity shifts possible for absorption features, so in principle we can be more precise about the exact energies considered (note that any additional peculiar velocities of these sources within their host galaxies could lead to the rest frame energy scale adopted here being systematically offset, but such effects are unlikely to be large). Assuming the redshifts quoted in Table 1 are appropriate for these sources as well as their host galaxies, the 99 per cent limits on emission features obtained for the transitions highlighted in Figs. 2 and 3 (neutral, helium-like and hydrogen-like iron) are 23, 25 and 12 eV for Holmberg IX X-1, and 41, 37 and 11 eV for NGC 1313 X-1 respectively.
From these equivalent width limits, we can obtain upper limits for the reprocessing column density using the relation derived by Kallman et al. (2004): , where is some constant of proportionality. Kallman et al. (2004) showed that for neutral iron, (for a solar iron abundance, equivalent widths in eV and column densities in atom cm-2), which has been observationally confirmed for Galactic HMXBs by Torrejón et al. (2010). Using this relation, (although correcting for the 0.5 metallicities of the host galaxies) we find that 14 and 24 atom cm-2 for Holmberg IX X-1 and NGC 1313 X-1 respectively, placing both at the lower end of the distribution observed in Galactic HMXBs, which ranges from 10 atom cm-2, with the majority displaying atom cm-2; see Fig. 5 in Torrejón et al. 2010. However, that work also reported an anti-correlation between the neutral iron equivalent width and HMXB luminosity, which they interpret as being due to an increase in ionisation of the stellar winds in which the accreting black holes are embedded. The limits obtained here for neutral iron are consistent with this picture. Any super-Eddington outfows present can not provide any substantial neutral column in addition to the stellar wind expected from the companion, but given the high ionisation of sub-Eddington outflows in BHBs, we would naturally expect any super-Eddington outflows to be at least moderately ionised.
If the outflows have a similar ionisation to the outflows observed in GRS 1915+105 (), iron will be primarily in its hydrogen-like ionisation state. Re-calculating the constant of proportionality for Fe XXVI, taking the threshold absorption cross-section of hydrogenic iron to be 9.5 cm2 (Verner & Yakovlev 1995), the iron abundance to be 1.6 (e.g. Wilms et al. 2000; ), and the flourescent yield to be 0.5, we find that 9 and 8 atom cm-2 for Holmberg IX X-1 and NGC 1313 X-1 respectively. Therefore, there does not appear to be any substantial column of highly ionised reprocessing material either.
However, we return to the issue that the expected evolution of the ionisation state of the wind with increasing Eddington ratio is not well known, owing to the uncertain evolution of the combination . As discussed previously, an increase in ionisation will increase the column density inferred from the limit on the emission from Fe XXVI as a larger fraction of the iron nuclei become fully ionised. However, in comparison to the line-of-sight (absorption) case, it is more observationally plausible for the ionisation to have decreased in this scenario. Indeed, as the Eddington ratio increases, standard theory predicts that the launch radius of the wind should also increase, and it is not unreasonable to imagine the outflow density might also increase; both of these effects could serve to counteract the increase in luminosity and result in an overall decrease in ionisation. If super-Eddington outflows are sufficiently less ionised than sub-Eddington outflows, they could enter a regime in which resonant trapping and Auger line destruction is efficient, which would result in only very weak emission lines (see e.g. Ross et al. 1996).
A further caveat to our consideration of emission lines is that the relation between line equivalent width and column density derived by Kallman et al. (2004) assumes a spherical distribution for the reprocessing medium. For a constant column, a non-spherical outflow distribution (i.e. covering a solid angle ) would reduce the expected for the reprocessed emission lines. Although a spherical distribution is certainly appropriate for the consideration of reprocessing by any stellar winds from the companion, we now consider whether it is also a reasonable assumption for strong super-Eddington outflows. It is widely expected that as the Eddington ratio increases, the scale height of the wind should also increase (see e.g. King 2009, Dotan & Shaviv 2011), so as the Eddington ratio increases, the assumption of a spherical wind distribution becomes more and more appropriate. Indeed, Dotan & Shaviv (2011) find that the winds launched by super-critical accretion become spherical beyond , although this is somewhat dependent on the assumed model parameters, e.g. the disc viscosity and the opacity parameterisation. Nevertheless, although by virtue of the lack of strong absorption features any strong outflows cannot be truly spherical in these cases, the high Eddington ratios (10) inferred for black hole masses of 10 might well result in something approaching a spherical outflow geometry, so the estimated limits on the columns obtained might not be unreasonable. We stress that while reducing the solid angle covered by the outflow is a legitimate way in which to potentially increase the limits on the column density of the outflow, doing so would also imply a reduction in the true Eddington ratio.
4.2.1 Broader Lines
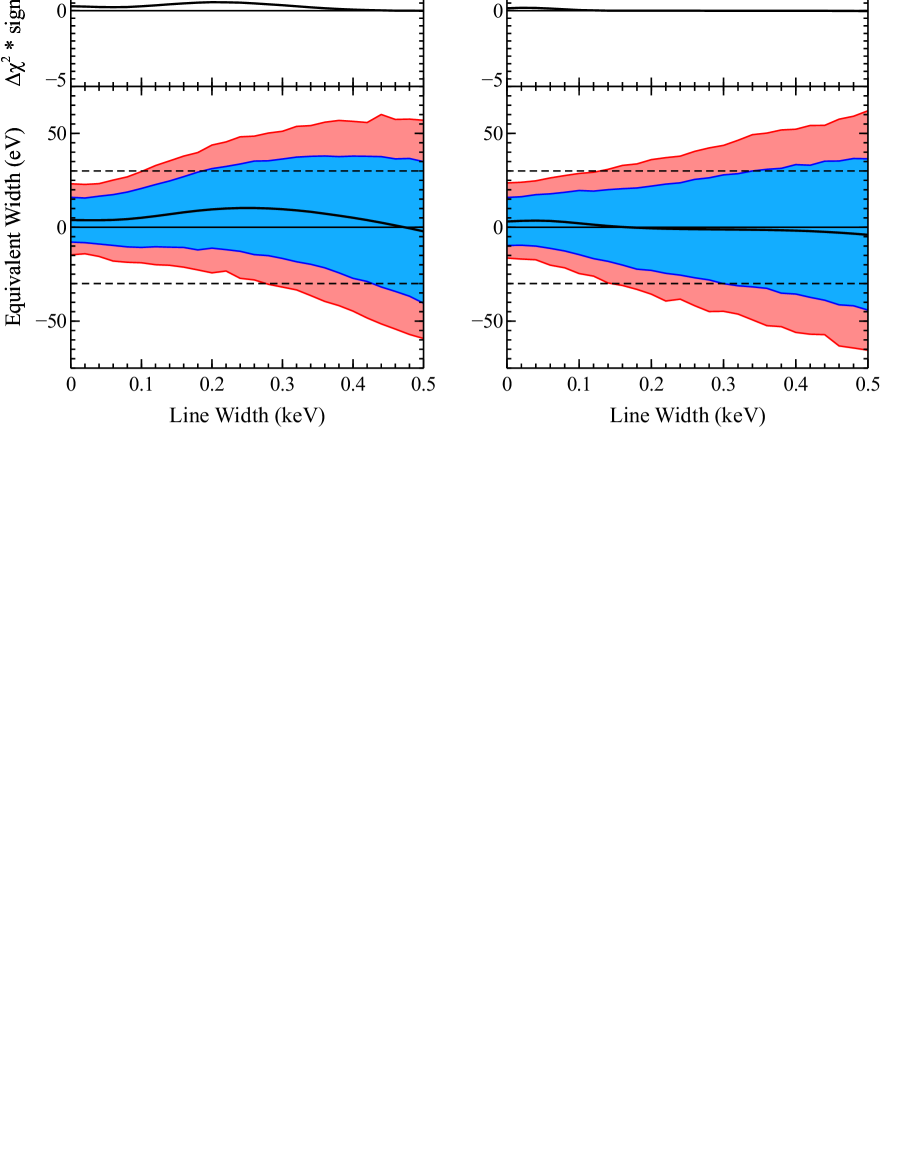
In this work, we have focused primarily on narrow iron features, given the observed absorption features from sub-Eddington outflows and the emission features from Galactic HMXBs. However, the emission lines expected from an optically thick, diverging outflow may be broadened by both Doppler shifts and electron scattering, particularly if the outflow velocity is large (see e.g. Titarchuk et al. 2009, Sim et al. 2010). Therefore, we consider briefly the limits that can currently be placed on emission lines as a function of the line width. For illustrative purposes, we demonstrate in Fig. 4 how the limits evolve over a range of assumed line widths for the K transitions of Fe I, XXV and XXVI for Holmberg IX X-1. The limits naturally become weaker as the assumed width increases, therefore stronger iron emission features could yet be present if they are substantially broadened by the wind in which they arise.
Unfortunately, the combination of the uncertainty in the ionisation state, solid angle and the outflow velocity of the wind, all of which contribute towards determining the width of any emission line produced by the outflow, means it is difficult to make any clear predictions about the expected line widths, and hence provide a detailed consideration of the limits on any such emission lines. We therefore conclude that at this stage it is still too difficult to place strong constraints on the presence of super-Eddington outflows that do not cover our line-of-sight just through consideration of the expected iron emission.
5 Conclusions
Making use of all the good quality XMM-Newton data publically available for two bright ULXs, Holmberg IX X-1 and NGC 1313 X-1, we have searched for (persistent) discrete atomic features in their high energy spectra that could be associated with either iron emission or absorption, and provide observational evidence for the massive outflows predicted if these sources are accreting at substantially super-Eddington rates. We do not find any statistically compelling evidence for any features, either in absorption or in emission. However, we do find that the data currently available for these sources is of sufficient quality that we can place fairly stringent limits on the strengths of any features intrinsically present these spectra that remain undetected. Any features present (absorption or emission) in the immediate Fe K energy band (6–7 ) must have equivalent widths weaker than 30 eV for Holmberg IX X-1, and weaker than 50 eV for NGC 1313 X-1.
In comparison to the strongest sub-Eddington outflows observed in GRS 1915+105, which imprint iron absorption features with equivalent widths of 30 eV, the limits obtained for the ULXs considered here appear quite restrictive, particularly when these sources must be radiating at 5–10 times their Eddington limits if they host black holes of similar masses, and should therefore be expelling at least 5–10 times as much material as GRS 1915+105. The difficulty in trying to reconcile these observational constraints with the presence of strong line-of-sight outflows leads us to conclude that either these sources do not launch such outflows, which would strongly argue against a highly super-Eddington interpretation, or that they much be launched away from our viewing angle. Additional deep observations of bright ULXs with current instrumentation, and in particular with the micro-calorimeter due for launch on board Astro-H in the near future, will be essential for detecting any weak iron features in such sources, and hence in placing stronger constraints on the nature of any outflows present, and the ultimate nature of these sources.
ACKNOWLEDGEMENTS
DJW acknowledges the financial support provided by STFC in the form of a PhD grant, and ACF thanks the Royal Society. RCR thanks the Michigan Society of Fellows, and is supported by NASA through the Einstein Fellowship Program, grant number PF1-120087. The figures included in this work have been produced with the Veusz444http://home.gna.org/veusz/ plotting package, written by Jeremy Sanders. This work is based on observations obtained with XMM-Newton, an ESA mission with instruments and contributions directly funded by ESA member states and the USA (NASA). Finally, the authors would like to thank Tim Kallman for useful discussions, as well as the referee for their feedback, which helped to improve the quality and depth of this paper.
References
- Abolmasov et al. (2007) Abolmasov P., Fabrika S., Sholukhova O., Afanasiev V., 2007, Astrophysical Bulletin, 62, 36
- Abramowicz (2005) Abramowicz M. A., 2005, in A. Merloni, S. Nayakshin, & R. A. Sunyaev , ed, Growing Black Holes: Accretion in a Cosmological Context, p. 257
- Abramowicz et al. (1980) Abramowicz M. A., Calvani M., Nobili L., 1980, ApJ, 242, 772
- Altamirano et al. (2011) Altamirano D. et al., 2011, ApJ, 742, L17
- Arnaud (1996) Arnaud K. A., 1996, in Astronomical Society of the Pacific Conference Series, Vol. 101, G. H. Jacoby & J. Barnes , ed, Astronomical Data Analysis Software and Systems V, p. 17
- Berghea et al. (2010) Berghea C. T., Dudik R. P., Weaver K. A., Kallman T. R., 2010, ApJ, 708, 364
- Colbert & Mushotzky (1999) Colbert E. J. M., Mushotzky R. F., 1999, ApJ, 519, 89
- Cseh et al. (2012) Cseh D. et al., 2012, ApJ, 749, 17
- Díaz Trigo et al. (2007) Díaz Trigo M., Parmar A. N., Miller J., Kuulkers E., Caballero-García M. D., 2007, A&A, 462, 657
- Dotan & Shaviv (2011) Dotan C., Shaviv N. J., 2011, MNRAS, 413, 1623
- Fabrika (2004) Fabrika S., 2004, Astrophysics and Space Physics Reviews, 12, 1
- Farrell et al. (2009) Farrell S. A., Webb N. A., Barret D., Godet O., Rodrigues J. M., 2009, Nat, 460, 73
- Feng & Soria (2011) Feng H., Soria R., 2011, NAR, 55, 166
- Finke & Böttcher (2007) Finke J. D., Böttcher M., 2007, ApJ, 667, 395
- Gierliński et al. (1999) Gierliński M., Zdziarski A. A., Poutanen J., Coppi P. S., Ebisawa K., Johnson W. N., 1999, MNRAS, 309, 496
- Gladstone et al. (2009) Gladstone J. C., Roberts T. P., Done C., 2009, MNRAS, 397, 1836
- Greiner et al. (2001) Greiner J., Cuby J. G., McCaughrean M. J., 2001, Nat, 414, 522
- Grimm et al. (2003) Grimm H., Gilfanov M., Sunyaev R., 2003, MNRAS, 339, 793
- Grisé et al. (2011) Grisé F., Kaaret P., Pakull M. W., Motch C., 2011, ApJ, 734, 23
- Hadfield & Crowther (2007) Hadfield L. J., Crowther P. A., 2007, MNRAS, 381, 418
- Heil et al. (2009) Heil L. M., Vaughan S., Roberts T. P., 2009, MNRAS, 397, 1061
- Kaaret et al. (2004) Kaaret P., Ward M. J., Zezas A., 2004, MNRAS, 351, L83
- Kallman et al. (2004) Kallman T. R., Palmeri P., Bautista M. A., Mendoza C., Krolik J. H., 2004, ApJS, 155, 675
- Kashyap et al. (2010) Kashyap V. L., van Dyk D. A., Connors A., Freeman P. E., Siemiginowska A., Xu J., Zezas A., 2010, ApJ, 719, 900
- King et al. (2012) King A. L. et al., 2012, ApJ, 746, L20
- King (2009) King A. R., 2009, MNRAS, 393, L41
- King et al. (2001) King A. R., Davies M. B., Ward M. J., Fabbiano G., Elvis M., 2001, ApJ, 552, L109
- Kotani et al. (2000) Kotani T., Ebisawa K., Dotani T., Inoue H., Nagase F., Tanaka Y., Ueda Y., 2000, ApJ, 539, 413
- Lee et al. (2002) Lee J. C., Reynolds C. S., Remillard R., Schulz N. S., Blackman E. G., Fabian A. C., 2002, ApJ, 567, 1102
- Makarova et al. (2002) Makarova L. N. et al., 2002, A&A, 396, 473
- Middleton et al. (2011) Middleton M. J., Roberts T. P., Done C., Jackson F. E., 2011, MNRAS, 411, 644
- Middleton et al. (2011) Middleton M. J., Sutton A. D., Roberts T. P., 2011, MNRAS, 417, 464
- Miller et al. (2004) Miller J. M., Fabian A. C., Miller M. C., 2004, ApJ, 614, L117
- Miller et al. (2006) Miller J. M., Raymond J., Fabian A., Steeghs D., Homan J., Reynolds C., van der Klis M., Wijnands R., 2006, Nat, 441, 953
- Miller et al. (2008) Miller J. M., Raymond J., Reynolds C. S., Fabian A. C., Kallman T. R., Homan J., 2008, ApJ, 680, 1359
- Neilsen & Lee (2009) Neilsen J., Lee J. C., 2009, Nat, 458, 481
- Neilsen et al. (2012) Neilsen J., Petschek A. J., Lee J. C., 2012, MNRAS, 2287
- Ohsuga & Mineshige (2011) Ohsuga K., Mineshige S., 2011, ApJ, 736, 2
- Pakull & Mirioni (2002) Pakull M. W., Mirioni L., 2002, ArXiv Astrophysics e-prints
- Paturel et al. (2002) Paturel G., Theureau G., Fouqué P., Terry J. N., Musella I., Ekholm T., 2002, A&A, 383, 398
- Piconcelli et al. (2004) Piconcelli E., Jimenez-Bailón E., Guainazzi M., Schartel N., Rodríguez-Pascual P. M., Santos-Lleó M., 2004, MNRAS, 351, 161
- Pintore & Zampieri (2012) Pintore F., Zampieri L., 2012, MNRAS, 420, 1107
- Ponti et al. (2012) Ponti G., Fender R. P., Begelman M. C., Dunn R. J. H., Neilsen J., Coriat M., 2012, MNRAS, 422, L11
- Pounds & Reeves (2009) Pounds K. A., Reeves J. N., 2009, MNRAS, 397, 249
- Poutanen et al. (2007) Poutanen J., Lipunova G., Fabrika S., Butkevich A. G., Abolmasov P., 2007, MNRAS, 377, 1187
- Reeves et al. (2009) Reeves J. N. et al., 2009, ApJ, 701, 493
- Remillard & McClintock (2006) Remillard R. A., McClintock J. E., 2006, ARA&A, 44, 49
- Roberts (2007) Roberts T. P., 2007, Astrophysics and Space Science, 311, 203
- Roberts et al. (2003) Roberts T. P., Goad M. R., Ward M. J., Warwick R. S., 2003, MNRAS, 342, 709
- Ross et al. (1996) Ross R. R., Fabian A. C., Brandt W. N., 1996, MNRAS, 278, 1082
- Shakura & Sunyaev (1973) Shakura N. I., Sunyaev R. A., 1973, A&A, 24, 337
- Sim et al. (2010) Sim S. A., Proga D., Miller L., Long K. S., Turner T. J., 2010, MNRAS, 1218
- Stobbart et al. (2006) Stobbart A.-M., Roberts T. P., Wilms J., 2006, MNRAS, 368, 397
- Strüder et al. (2001) Strüder L. et al., 2001, A&A, 365, L18
- Sutton et al. (2012) Sutton A. D., Roberts T. P., Walton D. J., Gladstone J. C., Scott A. E., 2012, MNRAS, 2880
- Swartz et al. (2011) Swartz D. A., Soria R., Tennant A. F., Yukita M., 2011, ApJ, 741, 49
- Swartz et al. (2009) Swartz D. A., Tennant A. F., Soria R., 2009, ApJ, 703, 159
- Titarchuk (1994) Titarchuk L., 1994, ApJ, 434, 570
- Titarchuk et al. (2009) Titarchuk L., Laurent P., Shaposhnikov N., 2009, ApJ, 700, 1831
- Tombesi et al. (2010a) Tombesi F., Cappi M., Reeves J. N., Palumbo G. G. C., Yaqoob T., Braito V., Dadina M., 2010a, A&A, 521, A57
- Tombesi et al. (2010b) Tombesi F., Sambruna R. M., Reeves J. N., Braito V., Ballo L., Gofford J., Cappi M., Mushotzky R. F., 2010b, ApJ, 719, 700
- Torrejón et al. (2010) Torrejón J. M., Schulz N. S., Nowak M. A., Kallman T. R., 2010, ApJ, 715, 947
- Tully (1988) Tully R. B., 1988, Nearby Galaxies Catalog (Cambridge: Cambridge Universiry Press)
- Turner et al. (2001) Turner M. J. L. et al., 2001, A&A, 365, L27
- Ueda et al. (2009) Ueda Y., Yamaoka K., Remillard R., 2009, ApJ, 695, 888
- Verner & Yakovlev (1995) Verner D. A., Yakovlev D. G., 1995, A&AS, 109, 125
- Vierdayanti et al. (2010) Vierdayanti K., Mineshige S., Ueda Y., 2010, PASJ, 62, 239
- Walton et al. (2011a) Walton D. J., Gladstone J. C., Roberts T. P., Fabian A. C., Caballero-Garcia M. D., Done C., Middleton M. J., 2011a, MNRAS, 414, 1011
- Walton et al. (2011b) Walton D. J., Roberts T. P., Mateos S., Heard V., 2011b, MNRAS, 416, 1844
- Wilms et al. (2000) Wilms J., Allen A., McCray R., 2000, ApJ, 542, 914
Appendix A Individual Observation Details
| Source | Obs. | (/d.o.f.) | |||||
|---|---|---|---|---|---|---|---|
| ( cm-2) | (keV) | (keV) | |||||
| Holmberg IX X-1 | 0112521001 | 1.02 (3162/3102) | |||||
| 0200980101 | |||||||
| 0200980101 | |||||||
| NGC 1313 X-1 | 0106860101 | 1.05 (3968/3769) | |||||
| 0150280601 | 2* | ||||||
| 0150181101 | |||||||
| 0205230201 | 2* | ||||||
| 0205230301 | |||||||
| 0205230601 | 2* | ||||||
| 0405090101 |
Here, we examine briefly the individual observations of Holmberg IX X-1 and NGC 1313 X-1 considered in this work to check whether it is reasonable to combine the data obtained into a single spectrum in each case. For each source, we model the spectra obtained from the individual observations simultaneously, adopting the same continuum model outlined in the main body of the paper (see section 3.1). The key continuum parameters are all free to vary between the observations, although we require that the neutral absorption is the same for each. Owing to the highly varied data quality it was not always possible to reliably constrain both the optical depth and electron temperature of the Comptonising region in NGC 1313 X-1, as these parameters often display some degeneracy. In these cases, we fixed the electron temperature at 2 , similar to the values obtained for the other observations. The results obtained are presented in Table 3. Although there are some minor differences in the parameter values obtained, they are all reasonably similar for both sources.
In addition, to provide a visual comparison of the spectra from the various observations, we plot the count spectra of the different observations for each source in Fig. 5. This confirms the results obtained with the quantitative analysis presented in Table 3: there are some slight differences between the spectra of the individual observations in terms of their high energy spectral slope/curvature, more so for NGC 1313 X-1 than Holmberg IX X-1, for which the high energy spectra are practically identical, but ultimately the spectra are all fairly similar for both sources. Hence we conclude that it is reasonable to combine them into a single, averaged spectrum for each source in order to improve the high energy statistics and further facilitate our search for narrow iron features.
As a final test, for each of the models obtained for the observations of NGC 1313 X-1 (see Table 3) we inserted a narrow ( = 10 eV) Gaussian absorption line at 6.67 with an equivalent width of -50 eV. Data were then simulated from each model using the EPIC-pn response, keeping the respective exposures of the simulated spectra the same as the good exposure times for the observations on which they are based (see Table 1). We then combined the simulated datasets in the same manner as the real data, and examined the characteristics of the absorption feature in the combined simulated dataset. The narrow feature is well detected, providing an improvement of for 2 additional degrees of freedom, and we find a line energy of , and an equivalent width of eV (90 per cent confidence). Considering instead the simulation of the long observation by itself, the absorption feature only offers an improvement of for 2 extra degrees of freedom. Therefore, even given the mild variance in the high energy spectrum of NGC 1313 X-1, combining the individual spectra does aid the detection of persistent narrow features.