Evolved star water maser cloud size determined by star size
Abstract
Context. Cool, evolved stars undergo copious mass loss but the detailed mechanisms and the form in which the matter is returned to the ISM are still under debate.
Aims. We investigated the structure and evolution of the wind at 5 to 50 stellar radii from Asymptotic Giant Branch and Red Supergiant stars.
Methods. 22-GHz water masers around seven evolved stars were imaged using MERLIN, at sub-AU resolution. Each source was observed at between 2 and 7 epochs, covering several stellar periods. We compared our results with long-term single dish monitoring provided by the Pushchino radio telescope.
Results. The 22-GHz emission is located in approximately spherical, thick, unevenly filled shells. The outflow velocity increases twofold or more between the inner and outer shell limits. Water maser clumps could be matched at successive epochs separated by less than two years for AGB stars, or at least 5 years for RSG. This is much shorter than the decades taken for the wind to cross the maser shell, and comparison with spectral monitoring shows that some features fade and reappear. In five sources, most of the matched maser features brighten or dim in concert from one epoch to the next. A number of individual maser features show idiosyncratic behaviour, including one cloud in W Hya caught in the act of passing in front of a background cloud leading to 50-fold, transient amplification. The masing clouds are one or two orders of magnitude denser than the wind average and contain a substantial fraction of the mass loss in this region, with a filling factor . The RSG clouds are about ten times bigger than those round the AGB stars.
Conclusions. Proper motions are dominated by expansion, with no systematic rotation. The maser clouds presumably survive for decades (the shell crossing time) but the masers are not always beamed in our direction. Only radiative effects can explain changes in flux density throughout the maser shells on short timescales. The size of the clouds is proportional to that of the parent star, being of a similar radius to the star once the clumps reach the 22-GHz maser shell. Stellar properties such as convection cells must determine the clumping scale.
Key Words.:
Masers – Stars: AGB – Stars: supergiants – circumstellar matter1 Introduction
Stars of less than eight Solar mass evolve onto the Asymptotic Giant Branch (AGB) when they have exhausted much of the available H. They become very large ( AU) and cool ( K) and lose mass at the rate of up to an Earth mass per year. Red Supergiants (RSG) had main sequence masses M⊙ and swell to ten times the size of AGB stars, with ten times the mass loss rate. Although the internal stellar processes are mass-dependent, the winds are similar, being cool, dusty and molecular. O-rich stars produce SiO, H2O and OH masers with spatially very compact, spectrally narrow lines which can be imaged at milli-arcsec resolution using radio interferometry. A combination of pulsations, radiation pressure and possibly other e.g. magnetic forces drives material away from the stellar surface. The exact mechanisms are still under debate (e.g. Woitke 2006) and at a few stellar radii (), SiO masers show both infall and outflow (e.g. Assaf et al. 2011). Dust nucleation is likely to start close to the star (Wittkowski et al. 2007) and by 4–6 , radiation pressure on dust is the main force driving the wind. The H2O masers around these stars are found in approximately spherical shells extending from about 5-50 . They provide a very high-resolution probe of the structure, kinematics and conditions in the circumstellar envelope (CSE) in the region where the outflow is most strongly accelerated and passes through the escape velocity, see e.g. Bowers & Johnston (1994), Yates & Cohen (1994) and also Habing (1996) for a general review.
MERLIN111the UK radio interferometer, operated by the University of Manchester on behalf of STFC has been used to monitor H2O and OH masers around a number of evolved stars with no known companions. We analyse 2–7 epochs of images of 22-GHz H2O masers around seven objects, listed in Table 1. The observations of the RSG VX Sgr and S Per (first epoch) were reported in Murakawa et al. (2003) (M03) and Richards et al. (1999) (R99), respectively. The first epochs of the AGB stars IK Tau, U Her, U Ori and RT Vir were reported in Bains et al. (2003) (B03). W Hya MERLIN 22-GHz observations have not been published previously.
These stars are close enough and unobscured enough to have AAVSO optical monitoring data, Hipparcos or other parallax measurements and in many cases optical or IR interferometric meaurements of the stellar diameter. They are among the objects which have been monitored by the Pushchino radio telescope at 22 GHz for many decades. Component fitting allows the size of AU-scale clouds to be measured from MERLIN data. The H2O maser properties of the sources above declination 0° were investigated in detail by Richards et al. (2011) (R11), who found that they are predominantly unsaturated. The maser appearance is mostly characteristic of spherical clouds but, in some objects, amplification appears to be occuring along the long axis of flattened clouds.
| Star | Position | Type | Distance | Previous imaging | |||||
| (J2000) | (km s-1) | (pc) | (pc) | (AU) | (d) | (M⊙ yr-1) | |||
| VX Sgr | 18 08 04.05 –22 13 26.6 | RSG | –5.3 | 1700 | 732 | C86,B93,M98,M03,V05 | |||
| S Per | 02 22 51.71 +58 35 11.4 | RSG | –38.5 | 2300 | 822 | D87,Y94.R99,M98,V01, | |||
| A10 | |||||||||
| U Ori | 05 55 49.17 +20 10 30.7 | Mira | –39.5 | 266 | 368 | B88,Y94,B94,B03,V05 | |||
| U Her | 16 25 47.47 +18 53 32.9 | Mira | –14.5 | 266 | 406 | Y94,B94,M98,C00,B03, | |||
| V02,V05 | |||||||||
| IK Tau | 03 53 28.89 +11 24 21.9 | Mira | +34.0 | 266 | 470 | L87,B93,Y94,M98,B03 | |||
| RT Vir | 13 02 37.98 +05 11 08.4 | SRb | +18.2 | 133 | 158 | Y94,B93,B94,B03,I03 | |||
| W Hya | 13 49 02.00 –28 22 03.4 | SRb | +40.6 | 98 | 375 | R90,B93 | |||
| References | |||||||||
| VX Sgr | vL07 | C86 | C07 | M04 | S11 | D10 | |||
| S Per | vL07 | D87 | M08 | H94, L05 | S11 | vL05 | |||
| U Ori | vL07 | C91 | C91 | R06 | S11 | K98 | |||
| U Her | vL07 | C94 | V07 | R06 | S11 | Y95 | |||
| IK Tau | C06 | K87 | 098 | M04, R06 | S11 | O98, B00 | |||
| RT Vir | vL07 | N86 | vL07 | M04 | S11 | K98, K99 | |||
| W Hya | vL07 | N96 | V03 | Z11 | S11 | K98 | |||
References in the table are: A10 Asaki et al. (2010); B88 Bowers & Johnston (1988); B93 Bowers et al. (1993); B94 Bowers & Johnston (1994); B00 Bieging et al. (2000);B03 Bains et al. (2003); C86 Chapman & Cohen (1986); C91 Chapman et al. (1991); C94 Chapman et al. (1994); C00 Colomer et al. (2000); C06 Carlsberg Meridian Catalog 14 (2006); C07 Chen et al. (2007); D87 Diamond et al. (1987); I03 Imai et al. (2003); K87 Kirrane (1987); K98 Knapp et al. (1998); K99 Kerschbaum & Olofsson (1999); L87 Lane et al. (1987); L05 Levesque et al. (2005); M98 Marvel et al. (1998); M03 Murakawa et al. (2003) M04 Monnier et al. (2004); M08 Mayne & Naylor (2008); N96 Neufeld et al. (1996); N86 Nyman et al. (1986); O98 Olofsson et al. (1998); R90 Reid & Menten (1990); R99 Richards et al. (1999); R06 Ragland et al. (2006); S11 Samus et al. (2011) (GCVS); V01 Vlemmings et al. (2001); V02 Vlemmings et al. (2002); V03 Vlemmings et al. (2003); V05 Vlemmings et al. (2005); V07 Vlemmings & van Langevelde (2007); vL05 van Loon et al. (2005); vL07 van Leeuwen (2007); Y94 Yates & Cohen (1994); Z11 Zhao-Geisler et al. (2011)
The H2O masers have also been imaged using VLBI and the VLA, see Table 1. However, a large fraction of the flux (half is not unusual) is resolved-out by VLBI, whilst the VLA cannot resolve individual maser clumps. Allowing for this, our observational results are consistent with other images. Comparisons with previous interpretations are included in the relevant sections of this paper. For completeness, we note that we observed several other objects with MERLIN at 22 GHz. The first epochs of NML Cyg and VY CMa were published by Richards et al. (1996) and Richards et al. (1998); further monitoring of these two exceptional RSG will be presented by Yates et al., as will obervations of the heavily-obscured SRb, R Crt. We also observed R Cas (20000404, 20010511, 20020405) and R Leo (20000429) but these were non-detections at a conservative upper limit of 200 mJy. This is consistent with non-detections for several years around this period (upper limit 10 Jy) using Pushchino (Pashchenko & Rudnitskii (2004) R Cas; Esipov et al. (1999) R Leo).
This paper presents a large-scale analysis of multiple observations (between two and seven epochs per star, spanning up to 7 years). Data acquisition and analysis is summarised in Section 2, including estimating the centre of expansion, aligning epochs and assessing the astrometric accuracy. We examine proper motions and cloud survival in Section 3 and compare images with Pushchino single dish monitoring in Section 4, to investigate the survival of masers with respect to their parent clouds. We analyse the kinematics and estimate the mass concentration in maser clouds in Section 5. Local and global maser variability is discussed in Section 6. The size of the maser clumps and their relationships with stellar properties is discussed in Section 7 and Section 8 presents the summary and future work.
2 Data acquisition and analysis
Radio interferometry observations were made using 5 antennas of MERLIN, longest baseline 217 km, centred on the 22.235079 GHz H2O maser line, corrected in the correlator to the of the source. 2 GHz of bandwidth, providing 25 km s-1 velocity coverage in 0.105 km s-1 channels, was used for most epochs. This was found to be insufficient for IK Tau and S Per and so 4 GHz bandwidth, providing 50 km s-1 in 0.21 km s-1 channels, was used for these sources in 1999 and later epochs. VX Sgr was observed at both epochs in 4 GHz bandwidth and 0.42 km s-1 channels were used for analysis. Data were recorded in two hands of circular polarization, calibrated independently (apart from amplitude normalisation). High spatial and spectral resolution is required to detect the weak polarization of H2O (see e.g. Vlemmings et al. (2005) for results using VLBA data), and circular polarization is neglible for these sources at MERLIN resolution, so we made and analysed images in total intensity only.
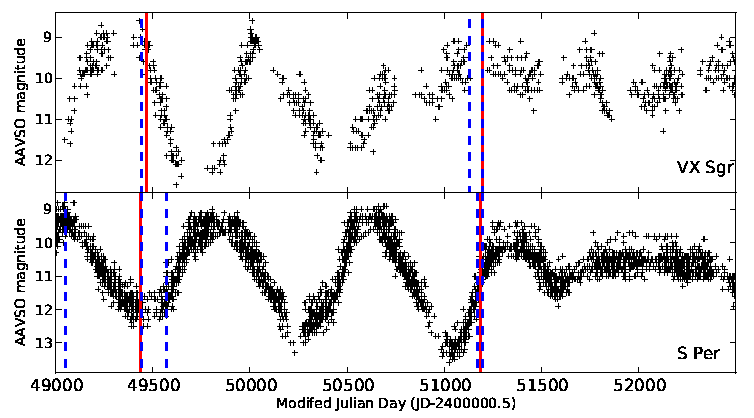
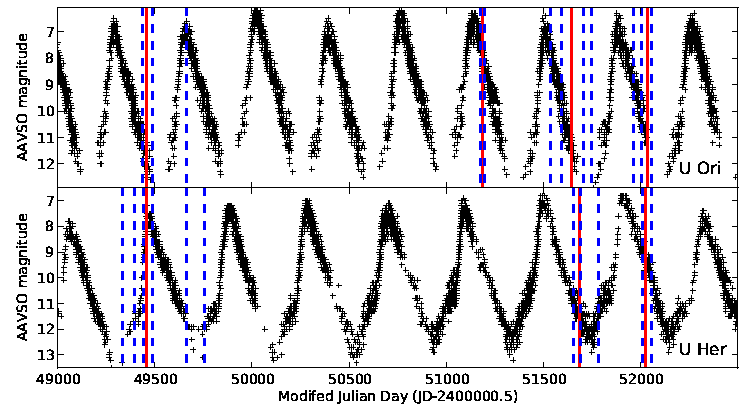
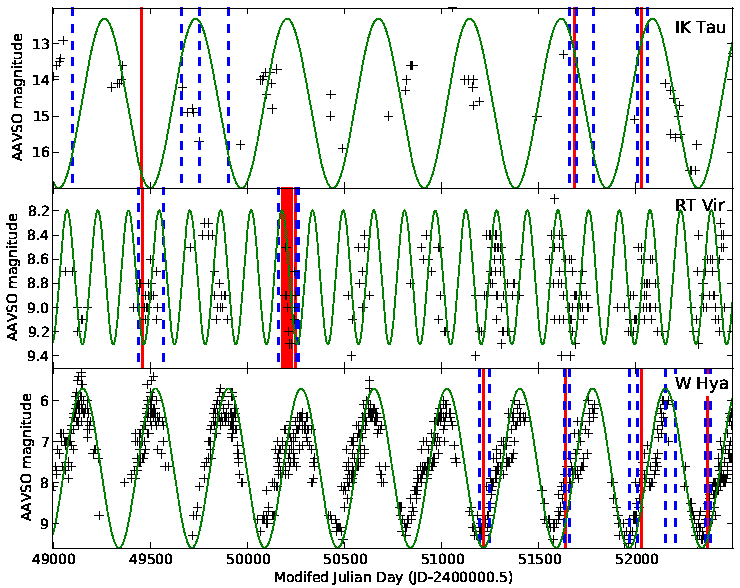
The reduction of the 1994 data (and 1999 data for VX Sgr) is described in M03, R99 and B03. Similar techniques were used at later epochs, with the addition of phase referencing in some cases, see Section 2.2. All data reduction and initial analysis was performed using aips (Greisen 1994). Observational parameters and measurements are given in Table 2. The epochs of observation are superimposed (red lines) on AAVSO (American Association of Variable Star Observers) light curves in Figs. 1 to 3. The noise levels achieved depended on the source elevation, the weather and the total time on target. The weighting used during imaging was chosen to provide the best resolution without increasing the noise by more than 20%. In all cases, the dynamic range was limited to a few hundred, or about one hundred for low-declination sources with poor visibility-plane coverage.
The flux scale was derived from either 3C84 or 3C273, using 22-GHz monitoring data kindly provided by H. Teräsranta from the Metsähovi antenna. These sources may be slightly resolved by MERLIN at some epochs and vary during the few weeks or months between the Metsahovi and MERLIN observations. This dominates the uncertainty in the flux scales, which is about 10%.
In Appendix A we present contour maps of the maser emission averaged every few channels.
The position and peak intensity of each patch of maser emission brighter than 4.5 – 6 (depending on visibility plane coverage) in each channel was measured by fitting a 2-D Gaussian component. We rejected components fainter than the the local sidelobe level close to bright peaks. Their size (with the restoring beam deconvolved) and integrated intensity was also measured for all sources at positive declinations i.e. excluding VX Sgr and W Hya, for which the resolution N-S is too coarse. The accuracy of these measurements is proportional to (beam size)/(signal to noise ratio) (Condon 1997 adapted for sparse arrays by Condon et al. 1998 and Richards et al. 1999) so the different sensitivies are taken account of via the uncertainties used in analysis.
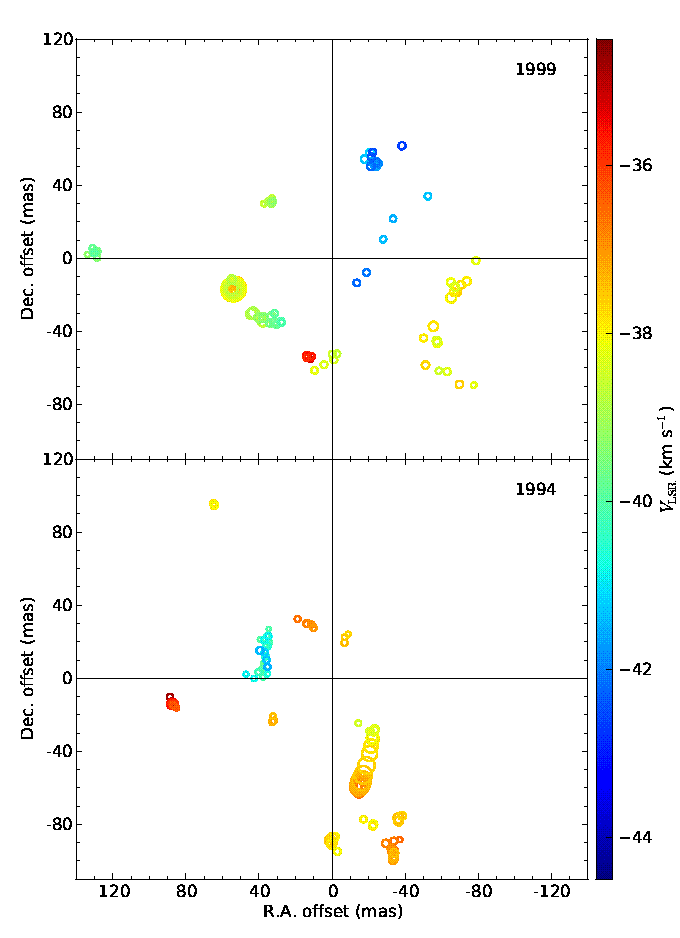
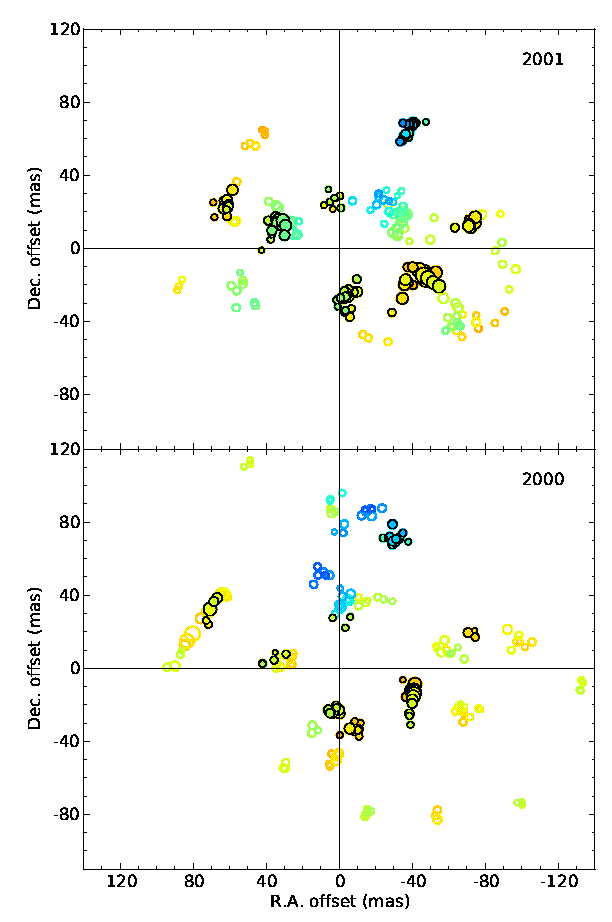
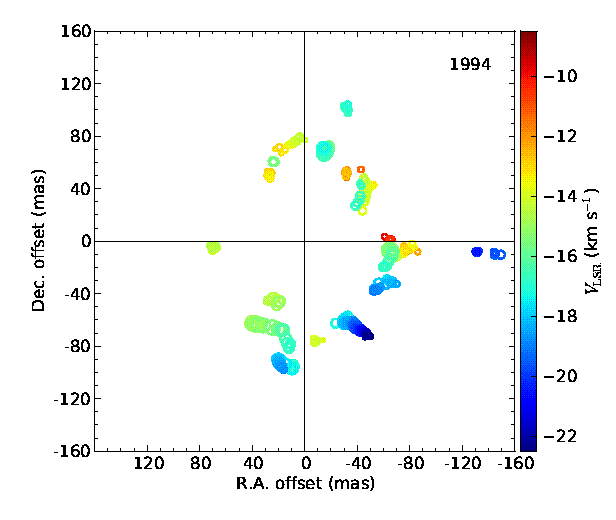
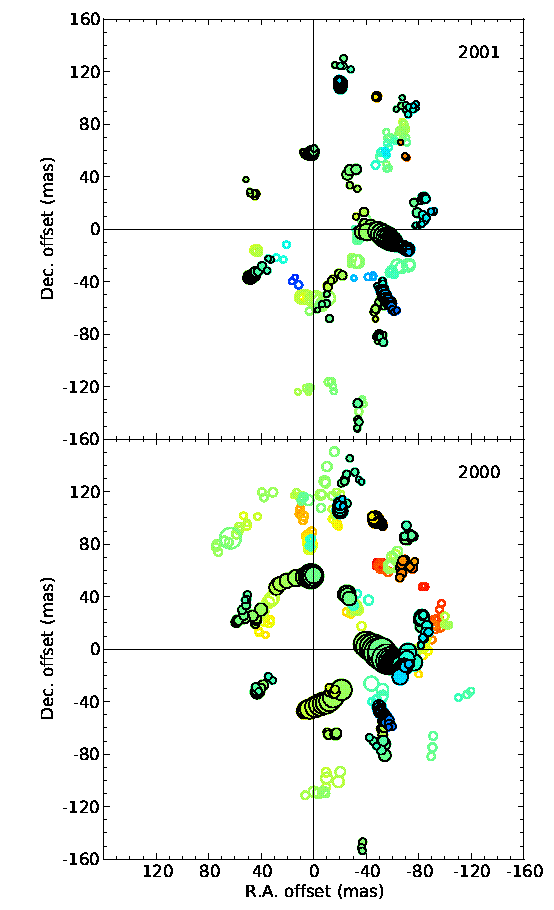
The maser component positions are shown in Figs. LABEL:VXSGR_Match_xyplot.png to 14. Maser components separated by a few milli-arcsec form series in adjacent channels which we term features. Our selection criteria imply that valid features must have a broader minimum total velocity span, if they were observed with broader channels. In the case of S Per and VX Sgr, the number of features remains similar despite changes in channel width, probably because the broader channels provided greater sensitivity. However, the sensitivity was reduced (due to worse weather and shorter observing times) for the 2000–2001 IK Tau epochs, despite the doubling of channel width compared with 1994. This may explain why significantly fewer features were detected at the later epochs.
The measured parameters for all sources are given in Appendix B, tables 6 to 28. All but the faintest have Gaussian velocity profiles and R11 summarise the evidence that these are discrete, water vapour clouds. We rejected isolated components which did not form a series of at least 3 components in successive channels spanning the average feature size or less. The width of an individual component represents the beamed maser size, but R99 showed that the largest angular separation of components comprising a feature is at least 80% of the physical size of the cloud (as long as the emission is not resolved-out). Feature parameters are given in Appendix B, Tables 6 to 28.
Note that the individual components represent the line of sight through the cloud where masing is strongest in the velocity interval sampled by the channel. The arangement of series of components represents the velocity gradient with position but it does not necessarily show the full shape of the cloud. A linear or curved series of components can arise from a spherical cloud, especially if the masers are tightly beamed. This was discussed further in R11, who selected well-resolved components and features for beaming analysis whereas here we include all data. In addition, in aligning the epochs for U Her, we found a few misallocated components and revised a few feature properties, and we also improved the fitting of shell limits slightly for some sources/epochs. Hence, there are small discrepancies between their table 2 and our Table 2. This does not affect any of the results in R11 except to reduce the scatter slightly in some of the analysis involving feature properties.
| Star | Date | ||||||||||||||
|---|---|---|---|---|---|---|---|---|---|---|---|---|---|---|---|
| (yymmdd) | mas2 | mJy b-1 | (AU) | (km s-1) | (km s-1 AU-1) | (Jy) | (AU) | (km s-1) | |||||||
| VX Sgr | 940426 | 51 | 85 | 350 | 9.0 | 20.0 | 0.57 | 0.04 | 520 | 92 | - - | 294 | |||
| VX Sgr | 990116 | 42 | 95 | 355 | 10.0 | 20.5 | 0.54 | 0.04 | 497 | 97 | 42 | 102 | |||
| S Per1 | 940324 | 17 | 55 | 175 | 9.0 | 16 | 0.51 | 0.06 | 1040 | 93 | - - | 72 | |||
| S Per | 990110 | 8 | 30 | 165 | 8.5 | 22 | 0.56 | 0.23 | 689 | 100 | 40 | 47 | |||
| U Ori | 940417 | 12 | 10 | 32 | 2.5 | 7.0 | 0.88 | 0.20 | 95 | 14 | - - | 26 | |||
| U Ori | 990109 | 20 | 12 | 36 | 2.5 | 5.5 | 0.72 | 0.13 | 94 | 12 | - - | 44 | |||
| U Oriϕ | 000410 | 25 | 7 | 36 | 2.0 | 6.0 | 0.65 | 0.14 | 187 | 33 | 0 | 8 | |||
| U Oriϕ | 010506 | 27 | 7 | 29 | 2.0 | 5.5 | 0.68 | 0.16 | 212 | 25 | 9 | 10 | |||
| U Her | 940413 | 14 | 13 | 47 | 4.0 | 9.5 | 0.69 | 0.16 | 282 | 34 | - - | 22 | |||
| U Her | 000519 | 40 | 10 | 41 | 3.0 | 8.0 | 0.72 | 0.16 | 412 | 48 | - - | 141 | |||
| U Herϕ | 010427 | 35 | 10 | 41 | 3.0 | 8.0 | 0.72 | 0.16 | 324 | 36 | 20 | 38 | |||
| IK Tau1 | 940415 | 10 | 16 | 66 | 5.0 | 16 | 0.82 | 0.22 | 1490 | 256 | - - | 25 | |||
| IK Tauϕ | 000520 | 35 | 16 | 72 | 6.0 | 18 | 0.73 | 0.21 | 502 | 72 | - - | 84 | |||
| IK Tauϕ | 010427 | 40 | 20 | 72 | 6.0 | 18 | 0.73 | 0.21 | 236 | 40 | 24 | 24 | |||
| RT Vir | 940416 | 12 | 6 | 25 | 4.0 | 10 | 0.65 | 0.32 | 847 | 55 | - - | 394 | |||
| RT Vir | 960405 | 25 | 4.5 | 19 | 3.5 | 11 | 0.80 | 0.52 | 494 | 59 | - - | 389 | |||
| RT Vir | 960421 | 30 | 4.5 | 19 | 3.5 | 11 | 0.80 | 0.52 | 512 | 52 | 23 | 516 | |||
| RT Vir | 960429 | 15 | 4.5 | 19 | 3.5 | 11 | 0.80 | 0.52 | 586 | 50 | 25 | 526 | |||
| RT Vir | 960515 | 25 | 4.5 | 19 | 3.5 | 11 | 0.80 | 0.52 | 551 | 41 | 33 | 727 | |||
| RT Vir | 960524 | 20 | 4.5 | 19 | 3.5 | 11 | 0.80 | 0.52 | 483 | 51 | 36 | 706 | |||
| RT Vir | 960612 | 35 | 4.5 | 19 | 3.5 | 11 | 0.80 | 0.52 | 433 | 38 | 29 | 791 | |||
| W Hyaϕ | 990209 | 65 | 6 | 25 | 3.5 | 5.5 | 0.31 | 0.11 | 216 | 29 | - - | 32 | |||
| W Hyaϕ | 000405 | 55 | 6 | 25 | 3.5 | 5.5 | 0.31 | 0.11 | 152 | 17 | 5 | 95 | |||
| W Hyaϕ | 010430 | 40 | 7 | 16 | 3.5 | 5.5 | 0.55 | 0.22 | 147 | 18 | 7 | 137 | |||
| W Hyaϕ | 020405 | 50 | 6 | 16 | 3.5 | 5.5 | 0.46 | 0.20 | 125 | 16 | 9 | 268 | |||
2.1 Finding the centre of expansion and aligning epochs
We initially assume that the winds are dominated by radial expansion from the central star. Yates & Cohen (1994) describe finding the centre of expansion by fitting a thick shell in 3 dimensions to angular radius and velocity. This gives well-constrained results for shells which are symmetric along any axis passing through the centre, although not necessarily spherical. This was used for objects with well-filled CSEs, i.e. all epochs of VX Sgr, S Per and RT Vir and early epochs of IK Tau and U Her. Many of the individual epochs of AGB stars are poorly filled and asymmetric, and for these we assumed that emission at close to should appear within a thick ring centred on the position which maximises the average angular separation from the centre of expansion. Bains et al. (2003) found that the two methods gave similar results for the 1994 observations of RT Vir, IK Tau and U Her. We used the second method for all epochs of U Ori and W Hya and for the later epochs of U Her and IK Tau.
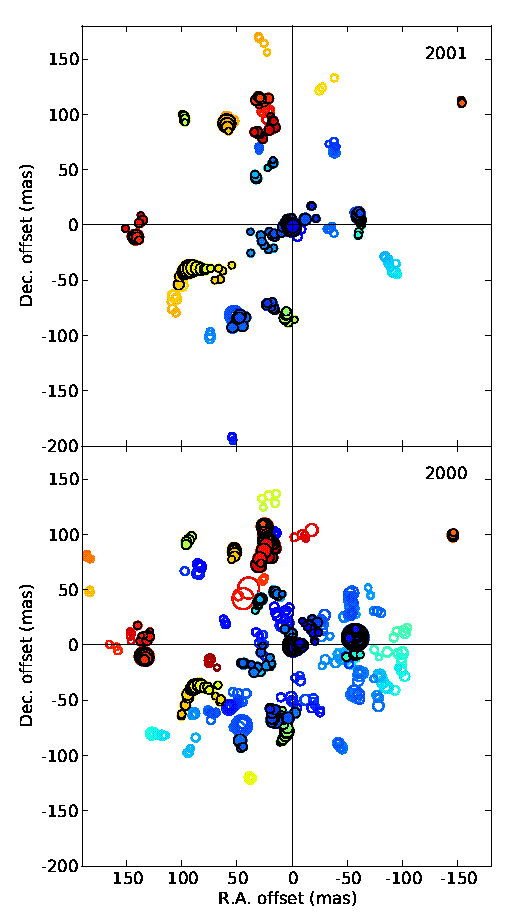
We then aligned successive epochs of the same star using the initial estimates of the centres of expansion and looked for matching features, allowing for proper motions consistent with the spectral extent of the H2O maser shell. Matches were found for those epochs listed in Table 2 as having features in common with the previous epoch. Components belonging to matched features are outlined in black in Figs LABEL:VXSGR_Match_xyplot.png to 14. The criteria used are described in more detail and the results are analysed further in Section 3.
Having identified potential matches, we refined the alignment by minimising the sum of the offsets of matched features (Richards et al. 1998) and if necessary applied additional shifts to the epoch with the greater uncertainties. These were in the range 1–5 milli-arcsec for all sources except W Hya, where the uncertainties are greater in declination and adjustments up to 10 milli-arcsec were needed. In the cases of U Ori and IK Tau, where phase-referenced positions were available at two epochs each, the adjustments were within the uncertainties of the astrometry (see below). The component positions in Figs LABEL:VXSGR_Match_xyplot.png to 14 are given relative to the matched centres of expansion for each star.
2.2 Phase referencing results
All positions are given in J2000 ICRF. Phase referencing was used at the epochs marked in Table 2. For U Ori and W Hya, we also used a more distant source to provide initial phase-rate and amplitude solutions, allowing fainter sources within 2° to be used for phase solutions. In all cases, the maser peaks were bright enough to give better signal-to-noise in a single spectral channel, than were the phase-reference sources observed in the maximum available 13-MHz bandwiths. There are 4 factors which contribute to the position uncertainty:
-
1.
The noise-based error in measuring the position by fitting a Gaussian component, negligible ( mas) for the brightest masers and for the phase reference sources unless otherwise stated.
-
2.
The uncertainty in transfering the phase solutions between reference source and maser. This is estimated from the sky separation in minutes of time, e.g. 2° = 8 min . We examine the phase drift in the equivalent time on the raw data for a bright source observed continuously for many minutes, usually the bandpass calibrator. A typical phase drift of half a turn corresponds to half a beam position uncertainty. This assumes that the atmospheric effects are the same throughout the observations; if the weather or the elevation changed significantly we added an allowance for this.
-
3.
The phase reference position uncertainty. The target positions have been adjusted to the most accurate positions available.
-
4.
Uncertainty in the telescope positions. This is about 1 cm, wavelength at 22 GHz, on the longest MERLIN baseline, giving an uncertainty of about one beam (see Table 2).
The naturally-weighted beam size must be used for these estimates. Only 1. affects data for different components in a single source at a single epoch. 3. and 4. do not affect data taken using the same array and the same phase-reference at different epochs. The uncertainties for each target and phase reference source are given in the paragraphs following. Where possible, we initially transfered the phase reference solutions to the maser and then repeated the process in the opposite direction. This provides two independent estimates of the position of maser emission in the reference channel. The discrepancy is used to refine the estimate of error 2. In other cases, the phase reference source was too weak to detect until after applying the maser solutions.
We used Hipparcos positions and proper motions (van Leeuwen 2007), to predict the stellar positions of U Her, U Ori and W Hya at our epochs of observation. The formal errors, derived from the uncertainties in position at epoch 1991.25 and in the proper motions, are 10–20 mas. The optical position of IK Tau is less well known due to its highly obscured location, having an uncertainty of about 100 milli-arcsec in either coordinate (e.g. Zacharias et al. 2005). We compare these positions with our estimates of the centres of expansion derived from the masers, assumed to be the stellar positions.
U Ori
(Fig. 7) The phase reference source J0552+1913 at 05:52:25.8858 +19:13:40.275, uncertainty (10, 10) milli-arcsec (Browne et al. 1998), just over 1° from U Ori, was used in 2000 and 2001. The brightest maser channel was at km s-1, at both epochs. This is close to and thus the maser feature will have a significant proper motion in the plane of the sky due to the expansion of the CSE, as well as to stellar proper motion. We therefore compared the positions of the centre of expansion. These were 05:55:49.1699 +20:10:30.624 and 05:55:49.1697 +20:10:30.619 in 2000 and 2001, respectively, fitting uncertainty (5, 5) mas, total astrometric uncertainty (23, 32) milli-arcsec per epoch. This corresponds to a proper motion of (–3, –5) mas, which, although close to the fitting uncertainties, is in a direction similar to the Hipparcos proper motion of (–12.12, –6.13), uncertainty (1.52, 0.73) milli-arcsec yr-1. The positions of U Ori derived from Hipparcos were 05:55:49.1697 +20:10:30.685, uncertainty (14, 7) mas, and 05:55:49.1688 +10:30.679 (15, 7) mas, in 2000 and 2001, respectively. The positions derived from the masers are offset by (3, –61) and (13, –60) milli-arcsec from the estimated Hipparcos positions. The combined uncertainties are (27, 35) mas. The good agreement between the expansion centres estimated independently from the maser emission at the two epochs suggests that our alignment is accurate. If the star really was at the location calculated using the Hipparcos data, it would be at the outer edge of the maser shell (opposite to the maser peak), which suggests that there is an unrecognised source of astrometric error of order tens of milli-arcsec in one or both sets of data.
U Her
(Fig. 9) The phase reference source J1635+1831 at 16:35:39.1588 +18:31:03.723, uncertainty (7, 12) milli-arcsec (Browne et al. 1998) at 2°.4 separation from U Her, was used in 2001. We obtained a position for the centre of expansion of U Her of 16:25:47.4710 +18:53:32.887, with a fitting uncertainty of (4, 4) milli-arcsec and a total astrometric uncertainty of (20, 32) mas. The Hipparcos position at this epoch is 16:25:47.4702 18:53:32.841, uncertainty (6, 7) mas. The position derived from masers is offset by (11, 46) mas, close to the combined uncertainties. The brightest U Her maser feature observed in 2001 is at –15.88 km s-1, position 16:25:47.4668 +18:53:32.879, total extent 29 mas, 2.1 km s-1. Vlemmings et al. (2002) carried out MERLIN observations less than 4 weeks later, optimised for astrometry by using 3 phase reference sources and a velocity resolution of 0.42 km s-1. They found the brightest feature at –15.7 km s-1, position 16:25:47.468 +18:53:32.849 (10, 10). Our position is offset from this by (–17, 30) mas, within the combined uncertainties for observations with the same array but different reference sources
IK Tau
(Fig. 11) The phase reference source J0409+1217 at 04:09:22.0087 +12:17:39.845, uncertainty (0.2, 0.2) milli-arcsec (Titov 2004), 4° separation, was used in 2000 and 2001. The bright, blue-shifted feature used for self-calibration is within 1 milli-arcsec of the centre of expansion at 03:53:28.8919 +11:24:21.940, and 03:53:28.8924 +11:24:21.932 in 2000 and 2001, respectively, fitting uncertainty (3, 3) mas, total astrometric uncertainties (30, 42) milli-arcsec and (33, 43) mas. The 2001 position is offset from the 2000 position by (5, –8) mas. This is less than expected from the optically measured proper motions, of (23.5, –26.1) or (8, –80) milli-arcsec yr-1 from NOMAD (Zacharias et al. 2005) or the PM2000 Bordeaux Proper Motion catalogue (Ducourant et al. 2006), respectively. The 2001 maser-derived position is (137, –86) milli-arcsec from the Bordeaux position at the same epoch, 03:53:28.8825 +11:24:22.018, uncertainty (27, 27) mas. The NOMAD position differs from both by a total of 075 (015) (with greater discrepancies at the earlier epoch).
W Hya
(Fig. 14) The phase reference source J1342-2900 at 13:42:15.345598 –29:00:41.83163, uncertainty (0.3, 0.8) milli-arcsec (Petrov et al. 2011), under 2° separation, was used at all epochs. W Hya has a high proper motion, (149, –60) milli-arcsec and the phase-referenced maser positions were offset in the expected direction from the pointing position (by 2–3 arcsec) but the positions at each of the 4 epochs differed by several tenths of an arcsec or more from the positions predicted from Hipparcos data, in a non-systematic fashion. Phase transfer at such low elevation was not accurate enough to give astrometrically useful results.
In conclusion, the phase referencing results for U Ori and IK Tau vindicate the methods used to align the epochs. However, the uncertainties in our measurements and the Hipparcos data are too great for sufficiently accurate comparison to confirm that the star is located at the centre of expansion. Vlemmings et al. (2002) suggest that the brightest feature in U Her is in the line of sight to the star itself. Our model places it at a separation of about 40–60 milli-arcsec from the centre of expansion. Unfortunately, the uncertainties are just too great to distinguish between these models astrometrically. Such tests will have to wait for imaging of the radio star and masers simultaneously with e-MERLIN, as was done for W Hya by Reid & Menten (1990) using the VLA.
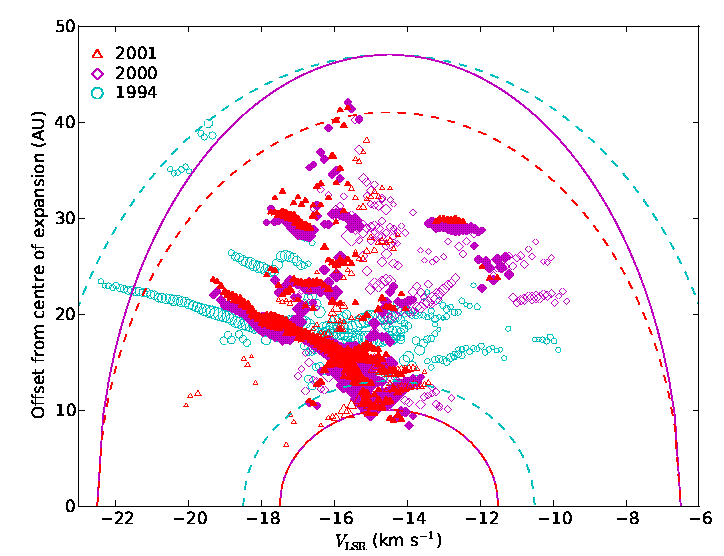
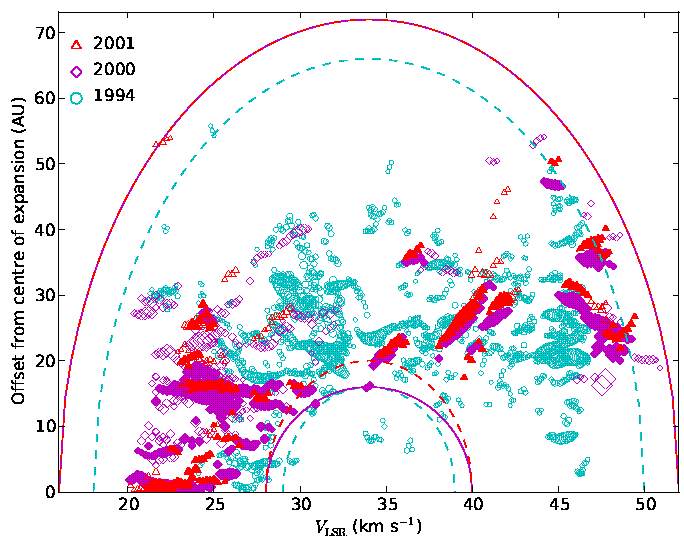
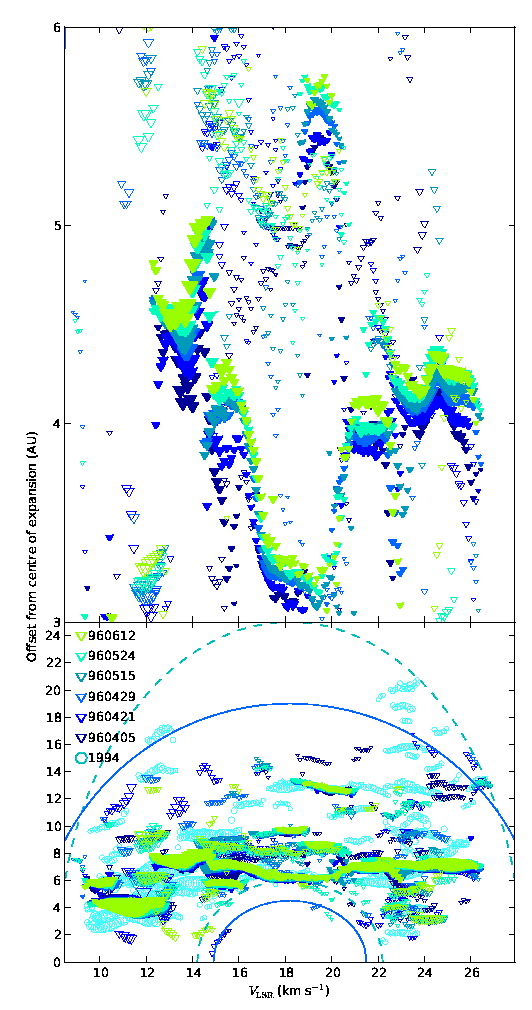
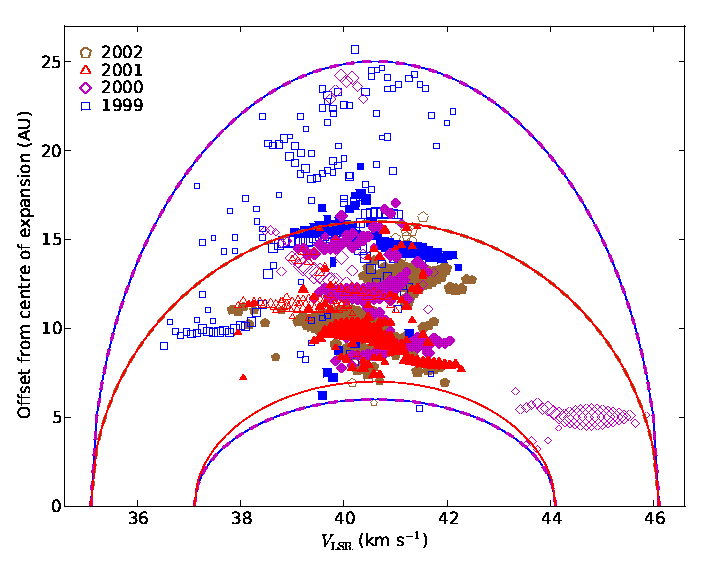
2.3 Maser shells
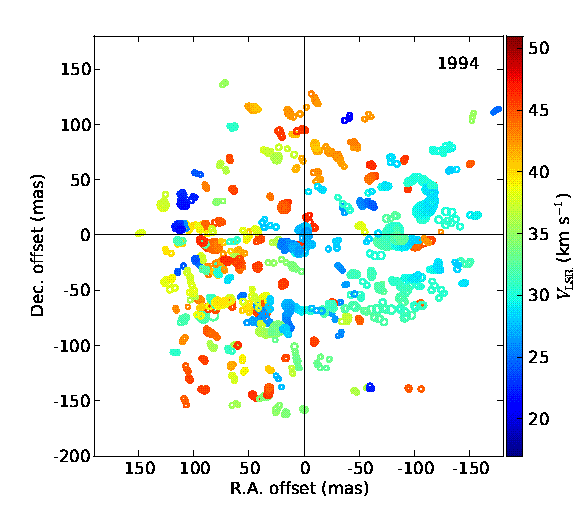
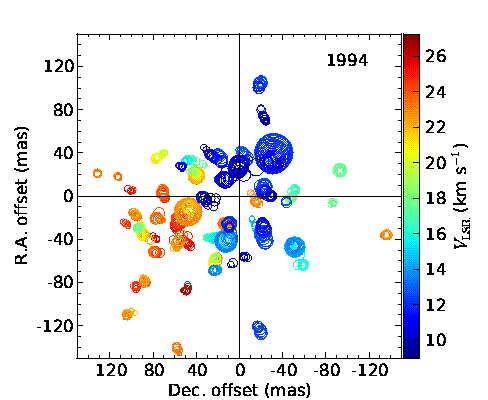
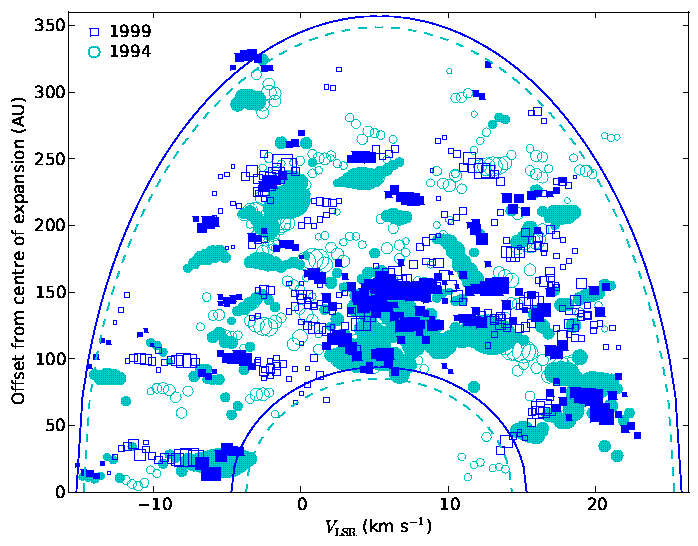
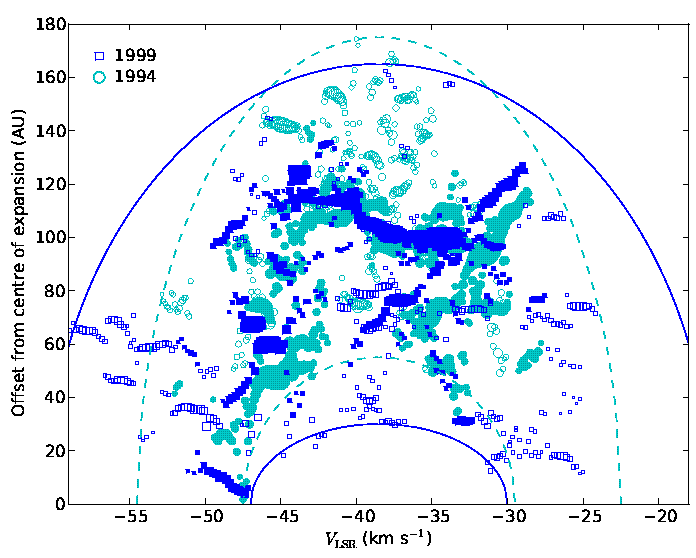
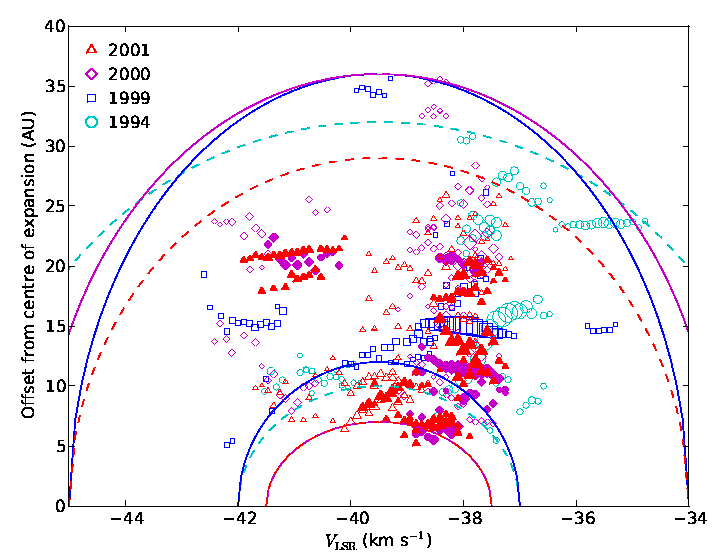
Figs. 15 to 21 show the maser separations from the centre of expansion projected against the plane of the sky, , as a function of , centred at . We fitted ellipses by eye to the inner and outer limits of the 22-GHz maser emission, giving the inner and outer radii and expansion velocities of spherical shells, , , and . The velocity gradient is given by
| (1) |
and the logarithmic velocity gradient by
| (2) |
These parameters are given in Table 2 and used to investigate the mass loss as a whole in Section 5.1.
3 Feature persistance and proper motions
We matched features at successive epochs as described in Section 2.1. The numbers matched with the previous epoch are given in Table 2. We required the mean feature velocities to coincide to within a thermal line width 1.4 km s-1 for H2O in the maser shell. We allowed potential feature matches between epochs if the corresponding proper motions did not exceed the maximum expansion velocity , plus an allowance for position inaccuracy and feature size. For reference, an expansion velocity of 5 km s-1 corresponds to a proper motion of AU yr-1 (4–10 milli-arcsec yr-1 for the AGB stars at 266–99 pc, and 2–3 milli-arcsec in 5 yr for the RSG at 2.3–1.7 pc, using the stellar distances given in Table 1). We tested the the angular and velocity search regions by decreasing or increasing them by 50%. We also tested whether matches were random coincidences by offsetting one epoch by the match radius in and before looking for matches. Since one of the goals of this project was to investigate the CSE kinematics, we did not want to impose conditions on the directions of proper motions.
We found 5 or more matched pairs of features between the RSG epochs 5 years apart and between most AGB epochs separated by 1 year or less (up to 3/4 of all features in successive epochs). The number of closest matches are listed in Table 2. Changing the match radius led to fewer matches or more multiple matches but few if any new unique matches. Applying shifts reduced the number of matches to 25% or fewer, suggesting that the majority of the listed matches are correct.
We only analyse reliable matches, using the above criteria and requiring the majority of matches to be unique. In some cases we found possible matches over longer AGB epoch separations but, as the potential proper motion and hence search radius increased, there were more multiple matches and as many matches were found after applying a shift as before, so these cannot be used.
More details are given for each source:
VX Sgr
We used a maximum allowed separation of 23 milli-arcsec in 5 yr, and about half of all features were matched.
S Per
We used a maximum allowed separation of 13 milli-arcsec in 5 yr, and about half of all features were matched.
U Ori
We used a maximum allowed separation of 12 milli-arcsec in 1 yr, or 30 milli-arcsec in 5 yr. We only found reliable matches between 2000–2001, for about 1/3 of the features.
U Her
We used a maximum allowed separation of 12 milli-arcsec in 1 yr, or 45 milli-arcsec in 6 yr. About 1/2 of the features were matched from 2000–2001. Some possible matches were seen between 1994–2000 but none were unique and a similar number of matches were seen after applying the test shifts. After comparing the evolution of the H2O maser shells as a whole in Section 6.1, we found that the ring of emission seen in U Her in 1994 could have expanded to the location of the outer ring seen at later epochs, suggesting the persistence of a large-scale structure.
IK Tau
We used a maximum allowed separation of 14 milli-arcsec in 1 yr, or 50 milli-arcsec in 6 yr. About 1/2 of the features were matched from 2000–2001. Some possible matches were seen between 1994–2000 but none were unique and a similar number of matches were seen after applying the test shifts. No obvious patterns appear to survive.
RT Vir
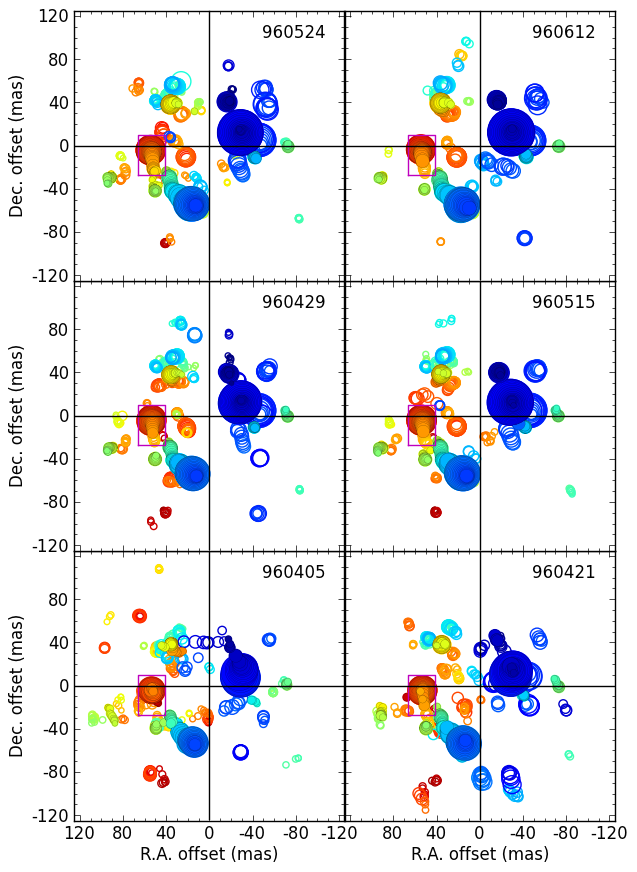
We used a maximum allowed separation of 9 milli-arcsec over 10 weeks in 1996, and 25 milli-arcsec for 1994–1996. Between 1/2 and 3/4 of features were traced from epoch to epoch in 1996, with eleven (about 1/4) being identified at all six epochs. No matches were found between 1994–1996.
W Hya
We used a maximum allowed separation of 20 milli-arcsec in 1 yr; 1/3 to 1/2 of the features could be matched from one year to the next, including six at three successive epochs. No features were matched for all four epochs.
3.1 Identification of features
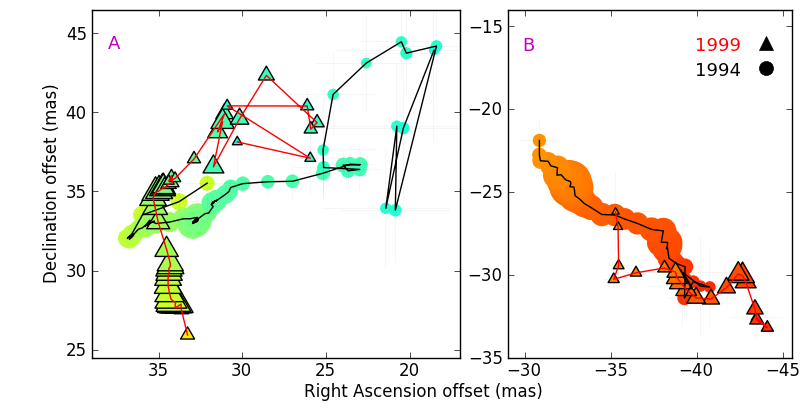
We are confident that in most of the matched features, we are seeing masers from the same cloud, for two main reasons. Firstly, the 22-GHz H2O masers clouds are much denser than the average wind density (R99, B03, M03, Section 5.2). Secondly. the more extended features (better-resolved in the higher-declination sources) often show a comparable internal structure. This can be seen for some, although not all of the matched features in Figs. 5, 9 11 and 13. We zoom in on two examples from S Per and one from RT Vir.
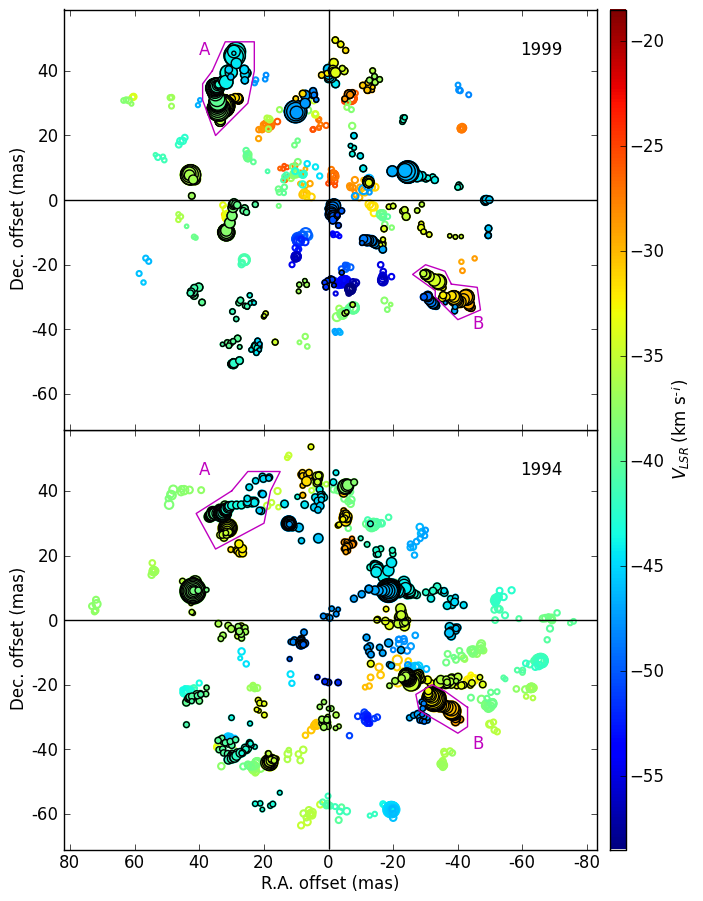
Fig. 5 shows a series of features labelled A, around (30,35) mas, peaking at –46 – –47 km s-1, which appears to have been rotated counterclockwise by about 60° between epochs (as well as bulk motion to the S). Another pair of features labelled B, at around (–37, –25) mas, –30 km s-1 are made up of a radial spoke of components. seen more clearly in the enlargement in Fig. 22.
What effects produce these variations within features? Bulk rotation could be responsible for the changes shown in Fig. 22 (left). This consists of a series of 4 matched features (separate spectral peaks) whose components form a spatially and spectrally continuous series, taken to be a single, intrinsically asymmetric (amboid) cloud, with internal density variations. After removing the mean proper motion of the cloud (3 mas), it is rotating anticlockwise at km s-1. The feature in Fig. 22 (right) shows an almost radial gradient of velocity with position, with two slight wiggles seen at both epochs (with greater position uncertainty in 1999 as it has become fainter). The proper motion corresponds to an expansion velocity km s-1.
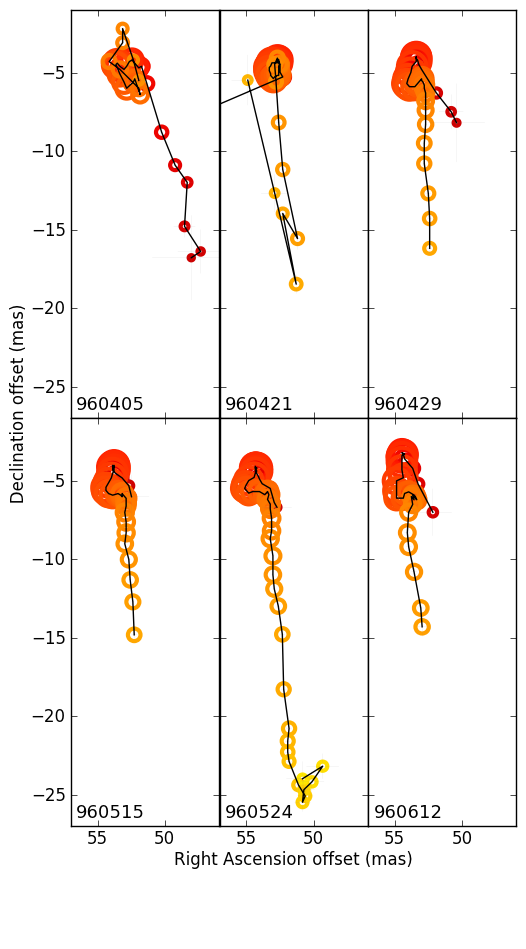
One of the matched RT Vir features is shown in detail in Fig. 23. The bright head of the ‘tadpole’ has a similar appearance at all epochs, but it has two faint tails; the more redshifted one is seen in 960405, 960429 and (a short piece) 960612, and the less redshifted (orange-yellow) tail in 960421, 960429, 960515, 969524 and 960612. Turbulence inside the feature could affect the beaming intensity and/or direction, for example causing the higher-velocity (redder) tail to fade and to be replaced by a lower-velocity tail. Note that the most sensitive observations were made in 960429 and 960524 (Table 2), hence the remnant of the red tail and the longest extension of the new tail seen at these epochs, respectively. The tails have extents AU and a separation of about 0.5 AU. If the change is due to a single disturbance, this must be broad enough to affect both regions almost simultaneously, since a localised, non-dissociative shock could not traverse the distance in the short time intervals of a few weeks between observations. Alternatively, the entire cloud has rotated about an axis close to the plane of the sky such that beaming from different angles was favoured.
If the clouds are approximately spherical and the masers are amplification-bounded, the brightest emission at the line centre is tightly beamed along the line of greatest amplification. Small changes in the cloud will have little effect on the apparent location of this emission although they may affect the appearance of weaker, less strongly beamed emission from the line wings. On the other hand, flattened or shocked clouds may possess matter-bounded masers which are less tightly beamed. R11 found that U Ori, U Her and to a lesser extent IK Tau possess some matter-bounded masers, whilst the other sources studied are mostly amplification-bounded.
Overlapping clouds along the line of sight can produce strong amplification of a single feature, see Section 6.2. The survival of maser features is discussed in Section 4.2.
3.2 Expansion proper motions
We aligned the results from successive epochs for each source and matched features as outlined in Section 2.1. Table 3 gives the error-weighted proper motions; for multi-epoch matches, we performed least squares fits to position as a function of time. The mean total proper motion (and formal uncertainty) is . We independently estimated mean proper motions in the radial and tangential directions, and .
In a few cases the direction of has a large scatter and and are consequently small and of low significance. This is most noticeable at the earlier, noisiest epochs of W Hya, probably due to measurement errors. Since its values of change sign from epoch to epoch, they are probably not significant. The U Ori proper motions also show more random behaviour. Coupled with the failure to match features in the one-year interval between 1999–2000, this suggests that the U Ori CSE is particularly subject to turbulence or other disruption. Many of its H2O masers appear matter-bounded, hence less tightly beamed, so that the apparent centroid may be shifted easily by small disturbances (see Section 3.1 and R11).
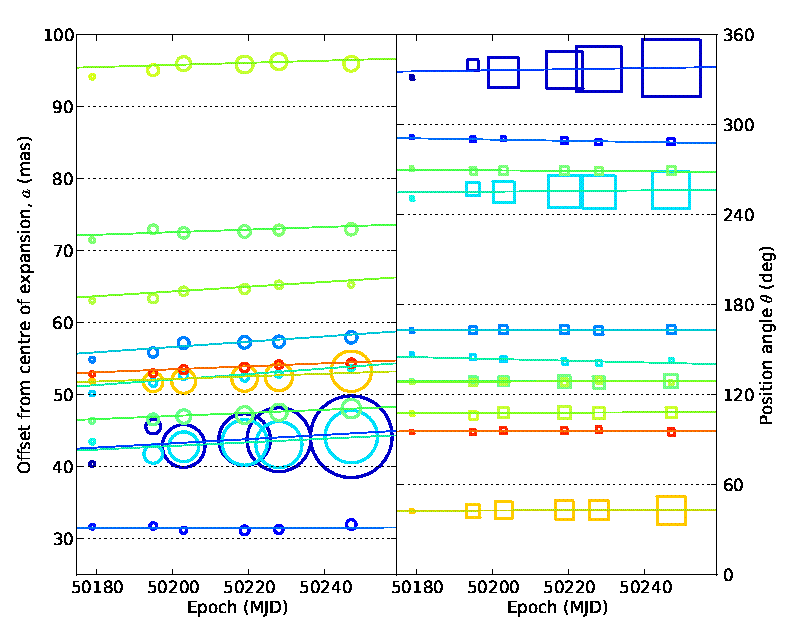
In all other cases the radial motions are in expansion, and exceed . This is best illustrated by Fig. 24 which shows for the 11 RT Vir features matched at all 6 epochs. In fact, is negligible for most sources. IK Tau maser proper motions are clearly dominated by expansion but a small rotational component cannot be ruled out, although this is . This is also the case for U Ori although the majority of the proper motion measurements are in scattered directions, as mentioned above.
| Source | Epochs | ||||
|---|---|---|---|---|---|
| (mas yr-1) | (mas yr-1) | (mas yr-1) | (km s-1) | ||
| VX Sgr | 94–99 | ||||
| S Per | 94–99 | ||||
| U Ori | 00–01 | ||||
| U Her | 00–01 | ||||
| IK Tau | 00–01 | ||||
| RT Vir | 96(11) | ||||
| RT Vir | 96(55) | ||||
| W Hya | 99–00 | ||||
| W Hya | 00–01 | ||||
| W Hya | 01–02 | ||||
| W Hya | 99–00–01 | ||||
| W Hya | 00–01–02 |
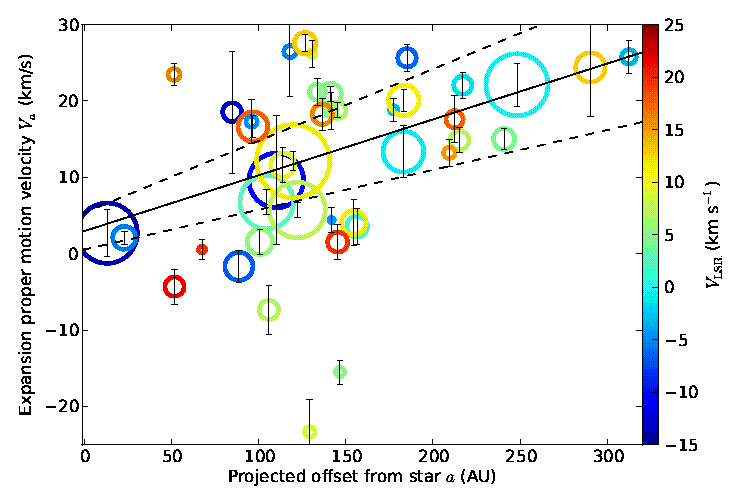
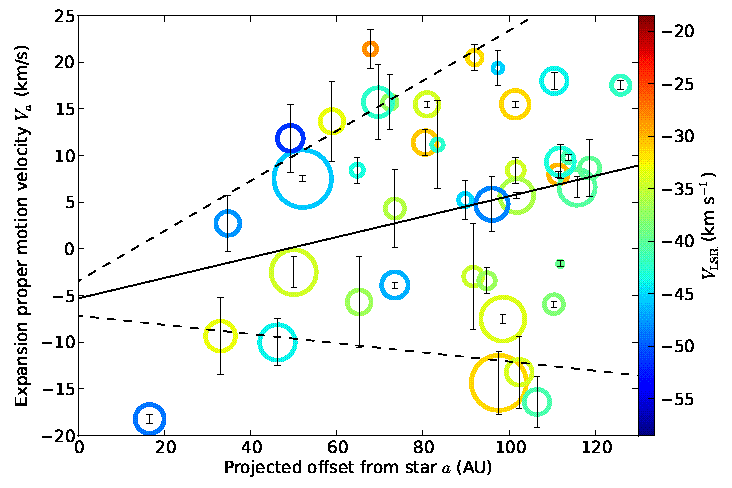
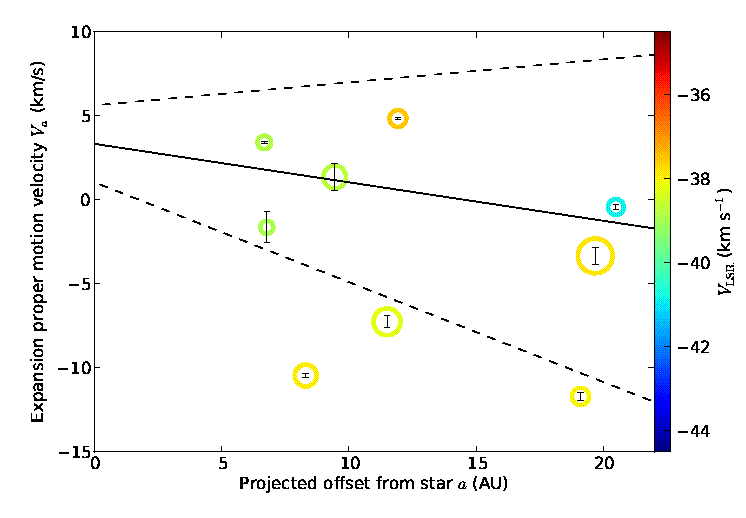
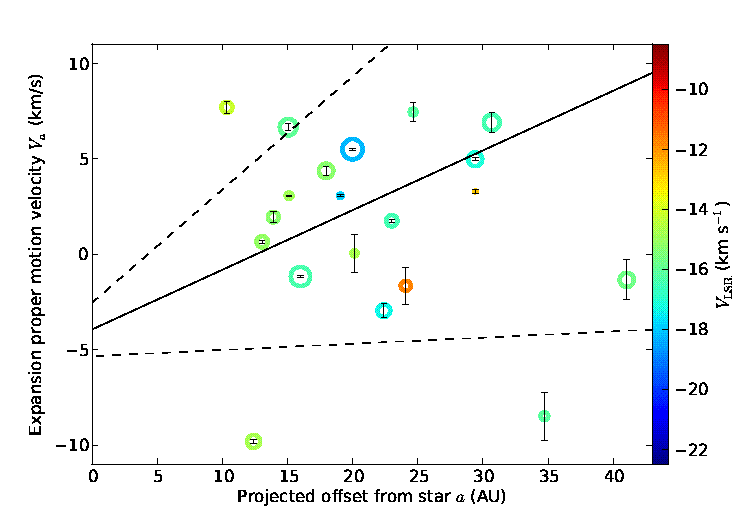
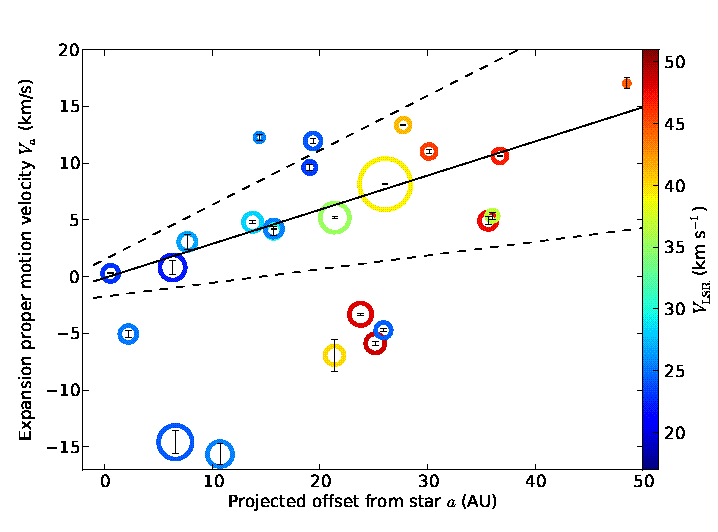
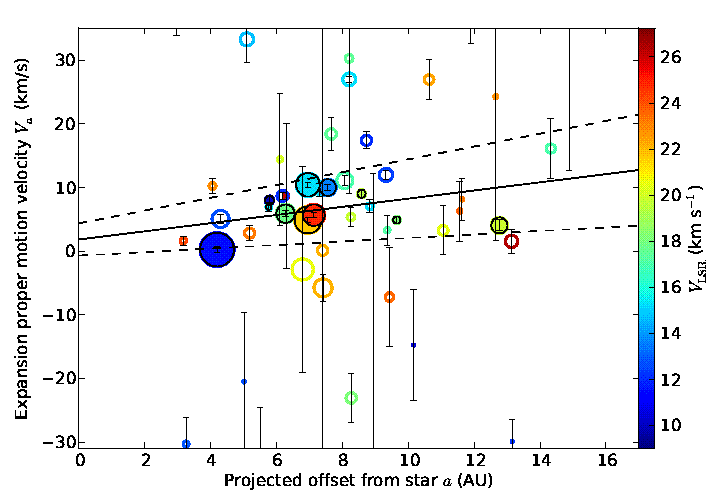
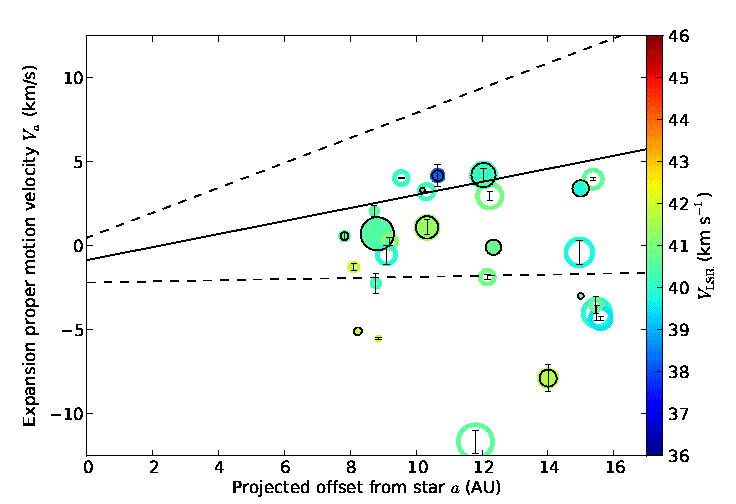
Figs. 25 to 31 show expansion proper motion velocity as a function of mean angular separation from the centre of expansion, , for the data in Table 3. We performed a linear error-weighted fit to find the slope () and found the dispersion in the relationship (the formal errors are very small). This gives an estimate of wind acceleration in the plane of the sky. The RSG, VX Sgr and S Per have of and km s AU-1, respectively. The Miras U Her and IK Tau have of and km s-1 AU-1, respectively. The SRb RT Vir has km s-1 AU-1 for the 11 features matched at all epochs; if 2–5-epoch matches are considered, the scatter is greater but the slope is also positive. W Hya has km s-1 AU-1 for the 3-epoch matches and additional 2-epoch matches in 2001–2002. The only exceptions to the positive gradients are U Ori, km s-1 AU-1, and W Hya 1999-2000, km s-1 AU-1, probably due to a more turbulent maser shell and to greater uncertainties, respectively, as discussed above.
For VX Sgr, S Per, IK Tau, U Her, RT Vir and the better W Hya data, is positive. It is close to (Table 2), within the dispersions, for all measurements apart from VX Sgr, where is slightly greater; this may be due to the axisymmetry of the outflow, modelled by M03. In the other objects the velocity field appears to be approximately spherically symmetric.
These results are consistent with previous proper motion measurements. Yates & Cohen (1994) identified IK Tau features (at lower resolution) surviving for 16 months. Marvel et al. (1998) observed several objects including VX Sgr, S Per, U Her and IK Tau for three epochs during 1995. They deduced that the masers are distributed in multiple thin shells or random clumps. They found that an ellipsoidal model fitted most data better than a spherically symmetric shell, but comparison between their figures and our 1994 plots suggests that fainter, extended emission was resolved out by the VLBA. The proper motions are predominantly directed radially outward, consistent with the maser velocities at distances similar to those given in Table 1. Asaki et al. (2010) performed astrometric monitoring of S Per with VERA to obtain the parallax. The maser proper motions were consistent with a combination of bulk proper motion and a spherically expanding flow. Imai et al. (2003) monitored RT Vir using the VLBA for 5 epochs in 1998. The tendency for the E and W to be dominated by red- and blue-shifted emission is seen in their results as well as in our Figs. 12 and 13 although the brightest masers occur in different locations. They also find expansion (not rotation) proper motions, with at least one feature showing strong acceleration. Note that they use a distance of 220 pc and so obtain proper motion velocities almost double those resulting from the distance we adopt (Table 1).
4 Comparison with single dish data
These targets are among a large number of 22-GHz maser sources which have been monitored by the Pushchino Radio Telescope for several decades. Some results have already been published in Pashchenko & Rudnitskii (1999) (VX Sgr); Lekht et al. (2005) (S Per); Rudnitskij et al. (2000) (U Ori); Mendoza-Torres et al. (1997) and Lekht et al. (1999) (RT Vir). Earlier epochs of W Hya monitoring were published by Rudnitskii et al. (1999).
| Source | Date | Peak | ||
| Telescope | (YYMMDD) | (km s-1) | (Jy) | (Jy km s-1) |
| VX Sgr | ||||
| Pushchino | 940329 | 13.1 | 548 | 2696 |
| MERLIN | 940426 | 13.0 | 360 | 26611 |
| Pushchino | 981110 | 6.3 | 352 | 3208 |
| MERLIN | 990116 | 6.3 | 147 | 1521 |
| Pushchino | 990119 | 6.4 | 321 | 3027 |
| S Per | ||||
| Pushchino | 930303 | –37.83 | 22.9 | 232 |
| MERLIN | 940324 | –37.86 | 63.6 | 222 |
| Pushchino | 940329 | –37.50 | 51.9 | 188 |
| Pushchino | 981228 | –37.72 | 69.3 | 311 |
| MERLIN | 990110 | –37.75 | 45.2 | 286 |
| Pushchino | 930303 | –37.74 | 63.5 | 371 |
| U Ori | ||||
| Pushchino | 940328 | –37.3 | 33.0 | 30 |
| MERLIN | 940417 | –37.3 | 25.4 | 23 |
| Pushchino | 940517 | –37.3 | 28.6 | 26 |
| Pushchino | 981230 | –37.8 | 105.0 | 84 |
| MERLIN | 990109 | –38.0 | 58.7 | 46 |
| Pushchino | 990121 | –37.8 | 85.8 | 74 |
| Pushchino | 000223 | –37.8 | 29.3 | 42 |
| MERLIN | 000410 | –38.0 | 18.7 | 18 |
| Pushchino | 000613 | –37.9 | 28.1 | 16 |
| Pushchino | 010410 | –37.8 | 25.3 | 31 |
| MERLIN | 010506 | –37.9 | 16.6 | 19 |
| Pushchino | 010530 | –37.8 | 39.2 | 31 |
| U Her 1994 | ||||
| Pushchino | 940329 | –14.9 | 21.7 | 30 |
| MERLIN | 940413 | –15.0 | 22.1 | 44 |
| Pushchino | 940517 | –14.9 | 32.1 | 56 |
| Pushchino | 000425 | –15.6 | 186.3 | 406 |
| MERLIN | 000519 | –15.5 | 209.1 | 254 |
| Pushchino | 000529 | –15.6 | 182.3 | 267 |
| Pushchino | 010411 | –15.8 | 93.5 | 118 |
| MERLIN | 010427 | –15.6 | 52.5 | 62 |
| Pushchino | 010528 | –15.7 | 73.2 | 96 |
| IK Tau 1994 | ||||
| Pushchino | 930422 | 31.8 | 34.9 | 89 |
| MERLIN | 940415 | 31.4 | 24.3 | 48 |
| Pushchino | 941109 | 31.7 | 24.7 | 222 |
| Pushchino | 000425 | 24.9 | 106.4 | 279 |
| MERLIN | 000520 | 24.4 | 117.5 | 360 |
| Pushchino | 000530 | 24.6 | 113.0 | 414 |
| Pushchino | 010409 | 24.2 | 13.4 | 66 |
| MERLIN | 010427 | 24.4 | 22.6 | 107 |
| Pushchino | 010529 | 24.4 | 23.8 | 118 |
| RT Vir | ||||
| Pushchino | 940328 | 12.6 | 489.4 | 943 |
| MERLIN | 940416 | 12.6 | 394.0 | 590 |
| Pushchino | 940808 | 12.6 | 186.0 | 797 |
| Pushchino | 960319 | 11.9 | 791.0 | 1605 |
| MERLIN | 960405 | 11.8 | 389.0 | 680 |
| MERLIN | 960421 | 11.5 | 515.5 | 1190 |
| MERLIN | 960429 | 11.5 | 526.3 | 1325 |
| MERLIN | 960515 | 11.4 | 727.2 | 1475 |
| MERLIN | 960524 | 11.4 | 705.5 | 1415 |
| MERLIN | 960612 | 11.3 | 791.6 | 1418 |
| Pushchino | 960619 | 11.3 | 359.9 | 648 |
1Measured over the same velocity range as the Pushchino data.
2The Pushchino data only cover part of the spectrum.
| Source | Date | Peak | ||
| Telescope | (YYMMDD) | (km s-1) | (Jy) | (Jy km s-1) |
| W Hya | ||||
| Pushchino | 990119 | 39.9 | 128.6 | 245 |
| MERLIN | 990209 | 39.8 | 91.0 | 177 |
| Pushchino | 990310 | 39.8 | 174.7 | 323 |
| Pushchino | 000331 | 40.4 | 81.4 | 176 |
| MERLIN | 000405 | 40.6 | 59.2 | 1691 |
| Pushchino | 000425 | 40.4 | 169.8 | 304 |
| Pushchino | 010411 | 40.4 | 377.3 | 413 |
| MERLIN | 010430 | 40.4 | 163.8 | 204 |
| Pushchino | 010904 | 40.3 | 554.8 | 471 |
| Pushchino | 020326 | 40.2 | 690.8 | 917 |
| MERLIN | 020405 | 40.2 | 296.9 | 335 |
| Pushchino | 020422 | 40.2 | 202.5 | 255 |
1At this epoch, a peak of 90.8 Jy was seen in the MERLIN W Hya spectrum at 44.7 km s-1. No emission above 10 Jy was detected by Pushchino at the adjacent epochs around this velocity. The integrated MERLIN flux density excluding this feature is 106 Jy km s-1
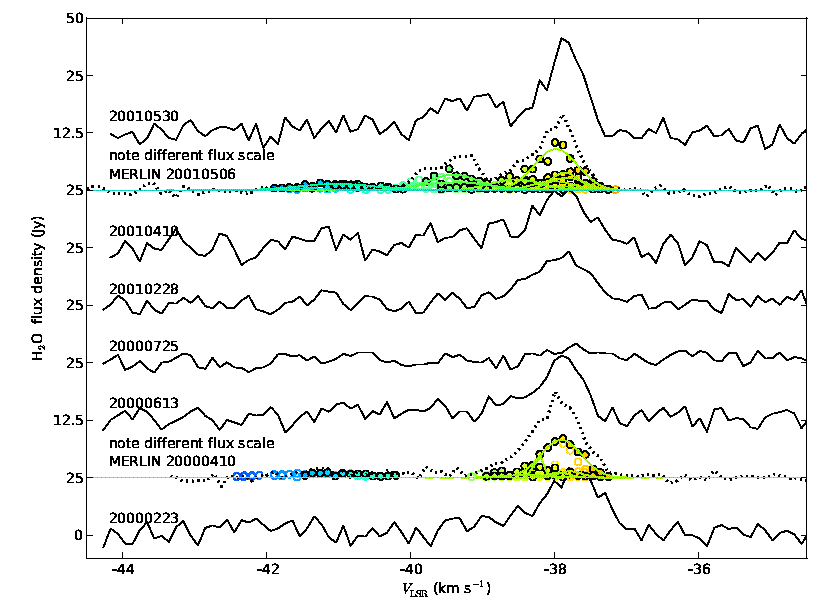
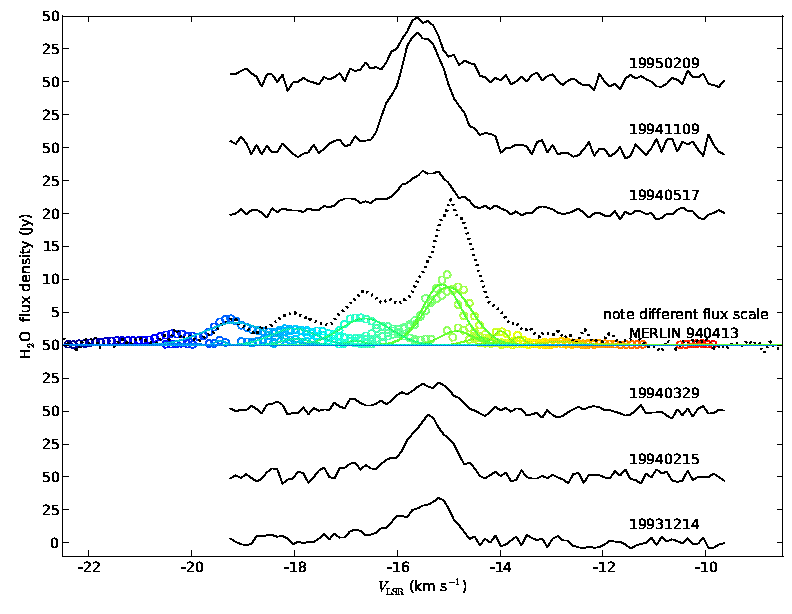
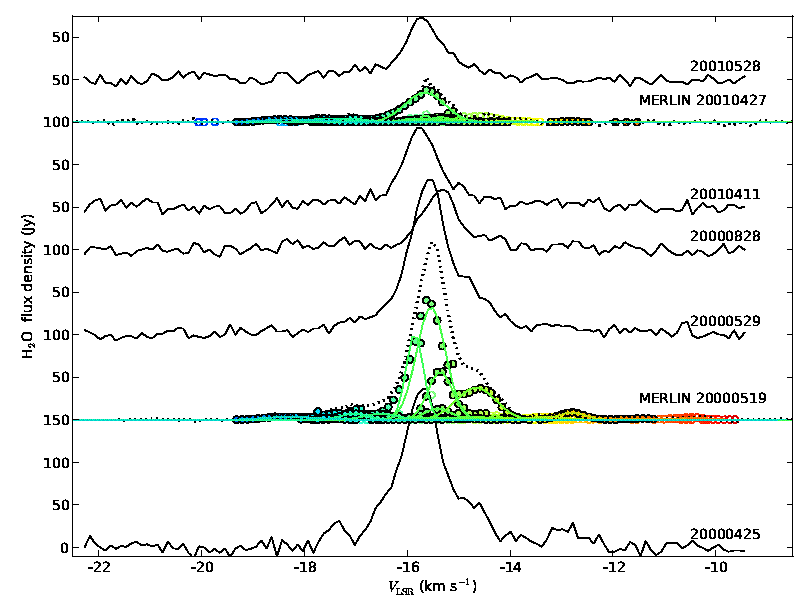
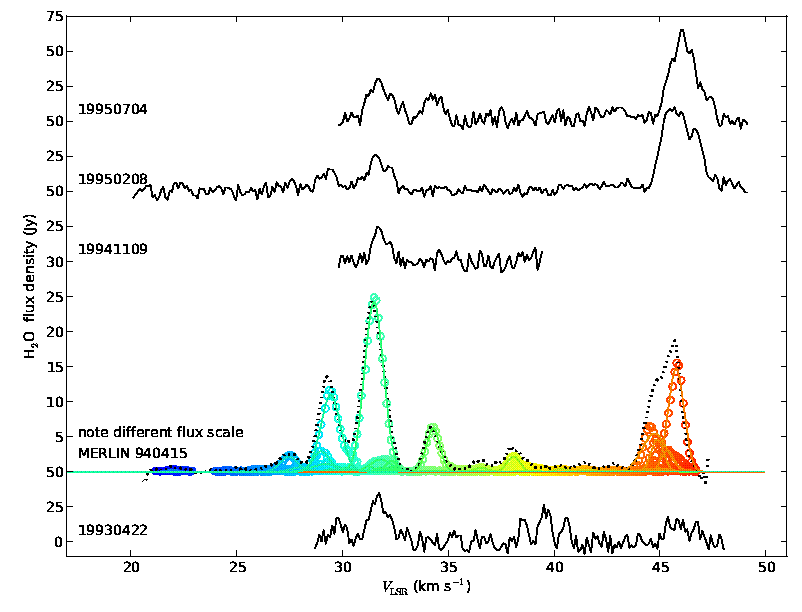
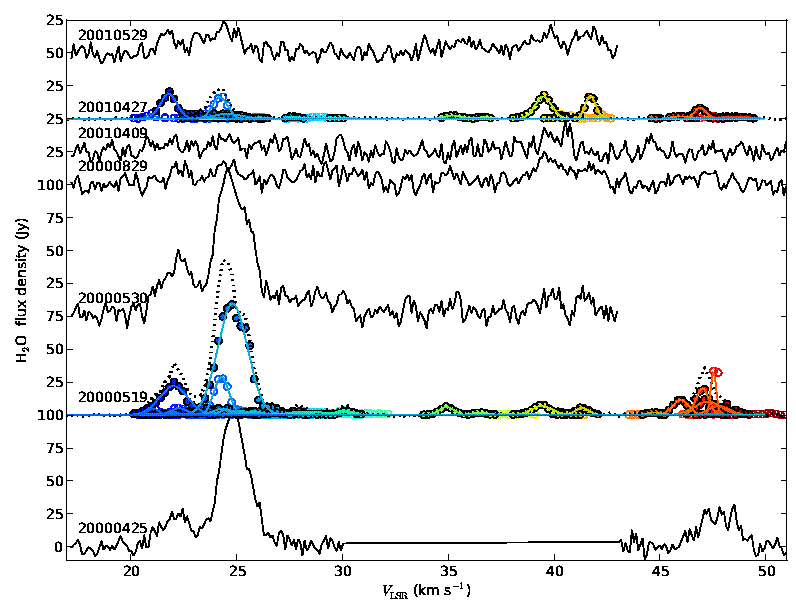
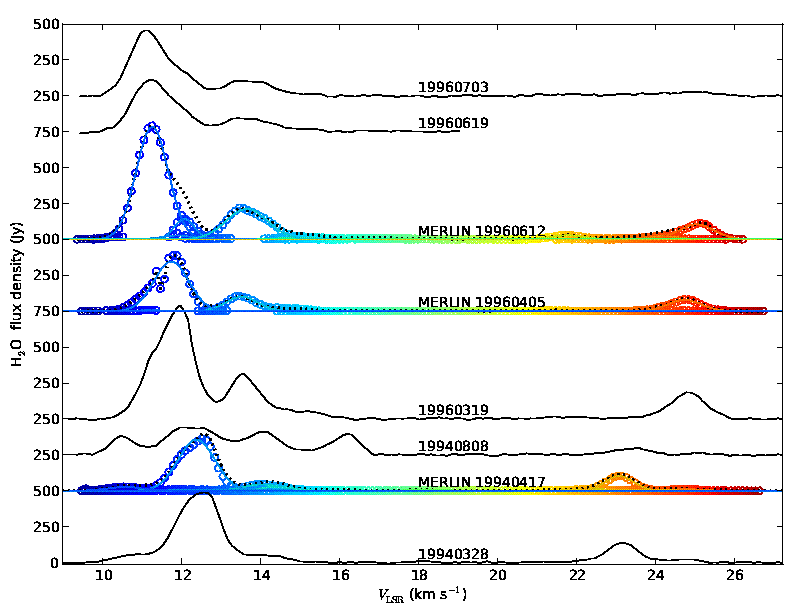
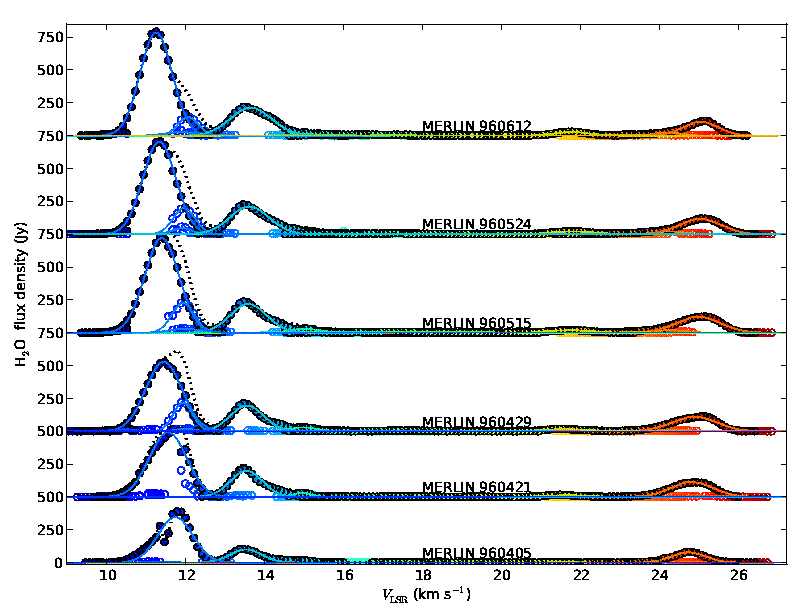
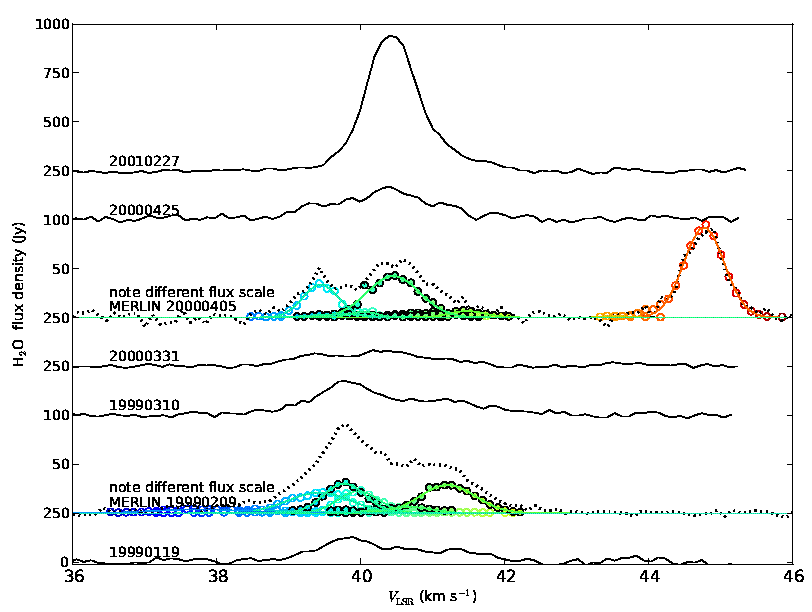
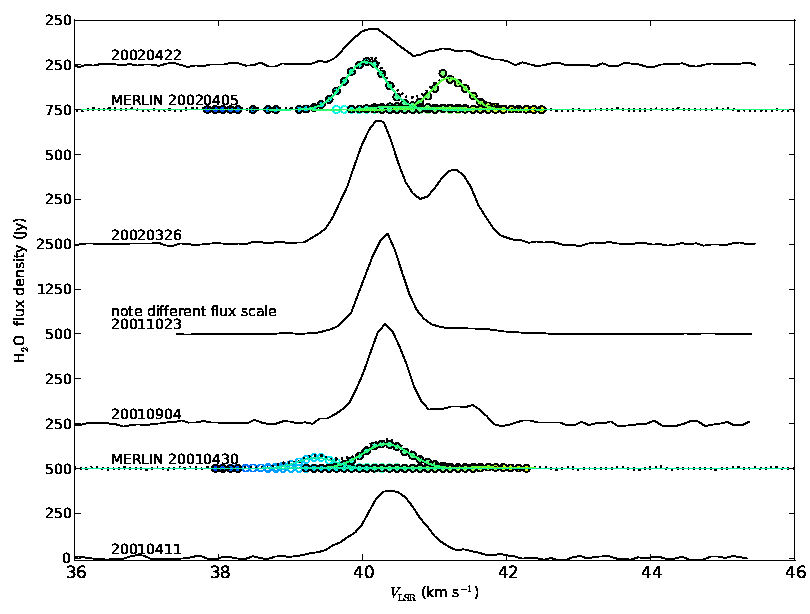
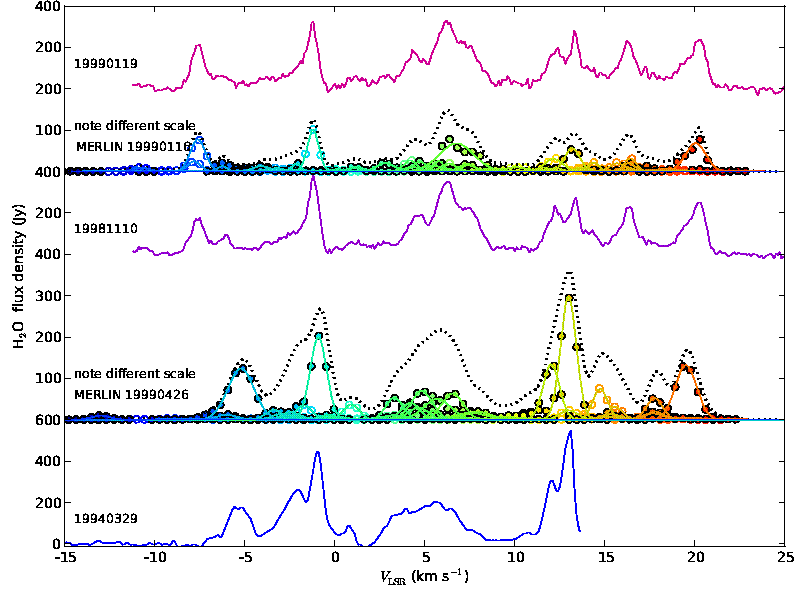
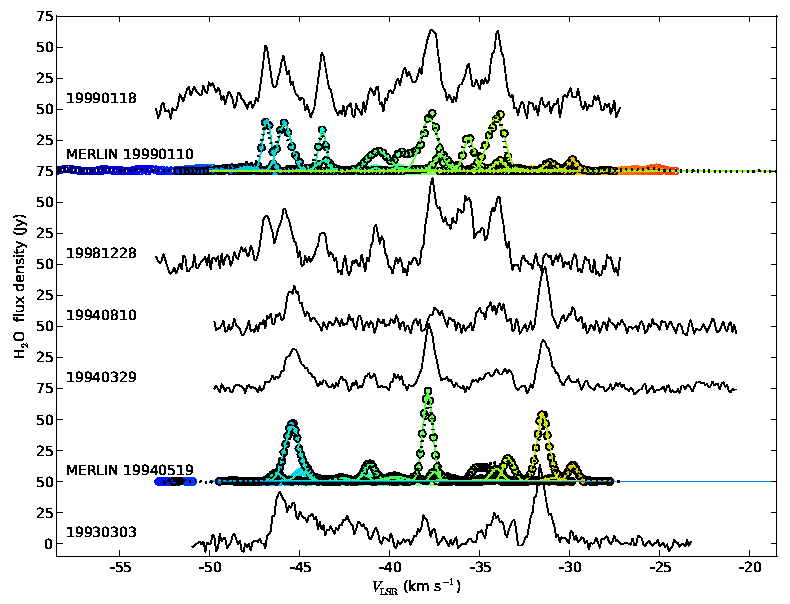
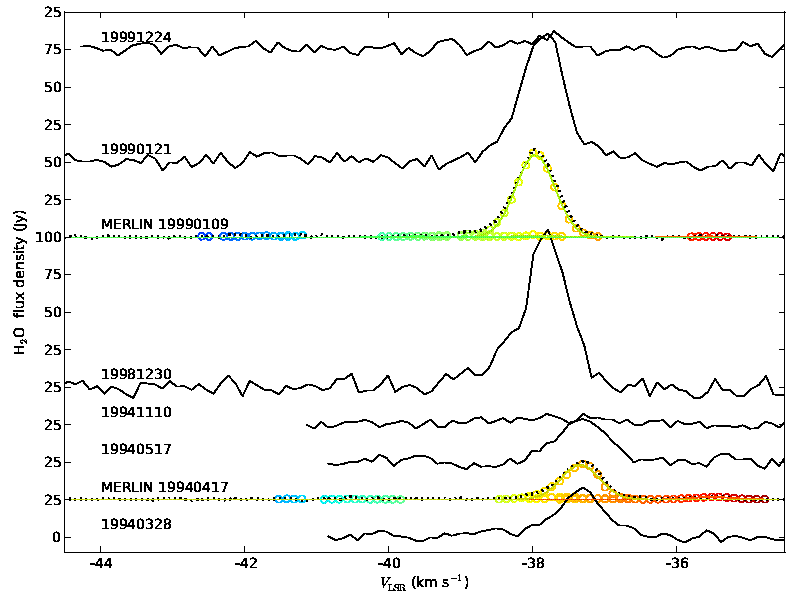
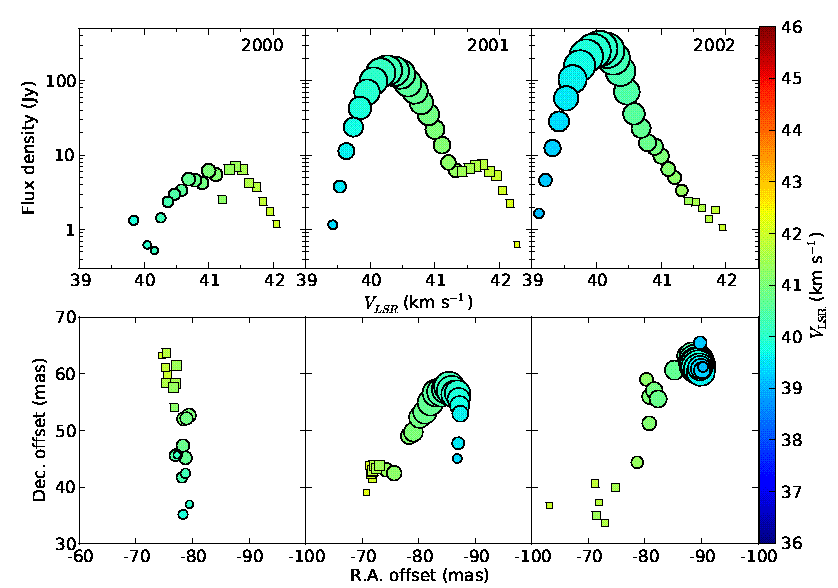
The sensitivity limit is Jy ( 2–4 Jy) and the spectral resolution is 0.101 km s-1 (close to the MERLIN resolution of 0.105 km s-1 at most epochs). We show the MERLIN velocity profiles and the Pushchino spectra taken closest in time, along with a few intermediate epochs, in Figs. 32 to 43. The epochs shown here are superimposed (blue lines) on AAVSO light curves in Figs. 1 to 3. The Pushchino absolute velocities are uncertain at some epochs due to local oscillator problems so we applied a velocity shift , given in the figure captions, to align the Pushchino spectral peaks with the MERLIN peaks. This correction is only accurate to within a few tenths km s-1 as some the spectral features show drifts of this magnitude when comparing different epochs taken with the same instrument.
The dotted black lines in Figs. 32 to 43 show the integrated MERLIN velocity profiles. The circles show the individual maser components, outlined in black for features matched at successive epochs. The coloured lines show the Gaussian profiles fitted with accuracy to individual features. Comparison with the Puschino data shows that the maser flux densities vary greatly on timescales of a few weeks. Trends in spectral variability and velocity drifts are analysed in detail in the references given at the start of Section 4. Here, we consider two questions: does MERLIN recover all the flux, and what does spectral monitoring reveal about cloud survival when compared with imaging?
4.1 Flux detected by MERLIN interferometry
The shortest MERLIN baseline of 20 km means that emission which is smooth on scales milli-arcsec cannot be imaged reliably. We tabulate the peak flux densities at the closest epochs in Table 4. The irregular nature of maser variability means that we cannot interpolate reliably between Pushchino measurements bracketing a MERLIN measurement. In some cases, a new feature emerges or disappears in observations made a few weeks apart. We can only investigate whether MERLIN consistently records lower peaks or less integrated flux () than Puschino.
RSG For VX Sgr, the MERLIN:Pushchino (M:P) peak ratio is between 0.42 – 0.66. However, the MERLIN spectral resolution is much coarser, at 0.42 km s-1, which can dilute the flux density of narrow peaks. The original 0.21 km s-1 resolution used in 1994 gave a peak of 375 Jy (Richards 1997) and the integrated flux density at this epoch is very similar for both instruments. For S Per, in 1994 M:P is between 2.8–0.65 and the integrated flux densities are very similar for most adjacent epochs.
Miras For U Ori, M:P is in the range 0.42 – 0.89. However, the source is relatively weak and the differences are only significant in 1999. The MERLIN integrated flux densities are slightly closer to the Pushchino values, exceeding it at one epoch. For U Her, M:P lies in the range 0.56 – 1.1 and for IK Tau M:P is between 0.7 – 1.7, and the integrated flux densities can be higher or lower at adjacent epochs.
SR For RT Vir, in 1994 M:P 0.81 – 2.1 (in the latter case the gap is longer than usual, 15 weeks). In 1996, six MERLIN observations were made over 10 weeks during which the peak flux rose from 389 to 792 Jy but M:P changed from 0.49 to 2.2. The integrated flux densities behave similarly. For W Hya, M:P is in the range 0.30–1.5, but the Pushchino peak and integrated flux densities exceed the MERLIN values for all but the final epoch.
MERLIN clearly recovers most of the flux (within the flux scale uncertainty of 10% for MERLIN and the 10 Jy accuracy limit for Pushchino) for S Per, U Her, IK Tau and RT Vir. This also seems likely for VX Sgr, taking the broader channel width into account, and for U Ori, which is at a very similar distance as U Her and IK Tau, so it is unlikely to be more resolved, but it cannot be ruled out that some of its flux has been missed. It is possible that more than 10% of the emission from W Hya has been resolved out, since it is the closest source, although its low elevation during observations makes the flux scale even less accurate. Therefore, we regard measurements of cloud size or flux density to be lower limits for W Hya.
4.2 Maser features and their parent clouds
Section 2.1 describes how we were able to match some maser features in successive MERLIN epochs (numbers listed in Table 2). Many are spatially distinct in the MERLIN images but spectrally blended in Pushchino observations; however, some of the brightest have unambiguous counterparts. We investigate the spectral variability of these features in the more closely time-sampled Pushchino spectra.
VX Sgr
M03 described how about half the VX Sgr maser features detected in 1994 were also identified in 1999. The brightest spectral peaks are present in the intervening epochs (Pashchenko & Rudnitskii 1999).
S Per
Forty S Per MERLIN features were unambiguously matched at both MERLIN epochs. Three peaks dominate the 1994 MERLIN spectrum and the Pushchino spectra at the closest epochs, see Fig. 33. The blue-shifted peak at –46 – –47 km s-1 is seen at all Pushchino epochs (an additional, more blue-shifted feature appears after 1997). The red-shifted peak becomes fainter after 1994 and in the 1999 MERLIN spectrum it is under the 10 Jy Pushchino limit. These are seen with a similar internal structure by MERLIN at both 1994 and 1999 (Fig. 22).
The central peak around km s-1 exceeds 40 Jy and is spatially compact at both MERLIN epochs. However, it has faded in Pushchino spectra taken at 19940810, a few months after the 1994 MERLIN epoch, and is absent for most of 1995-6 and all of 1997 (Lekht et al. 2005). It re-appears in the 19981228 and later Pushchino spectra as well as in the MERLIN 1999 data.
U Ori
Nine U Ori MERLIN features were matched at 2000 and 2001. The brightest emission, just under 20 Jy, is close to –38 km s-1 (Fig. 35). This is dominated by the feature at (–40, –15) milli-arcsec (Fig. 7). The Puschino spectrum shows a corresponding peak of 20–40 Jy at the closest epochs. However, no emission above 10 Jy was detected from U Ori in intermediate spectra, e.g. 20000725.
U Her
Twenty U Her MERLIN features were matched at 2000 and 2001. The peak, around –15.5 km s-1, was seen at all Pushchino epochs between these dates.
IK Tau
Twenty-four IK Tau MERLIN features were matched at 2000 and 2001. In 2000, the 75-Jy peak at 25 km s-1 corresponds to the feature at (–50, 10) milli-arcsec and the 25-Jy peak at 22 km s-1 corresponds to the feature at (0,0) milli-arcsec (Fig. 11). Fig. 39 shows that the 25 km s-1 peak declines abruptly after 20000530. The IK Tau H2O maser shell is well-filled, with several features contributing to the spectral peaks. It is possible that the 25 km s-1 peak was a flare due to clouds overlapping along the line of sight, similar to that described for W Hya in Section 6.2. The 22 km s-1 feature is present in the 2001 MERLIN spectrum at a similar flux density, 21 Jy, to that seen in 1994. The blue-shifted peaks cannot be distinguished in the 200000819 and 20010409 spectra but are present in 20010529.
RT Vir
Many features were matched between six epochs of RT Vir MERLIN data taken over 10 weeks in 1996 but there are no intervening Pushchino spectra. Fig. 41 shows that the strong blue- and red-shifted RT Vir peaks show systematic increases in with epoch, totalling 0.43 and 0.17 km s-1 in 10 weeks, respectively, consistent with the strong acceleration seen in proper motions (Section 3; see also Imai et al. 2003).
W Hya
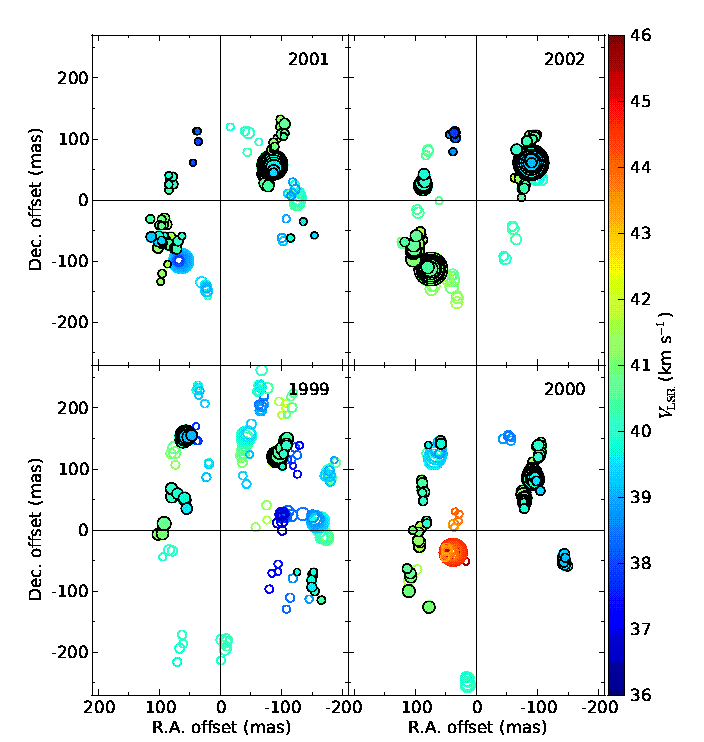
Between five and nine W Hya MERLIN features were matched between successive epochs in 1999, 2000, 2001 and 2002. The brightest part of the MERLIN spectrum in 1999 is made up of a number of features so their individual behaviour is hard to trace in the Pushchino spectra. However, the 30-Jy feature at 41.1 km s-1 seen in 1999, located at (–95, 120) has a much fainter counterpart in 2000 (Figs 42 and 14). Faint emission was also detected at the same velocity in 2001 and rises to 160 Jy in 2002, but this is located on the opposite side of the CSE at (–70, –110) (Figs 43 and 14). The 2001–2002 flare is discussed in Section 6.2.
Fig. 1 to 3 show that the intervals over which masers can be matched spans several stellar periods in the case of VX Sgr, S Per and W Hya, and nearly two periods for U Her and IK Tau. U Ori features were matched across one interval close to the stellar period, but not in another, whilst RT Vir features were only matched over intervals less than one stellar period. There is no obvious correlation between maser survival and the number of periods or the phase. In other interferometric studies, Winnberg et al. (2011) found that U Her maser components have an average lifetime of 0.5–1 yr and Winnberg et al. (2008) obtained a lifetime yr for RX Boo. In general, single dish observations are affected by spatial blending and may overestimate maser lifetimes, but we note that Lekht et al. (1999) analysed 12 yr of Pushchino monitoring of RT Vir and found 22 spectral features persisting for 0.66 yr or more, only 5 of which lasted longer than 2 yr.
The time taken for the wind to to reach a given distance in the 22-GHz maser shell is calculated using the velocity gradient (Table 2), assuming linear, radial acceleration and good coupling of dust and gas velocities for the H2O maser clouds:
| (3) |
and the total shell crossing time from to , is , given in Table 5. This is about 10–15 yr for SRbs, 20–35 yr for Miras and 35–90 yr for the RSGs. This is the minimum survival time for the clouds as discrete, dense entities, since it is hard to see how they could re-form if disrupted during passage across the water maser shell. On the other hand, most individual maser features become unrecognisable after 2 years or less around AGB stars, and only about half of the RSG features are matched after 5 years, although M03 found that about one fifth survive 16 yr; VY CMa shows similar behaviour (Bowers et al. 1993, Richards et al. 1998).
The comparison with Pushchino data shows that in fact, masers from individual clouds switch off and on again. This is most obvious for S Per, U Ori and IK Tau, where spectral peaks can be clearly identified with spatial features at separate interferometry epochs, but those peaks are missing in the spectra at some intervening single dish monitoring epochs. The smaller the clouds (Table 2), the more short-lived the masers. The sound-crossing times (assuming a sound speed of 3 km s-1) range from 1.5–5 yr for the AGB clouds and 20–25 yr for the RSG. The maser lifetimes are comparable to the time which would be taken for sub-sonic or mildly supersonic shocks to cross the maser clouds. Fig. 22 shows a localised, non-radial disturbance propagating at km s-1. These might temporarily disrupt the maser altogether, or simply cause it to beam in a direction we cannot detect.
5 Acceleration and density of maser clouds
The inner and outer maser shell limit measurements reveal the kinematics (Section 5.1). We then use the individual cloud sizes to estimate their contribution to the mass loss (Section 5.2).
5.1 Acceleration
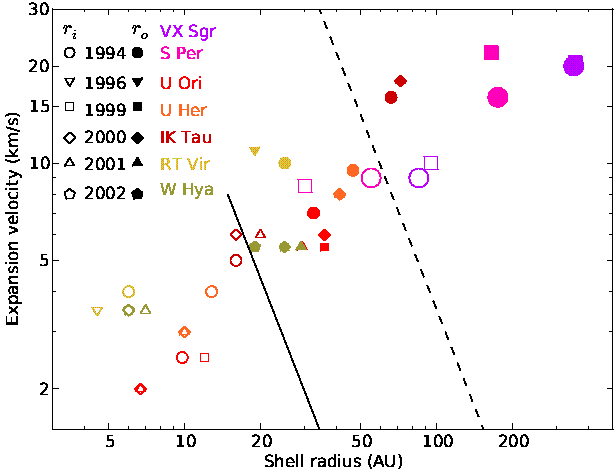
Fig. 44 shows the shell limits for all sources, taken from Section 2.3, Figs. 15 to 21 and Table 2. This demonstrates that the trend for higher velocities at greater distances from the star is similar when comparing different objects which differ in size by an order of magnitude. In all objects, the maser velocity approximately doubles as the wind traverses the maser shells, passing through the gravitational escape velocity in the process. This implies ongoing acceleration beyond the dust formation zone. Ivezić & Elitzur (2010) model the CSE velocity field using changes in optical depth. However, the consistently strong acceleration over such a wide range of objects seen here is likely to require additional force due to changes in the surface properties of the dust as grains anneal in the wind. This was first suggested by Chapman & Cohen (1986) for VX Sgr and is discussed for others among our maser sources by Richards & Yates (1998). Verhoelst et al. (2009) observed correlations between dust composition and outflow velocities for RSG while Decin et al. (2010) modelled Herschel observerations of IK Tau using gradual acceleration.
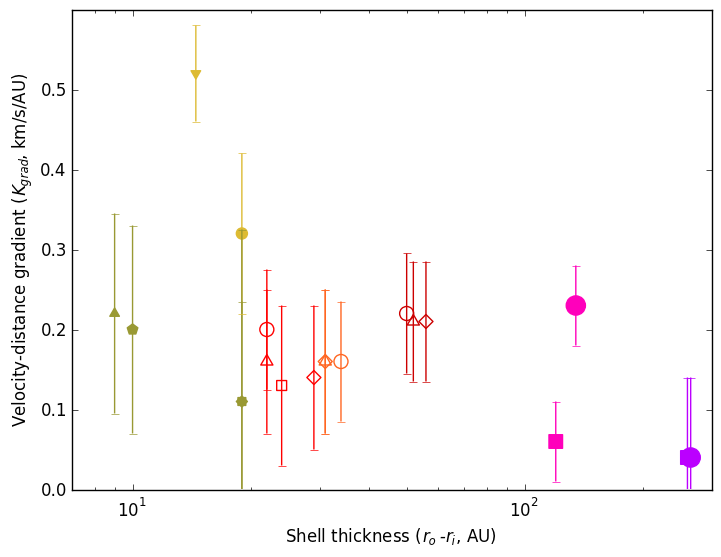
Fig. 45 shows that the SRs, Miras and RSGs form three distinct groups of increasing 22-GHz shell thickness and this is weakly correlated with shallower velocity gradients, , which measure the increase in expansion velocity with distance from the star. is estimated from the measurements along the line of sight. The results in Section 3.2 demonstrate a similar trend for proper motions in the plane of the sky. The SRb RT Vir has the highest gradient of proper motion velocity with position in the shell, , and the other AGB stars with significant results have higher values of than the RSG. The thicker circumstellar envelopes show more gradual acceleration, but eventually reach higher velocities.
A theoretical relationship between and terminal velocity was established by Cooke & Elitzur (1985), who also showed that should determine the 22-GHz shell . The general forms of these relationships (and the acceleration through ) were confirmed observationally by Lane et al. (1987), Yates & Cohen (1994), Bowers & Johnston (1994) and Colomer et al. (2000). However, the observed tend to be much larger than predicted. This implies that the wind is inhomogenous, discussed in Section 5.2.
5.2 Water maser clump density and the mass in clouds
We use the relationship between and to estimate the density of the H2O maser clouds. The density of the stellar wind at radius is , assuming radial acceleration of a smooth medium. If the average particle mass is the mass of molecular hydrogen, . The overall number density of the wind is thus given by:
| (4) |
We use this to find the average number density at , where . The inner edge of the 22-GHz maser shell is determined by the point at which the collision rate falls below the maser emission rate, at the quenching number density . At 1200 K, m-3 (Yates et al. 1997). We assume that this is the density of the clouds at .
The values of given in Table 1 are taken from the literature (adjusted to our adopted distances), using high signal-to-noise CO data, supported by interferometry, where available. However, some objects, notably S Per, have faint CO. Other methods of estimating , such as IR observations of dust, are more model-dependent; the assumed gas:dust ratios vary between about 80 and several hundred. The variations in values of in the literature are a factor of about 5 for most of the objects.
We want to estimate the total number of potentially masing clouds in a shell at any one time, . However, as described in Section 4.2, at any one epoch, some clouds may not be producing masers beamed towards Earth. We attempted to compensate for this using the multi-epoch observations where we should have found reliable matches at neighbouring epochs, i.e. 6 epochs for RT Vir, 4 for W Hya, 3 for U Ori and 2 for the other stars (Section 3). This excludes the 1994 data for the AGB stars. is given by the sum of the number of features at the first epoch (), plus the number of maser features with no previous matches at subsequent epochs ( at end) where = end at the final epoch. We finally subtract the number of clouds likely to have left the shell during the time interval for all epochs considered, ; since this is approximated by the uncorrected value of multiplied by . This approach partially compensates for less sensitive epochs (since a cloud only has to be detected once to be counted) but is still a lower limit if some clouds are present in the CSE but not detected at any epoch. The degree of underestimation may vary from star to star if some have a persistently lower fraction of detectably masing clouds.
| (5) |
The average number of clouds produced per stellar period is given by .
Clouds expanding away from the star under radial acceleration increase in tangential diameter by and in the radial diameter by (Equation 2). Thus, the number density in a cloud at is . We use the brightest part of the maser shell as (see Section 7) to estimate the average mass per cloud in the 22-GHz maser shell:
| (6) |
(making the same assumptions as for Equation 4).
The mass loss rate in clouds is then given by . The filling factor of the clouds by volume is given by .
We apply Equations 4 to 6 to the measurements given in Table 2, averaged for the epochs considered, to derive the parameters tabulated in Table 5. The most striking result is that the H2O maser cloud density at , , is for all sources. What are the main causes of uncertainty in this estimate? The collision rate, and hence , is proportional to (temperature). The assumed temperature is likely to be an upper limit, almost double some estimates for the lower-mass stars (Zubko & Elitzur 2000), so our adopted value of is probably a lower limit. The main uncertainty in , 10 milli-arcsec for W Hya and milli-arcsec for the other sources, arises from determining the stellar position (Section 2.1). At most, this could reduce to 38 for W Hya, and by a smaller proportion for the other sources. In fact, since one of the main criteria in determining the centre of expansion was maximising , the errors are probably lower. is least well-constrained for U Ori and U Her, but these have lower than any other object considered and any increase would increase .
Equation 4 is distance-independent, as long as and are estimated consistently and both have a quadratic dependence on distance. If the highest values of are taken from the literature, this could reduce about fivefold, but it seems very unlikely that all the errors are in the same sense.
The mass loss rate in clouds, is within of the adopted values of . This is a relatively small discrepancy compared to deviations of in the literature, as mentioned above. The space between the clouds cannot be completely empty so that if accurate values were known, and thus, for S Per, U Her and U Ori, either must be higher or the mass in clouds must be smaller (or both).
In all cases, the cloud filling factor by volume is less than 0.01. Using equation (11) of R99, must be less than , where is the cloud number density at any radius. This constrains for U Ori and S Per, or larger values for the other sources, which is not inconsistent with our estimates of .
There are a number of additional sources of uncertainty in our estimates of and derived quantities. has a linear dependence on distance and has a cubic dependence, although is independent. could be an underestimate if there are clouds which have not beamed masers towards us at any of the epochs used in the analysis, although a much higher value would produce an unrealistically high . For the same reason, although the typical values used for and and other assumptions about cloud behaviour are very simplified, these are unlikely to be severe overestimates. R11 used these estimates of and to find estimates of parameters such as maser brightness temperatures, beaming and optical depths consistent with existing maser models e.g. Elitzur et al. (1992). Altogether, errors of up to factors of a few are possible.
| Star | Epochs | |||||||||||
|---|---|---|---|---|---|---|---|---|---|---|---|---|
| (yr) | (m-3) | (yr) | (M⊙) | (M⊙ yr-1) | ||||||||
| VX Sgr | 94–99 | 4.73 | 107 | 89 | 139∗ | 3 | 0.2 | 0.0009 | 0.90 | |||
| S Per | 94–99 | 4.80 | 43 | 38 | 134∗ | 6 | 1.3 | 0.0095 | 0.60 | |||
| U Ori | 99–00–01 | 2.30 | 72 | 32 | 57 | 2 | 1.8 | 0.0095 | 0.31 | |||
| U Her | 00–01 | 0.94 | 88 | 29 | 62 | 2 | 1.8 | 0.0079 | 0.31 | |||
| IK Tau | 00–01 | 0.94 | 75 | 24 | 85 | 4 | 0.2 | 0.0010 | 0.92 | |||
| RT Vir | 96(6) | 0.186 | 55 | 11 | 142 | 6 | 0.4 | 0.0026 | 0.86 | |||
| W Hya | 99–00–01–02 | 3.16 | 55 | 14 | 45 | 3 | 0.2 | 0.0019 | 0.90 |
∗The actual number of clouds may be less since some RSG clouds are large enough to contain several features.
The inescapable conclusion is that the density of 22-GHz H2O maser clouds is at least an order of magnitude greater than the average wind density, and probably 50–100 times greater. % of the mass loss is concentrated in these clouds, with a filling factor %. Menut et al. (2007) modelled IR interferometry of dust emission from within 300 AU of IRC+10216 using 500 clumps, ten- to a hundred-fold overdense, of the same radius as the star, which is similar to the wind structure deduced for our targets.
6 Time evolution, flares and variability
We model the 3-D changes in maser distribution between epochs in Section 6.1. A number of individual maser features brighten or dim by large factors. One, in W Hya, is particularly clearly identified in successive epochs of both MERLIN and Pushchino data and the reason for its isolated flare is explained in Section 6.2. We investigate whether the imaging data showed any systematic dependence between flux density variations and location in the maser shell in Section 6.3, and look for possible causes of variability in Section 6.4.
6.1 Time evolution of maser distributions
The positions of masers (, ) are measured directly in the plane of the sky but their velocities () are measured in the perpendicular direction. We can calculate the full 3-D coordinates using trigonometry, if we assume spherically symmetric expansion away from the star, obeying . is defined in Equation 1 and and v are the magnitudes of the radial position and velocity vectors for a maser at any point in the shell, i.e. . Thus, (where ) and (where is the velocity component in the plane of the sky, in the direction of ). We use the acceleration along the -axis to derive an expression which can be solved for the position and velocity components not directly measured:
| (7) |
where is the line-of-sight velocity component at the inner maser shell edge at . By simple trigonometry, and , giving
| (8) |
Substituting , multiplying by and then squaring gives
| (9) |
which yields a quartic equation in
| (10) | |||||
where all the coefficients are composed of measured parameters. We solved this (using python numpy222http://numpy.scipy.org/) for and hence can calculate any other vector component such as . A similar process was performed by M03 for VX Sgr.
We calculated the fractional flux density per unit volume in segments of arc and in concentric, spherical sub-shells. In all cases the ranges shown are divided into 25 bins of equal widths in angle (as projected against the plane of the sky) or radius (deduced from 3-D modelling). Since the plots are normalised, the entire shell waxing or waning in response to stellar luminosity changes has no effect. Figs. 46 to 52 show the angular and radial distributions of flux as a percentage of the total flux at each epoch.
We used the total expansion velocity v to predict the radial position at the latest epoch, for each component observed at earlier epochs. The corresponding extrapolated radial flux distributions are shown by the faint dotted lines. There are minor discrepancies due to binning different samples into each subshell. No compensation has been made for the effects of changing temperature and density on maser efficiency.
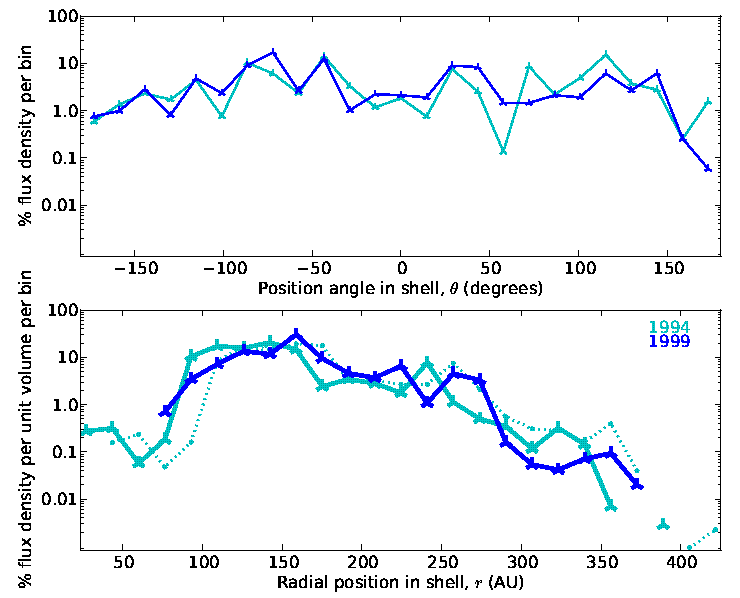
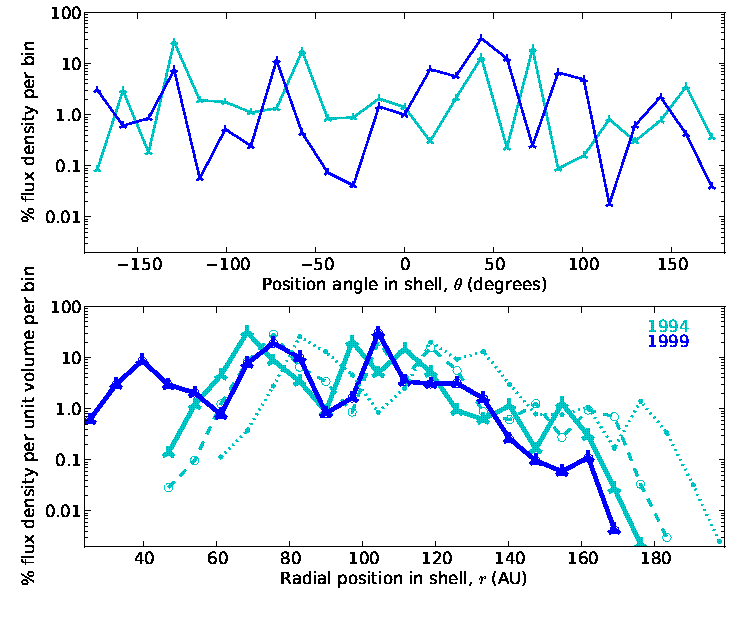
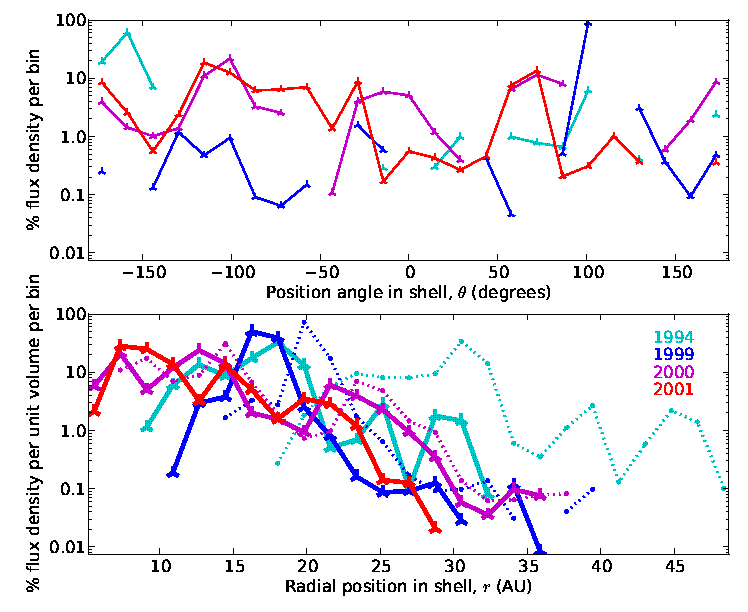
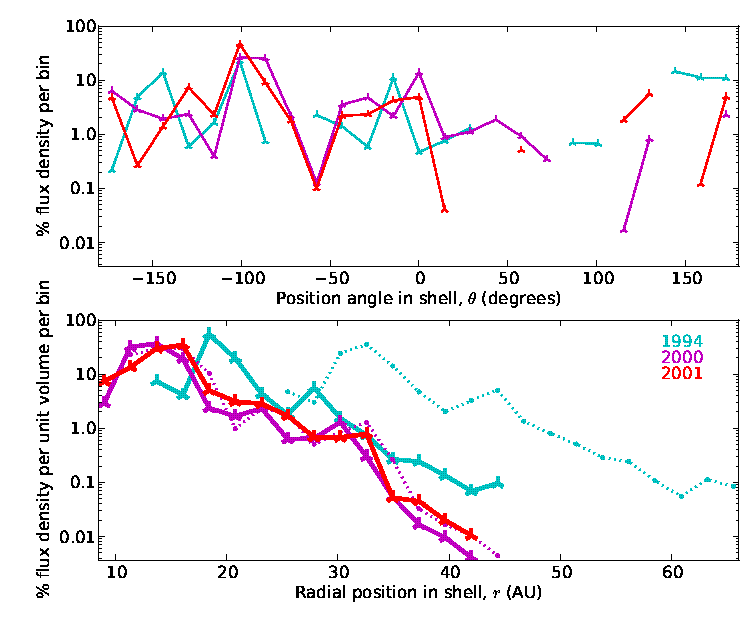
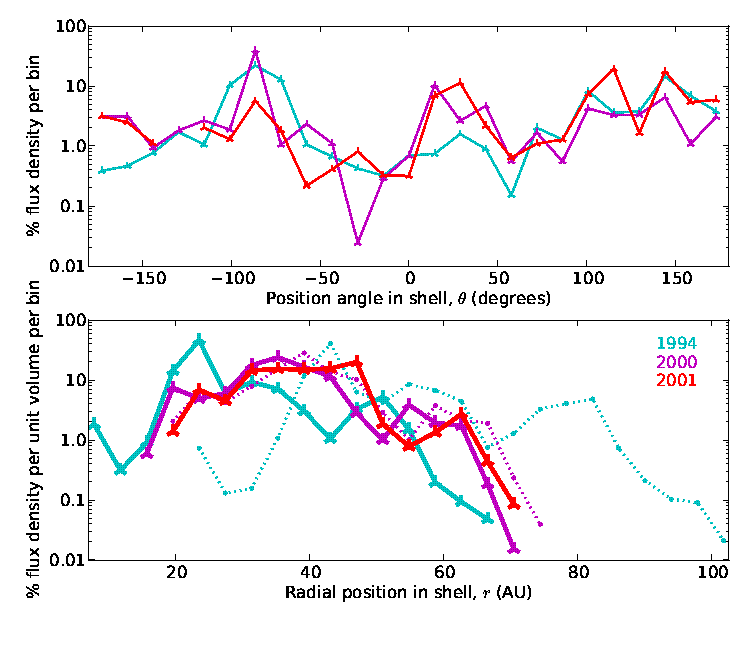
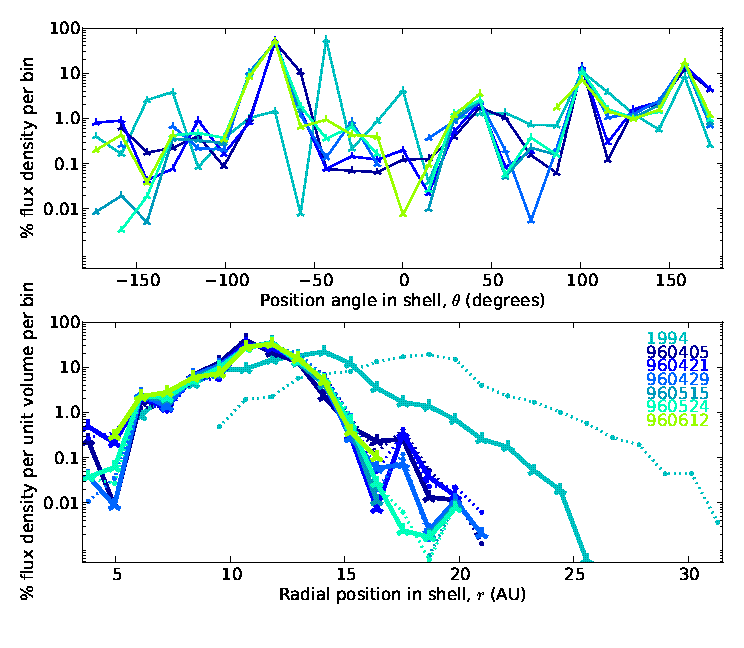
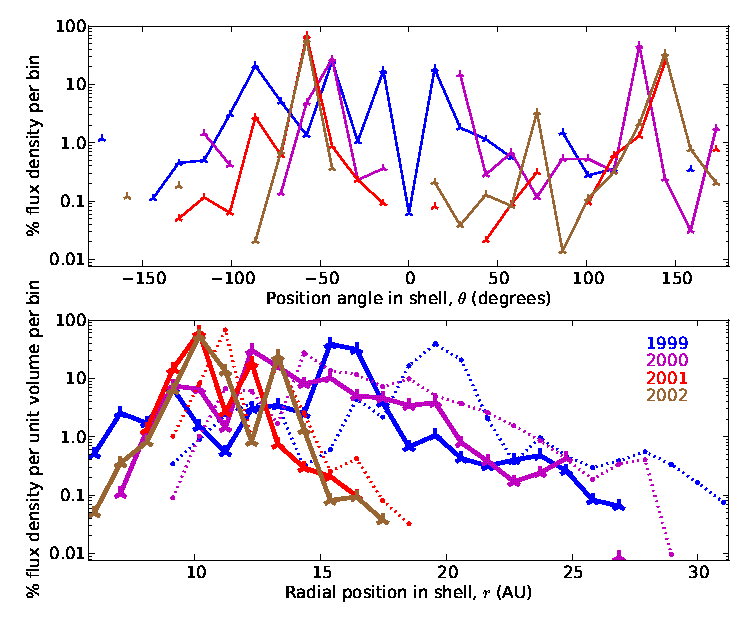
The radial profiles in Figs. 46 to 52 show that the brightest masers occur within the inner half of the shell, frequently peaking around the first quarter (as predicted by e.g. Cooke & Elitzur 1985, Yates et al. 1997). However, there are significant differences between the AGB observations, especially over time intervals of years. There are most similarities between epochs with the most matched features, as one would expect. The position angle profiles do not show any systematic shifts which would indicate rotation, nor any obvious preferred directions (note that is projected against the plane of the sky and does not provide a full 3-D model of angular distribution, such as was made for VX Sgr by M03).
VX Sgr shows fairly good agreement between the radial locations of the peaks seen in 1999 and the extrapolated 1994 profile. This is consistent with the overall similarities in morphology as well as individual feature matches described by M03. They found good agreement between the trigonometric () and proper motion expansion () velocities in the plane of the sky if the star is at kpc, within the uncertainties of the generally adopted value of 1.7 kpc. The emission at greater has faded, consistent with Cooke & Elitzur (1985).
When the two brightest peaks in the 1994 S Per radial profile are extrapolated, they appear to overtake the 1999 emission. It is possible that v has been overestimated for some maser features. The mean value of , the component of motion in the plane of the sky estimated trigonometrically, is 15.2 km s-1, compared with 4.9 km s-1 but Fig. 26 shows a large scatter due to the large uncertainties in the individual measurements at the large distance of S Per. It is also possible that the velocity field is axisymmetric, with slower expansion in the plane of the sky, where the brightest emission is located. The dashed line in Fig. 47 shows that if we extrapolate the 1994 data at , the two highest peaks coincide with the 1999 peaks, with a trough in between. R99 esimated the time when the material producing the masers observed in 1994 left the star, and compared this with AAVSO light curves, finding that the trough corresponded to several years when the optical period amplitude was only about 1.5 magnitudes instead of the more usual.
Among the AGB stars, 1996 RT Vir data peak shifts by the predicted amount (equivalent to a change of about one radial bin from the first to the last epoch) but the 1994 data are significantly different. The mean values of and are 10 and km/s-1, in reasonable agreement given the model uncertainties.
U Ori and W Hya show only limited similarities between epochs, consistent with the fewer matches and greater measurement uncertainties, respectively. IK Tau shows closer apparent similarities, including with 1994 data. However, the IK Tau velocity profiles (Figs. 38 and 39) show that, apart from relatively faint red-shifted emission, the peaks in 1994 were at very different velocities from later epochs.
The brightest U Her emission is located at a similar velocity at all epochs, within the thermal line width plus slight acceleration (Figs. 36 and 37). It is possible that the ring of emission seen in Fig. 8 corresponds to the fainter, outer ring in Fig. 9. The outer ring corresponds to the small peak or knee in the 2000–2001 emission at AU in Fig. 49, the location of the extrapolated 1994 peak (dotted line). If the 1994 peak was scaled down by a factor of about 20, consistent with maser emission fading at larger , this would produce the flux densities observed in 2000–2001.
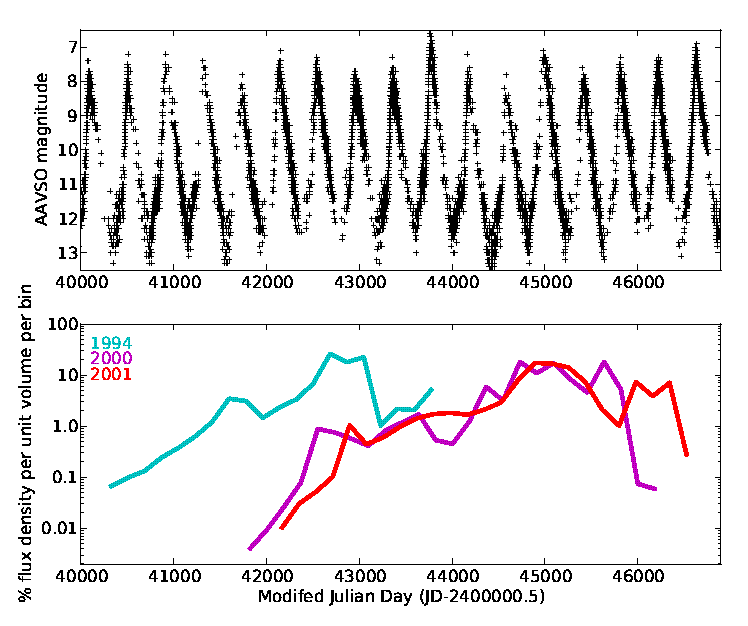
We estimated the date relative to the observation date at which each maser component at position , velocity v, left the star, based on Equation 3:
| (11) | |||||
We assume that the material reaches from the star travelling at average velocity and ignore the light travel time from U Her to Earth. Fig. 53 shows the flux density summed radially into 25 shells covering this time interval (converted to MJD), (similar to Fig. 49 but with the density profile reversed with respect to the abscissa direction), compared with the AAVSO light curve. The two bright shells of U Her maser emission correspond to MJD around 42800 and 45000, but there is nothing obviously unusual about the light curved around these times. The intervening maser dip coincides with a fairly bright U Her maximum but it is not exceptional; inspection of AAVSO data shows that it has exceeded mag 7 twenty times in the past century.
6.2 Cloud overlap causes local flare in W Hya
The 22-GHz peaks from W Hya are generally a few hundred Jy, but exceeded 1000 Jy on several occasions during Pushchino monitoring since 1982 (Rudnitskii et al. 1999). Most recorded emission is confined to the velocity range 36–44 km s-1 but the MERLIN data for 20000405 show a 100-Jy peak at 45 km s-1 (Fig. 42). This was not present in the Pushchino spectra just a few weeks before or after.
An even stronger flare is seen in Fig 43 at 40.4 km s-1, reaching nearly 1000 Jy in 20010227 and over 2800 Jy in 20011023, was detected by both Pushchino and MERLIN. Fig. 54 shows the MERLIN peak in this spectral region in 2000, 2001 and 2002 (located in the NW of the plots shown in Fig. 14). The peak is shown by circles and a fainter, nearby feature, with a distinct, Gaussian spectral profile, is shown by squares. The brighter peak is 7, 136 and 269 Jy and the fainter is 6, 7 and 2 Jy, at the three successive epochs. The relative velocities are , the fainter peak being about 1 km s-1 more redshifted at all epochs, although both show a small drift. Interestingly, the fainter feature is to the N in 2000 but to the S at later epochs, an apparent relative velocity in the plane of the sky of km s-1.
The MERLIN data were taken close to stellar minimum whilst the brightest Pushchino peak was seen close to stellar maximum but this cannot be the main reason for the flare since only one feature is affected. It is unlikely that a large-scale shock is involved, since in that case one would expect both adjacent features to be affected. The third possible mechanism for an isolated flare is two overlapping clouds. The brighter cloud is more blueshifted and therefore in the foreground, and could dramatically amplify the background cloud (Kartje et al. 1999). Fig. 54 shows that the brigher cloud has a proper motion consistent with outflow; the full extent of the background cloud may be obscured.
6.3 Variability of multi-epoch features
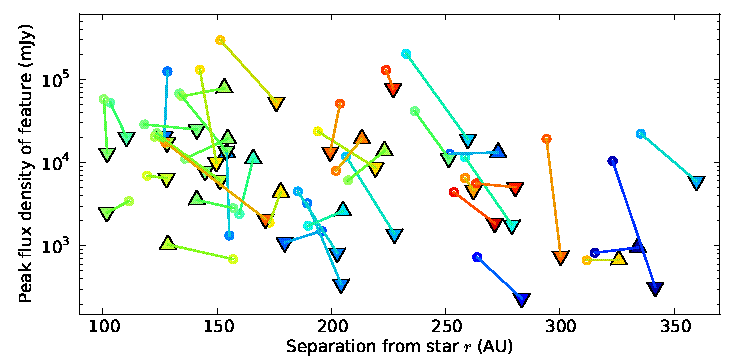
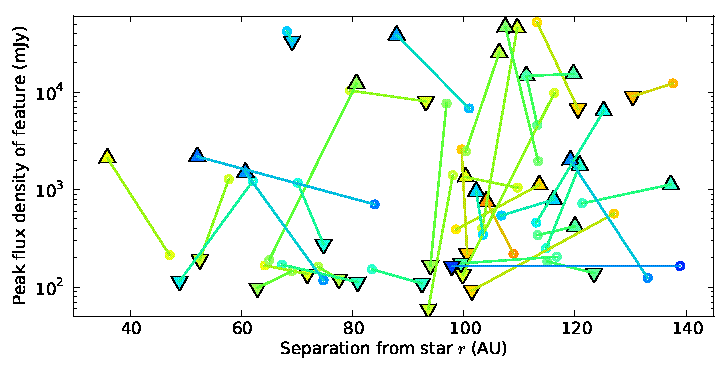
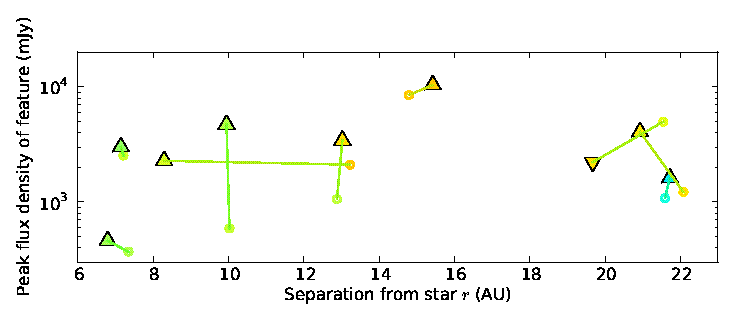
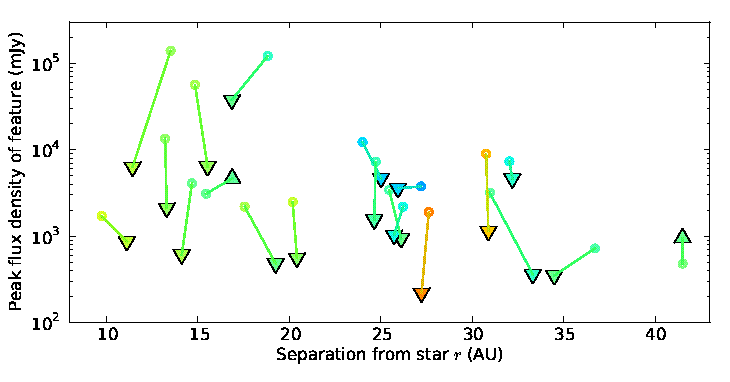
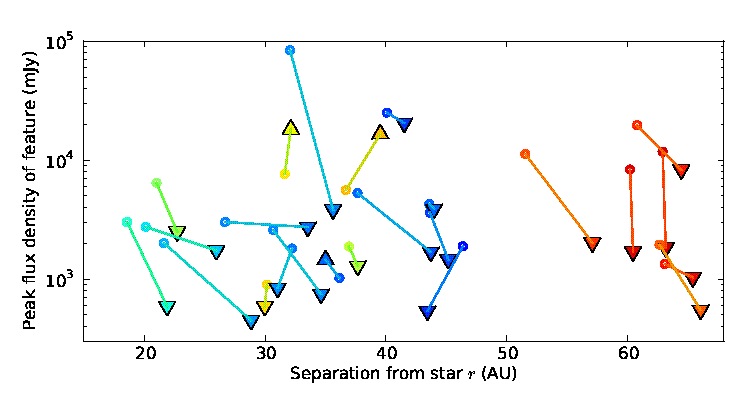
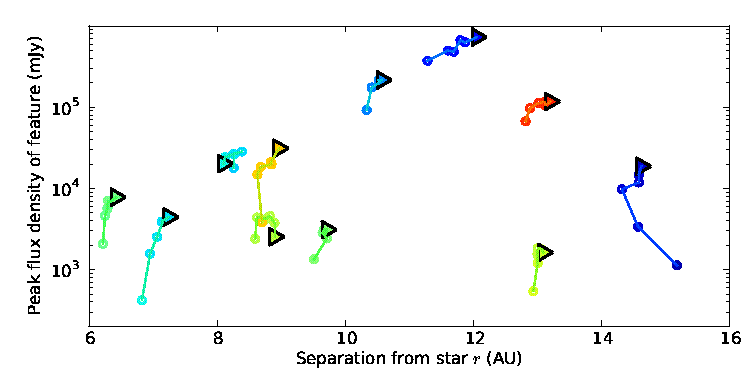
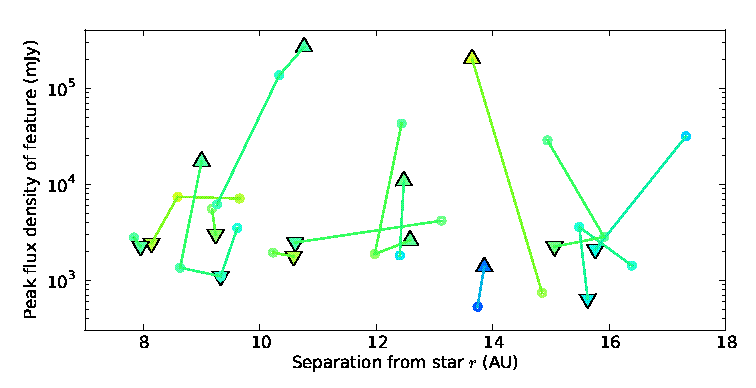
We looked for any systematic trends in the brightness evolution of maser features identified at multiple epochs. The total distance of each feature from the assumed stellar position was estimated as described in Section 6.1. The 3-D modelling is not only vulnerable to measurement errors but also to deviations from the assumptions of spherical symmetry and linear acceleration, but with only two epochs of data (in most cases) these effects cannot be separated. Figs. 55 to 61 show the change in flux density as a function of for matched features.
S Per and W Hya do not show a clear trend, although this may be obscured due to the larger position uncertainties owing to the greater distance and low elevation, respectively. There may be some spurious matches such as the blue-shifted S Per features with very large changes in , since we did not want to impose an a-priori 3D model but used the same position matching critera at all velocities. However, if spherical expansion dominates, the apparent large proper motions are unlikely for highly blue-shifted features. A possible sign of the effects of asymmetric expansion is described in Section 6.1.
Features throughout the maser shell behave similarly in the remaining sources. The majority of VX Sgr, U Her and IK Tau matched features get fainter, generally consistent with Figs. 32, 37 and 39. Most of the U Ori matched features get slightly brighter, consistent with Fig. 35. The tendency for to decrease in U Ori may be due to a large random component to its proper motions (Section 3.2).
RT Vir has the best sampled data. Fig. 60 shows that all 11 matched features increase in brightness relative to the first interferometry epoch of 1996. Nine of the features continue to increase, although a few level off or slightly decrease at the final epochs. The other two features reach maximum at intermediate epochs. Fig. 24 indicates the fractional increase. Figs. 40 and 41 show that the main features of the RT Vir spectrum dropped in flux density between the Pushchino observations in 19960319 and the MERLIN observations in 19960405. The brightness then increased steadily during the interferometric monitoring but dropped sharply again between the last MERLIN epoch in 19960612 and Pushchino observations in 19960619. Fig. 3 shows that the MERLIN observations were made during the decline of optical phase.
6.4 Possible causes of variability
In all objects, individual maser features can show idiosyncratic behaviour. Some of this can be attributed to local turbulence (Section 4.2). Extreme flares are confined to small spectral and spatial regions in our data, such as the W Hya event (Section 6.2). There are several possible types of more general behaviour. Masers switch on, brighten relatively rapidly and then decline slowly as the parent gas enters and eventually leaves the region where maser excitation is possible, over several decades, as predicted by Cooke & Elitzur (1985) and seen in Figs. 46 to 52.
There is no obvious correlation between flux density changes and radial position in the shell of any CSE studied. In those objects which do show systematic behaviour, the whole shell is affected, suggesting a response to stellar illumination (the light crossing time for an entire 22-GHz H2O shell is a couple of days or less). Figs. 1 to 3 show that there is no systematic relationship between maser brighness and the optical phase at the times of our observations. However, this is not surprising, since IR is expected to have more effect on 22-GHz masers. Smith et al. (2006) found lags of IR variability with respect to the optical light curves for Miras, where is the stellar period. There was no clear relationship for other sources such as SRbs.
Long-term, well sampled single dish data have shown some correlations between H2O maser variability and stellar periods. Shintani et al. (2008) monitored a large number of AGB and RSG, including all those in our sample, for yr using the VERA Iriki single dish. They fitted periods to the integrated 22-GHz emission and compared these with AAVSO data. Excluding fits marked ‘bad’, they deduced lags, as fractions of , for: U Ori ; U Her ; IK Tau ; W Hya . yr of Pushchino monitoring showed similar lags of 0.2–0.4 for U Ori (Rudnitskij et al. 2000) but W Hya produces semi-regular flares with lags of (Rudnitskii et al. 1999). No clear relationship was found for RT Vir. As for the RSG, Pashchenko & Rudnitskii (1999) and Lekht et al. (2005) found phase delays of and for VX Sgr and S Per, respectively. In summary, the clearest relationship is seen for Miras, and tends to align 22-GHz maser and IR periodicity. A relationship between stellar IR and maser brightness is not excluded for the SRbs and RSGs but would not be expected to follow the optical light curve. In fact, OH mainline masers around SRbs show a mixture of cyclic and erruptive behaviour with variability on timescales a short as a month (Etoka et al. 2001), so H2O masers closer to the star would be expected to be even more variable.
Changing stellar IR will affect the 22-GHz maser in at least 3 ways. Firstly, it is collisionally pumped, so the intensity is sensitive to heating (Cooke & Elitzur 1985). Secondly the pump cycle may be suppressed by a strong IR radiation field (Yates et al. 1997). These phenomena would affect the whole shell at close to light speed, i.e. within a few days. This could explain the behaviour of VX Sgr, U Ori, U Her, IK Tau and RT Vir, where the majority of matched maser features change flux density in concert between our observational epochs. Thirdly, the changing radiation pressure on dust will affect the velocity field and, for example, if acceleration decreases, radial beaming will be enhanced at the expense of tangential beaming (Engels et al. 1997), producing anti-correlated behaviour in the extremes versus the middle part of the spectrum. Our data are not well enough sampled over more than one stellar period, which would be required to test whether there is a correlation between the maser structure and the phase cycle.
Rudnitskii & Chuprikov (1990) suggested that the stellar pulsations shock the maser shell, producing brightness variations which would lag the optical phase by an interval equivalent to the shock crossing time from the stellar surface to the 22-GHz . Shintani et al. (2008) found evidence for lags of in many objects, taken to support a similar model. Reid & Menten (1997) showed that the pulsation velocity at or above the radio photosphere is unlikely to exceed 5 km s-1 in AGB stars. The maximum outflow velocities of SiO masers provide another indication of the velocity of possible impacts on the H2O maser shell. The SiO , and transitions in all our targets were surveyed by Kim et al. (2010). Although SiO masers are even more variable than H2O, results from other published observations are generally within a thermal linewidth. The SiO velocities are 9–10 km s-1 for VX Sgr and S Per, 6 km s-1 for U Ori, IK Tau and W Hya, 4 km s-1 for U Her and 5 km s-1 for RT Vir. This is comparable to and for all objects except U Ori and W Hya where it is comparable to .
A shock velocity of 5–10 km s-1 corresponds to a proper motion of AU yr-1 so a single shock would not affect an entire shell; even the smallest (the SRbs) are AU thick. It is possible that shocks affect the inner edge of the 22-GHz shell, and possibly penetrate deeper in objects where is smallest, such as U Ori and U Her, which show distinctive ‘matter bounded’ beaming properties for some masers (R11).
Höfner et al. (1995) developed a model in which C-rich dust production is intrinsically episodic. The formation of dust during one time interval leads to back-warming and suppression of further grain growth nearer the star, until radiation pressure has driven the initial dust shell away from the star. The models predict enhanced dust formation episodes at intervals similar to, or longer than the stellar period, but not all episodes are equally efficient. The dust:gas ratio, and thus acceleration, is therefore a function of distance from the star. Jeong et al. (2003) applied this model to an O-rich Mira. The amplitude of velocity variations depend on the extinction coefficients used, giving km s-1 at 15 . Our data could be used to test more precise models for our stars.
7 Relationship between maser cloud size and parent star
The average cloud radius for each epoch . Fig. 62 shows that this is an almost linear function of stellar radius . The error-weighted fit and dispersion are shown by the solid and dashed lines, where the relationship is
| (12) |
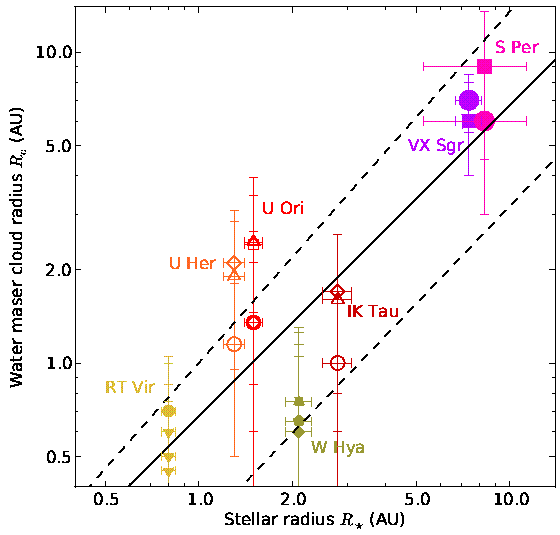
Note that W Hya cloud sizes are most likely to be underestimated, see Section 4.1.
The brightest part of the shell, where the highest number of clouds are detected, is close to the inner radius (see Section 6.1), so we use as the typical location in the shell where clouds have radius . If the clouds are formed at the surface of the star and expand uniformly, radially in the wind, the average cloud radius, extrapolated back to the surface of the star, is approximately (0.04–0.09) for the RSG, (0.05–0.12) for the Miras and (0.06–0.07) for the SRbs, i.e. for all stars.
This implies that the size of the clouds is determined by the size of the star. The 22-GHz H2O masers arise from clouds which are much denser than the average wind density (R99, B03, M03, Section 5.2) and which must survive for decades (even if individual masers do not). If these clouds were to be formed in the outflow after it had left the star, the cause would be some local wind phenomenon such as cooling due to dust formation. The length scale of this process would be determined by basic physical properties, implying that all clouds would form on the same size scales. This is not consistent with our data.
Other observations have revealed inhomogeneities and clumps closer to the star. Chiavassa et al. (2009) compared VLTI image reconstruction of VX Sgr at 1.6 m with three-dimensional simulations of surface convection. The best-fitting synthetic image possessed two convective cells of 4–5 milli-arcsec (comparable to R⋆ at this wavelength), with many 0.5–1 milli-arcsec granules, two being particularly prominent. A third spot appears at milli-arcsec separation from the centre, i.e. outside the photosphere. Although the fine details of the models are not uniquely constrained, the stellar surface clearly possesses structure on scales including the extrapolated birth size of the clouds, . Similar models for AGB stars have so far only been published for C-rich objects (Freytag & Höfner 2008), which also produce a few large convection cells. These have a piston effect comparable to traditional pulsations, and thus are potentially capable of enhancing mass loss on sub-surface scales. U Ori was imaged by Pluzhnik et al. (2009) using IOTA. The H2O band image at 1.78 m shows three bright clumps just outside the photospheric radius.333Pluzhnik et al. (2009) identify the (non-astrometric) IR clumps with H2O maser features imaged by Vlemmings et al. (2005) but even if the alignment were correct, it ignores projection effects; 22-GHz masers cannot exist so close to the star. Recent VLTI observations of four O-righ Miras (not in our sample) by Wittkowski et al. (2011) show deviations from symmetry in the H2O band indicating the presence of clumpiness on scales approaching 10% of the stellar size.
At much greater distances, around carbon stars, detatched CO shells have been observed and modelled by Bergman et al. (1993) and Olofsson et al. (1996). The clumps were not individually resolved, but the inhmogeneity was inferred from modelling larger-scale images. The objects studied have mass loss rates in the range M⊙ yr-1 concentrated in clumps of mass M⊙, similar to the values for our RSG (Table 5). The model of Bergman et al. (1993) is based on S Sct, using a clump radius AU at a distance AU from the star. Olofsson et al. (1996) model the cloud expansion as for steady outflow and limited cooling. Extrapolated back to AU gives AU, in agreement with the estimated H2O cloud radii around S Per and VX Sgr. Recent measurements of dust clumps in two detatched CO shells (Olofsson et al. 2010) yield similar sizes.
8 Summary and further work
We have resolved the detailed structure of the approximately spherical, thick H2O maser shells around two RSG (VX Sgr, S Per), three Miras (U Ori, U Her, IK Tau) and two SRb stars (RT Vir, W Hya), at multiple epochs. MERLIN detects all the 22-GHz maser emission (or possibly almost all, in the case of the closest object), at high enough resolution to measure the sizes and proper motions of individual clouds. We compare these images with single dish monitoring by the Pushchino radio telescope. Our results provide new insights into the development of the stellar wind in the region where the escape velocity is exceeded.
Survival
The H2O maser shells are 10–250 AU thick with crossing times from a few tens of years for AGB stars to nearly a century for RSG, but most individual maser features survive less than 1–2 yr and 1–2 decades, in the AGB stars and RSG, respectively. The disappearance and reappearance of individual masers identified by comparing imaging with single dish monitoring shows that this contradiction is resolved if the masers emanate from long-lived clouds. These undergo subsonic or mildly supersonic turbulence of a few km s-1, which causes detectable masers to be alternately boosted and supressed without destroying the clouds themselves.
Expansion proper motions
The proper motions of VX Sgr, S Per, U Her, IK Tau, RT Vir and most epochs of W Hya are unambiguously dominated by spheroidal expansion. There is a hint of rotation in the IK Tau maser proper motions. The small tangential component could be caused by random motions, which is also likely to be a significant factor affecting U Ori. The radial proper motion velocities (with respect to the assumed stellar position) are generally consistent with measurements, but the former have larger measurement errors and scatter, especially for the low declination source W Hya. Discrepancies between velocities derived from proper motion and measurements could also be due to asymmetry, as seen for VX Sgr (M03).
Acceleration
The 22-GHz masers lie outside the dust formation zone, where the wind is driven by radiation pressure on grains. The outflow velocity increases twofold or more across the maser shells of all sources. Moreover, comparison of different sources shows that the larger the inner and outer shell radii, the greater the expansion velocities at the outer rims, although the acceleration is more gradual. This is likely to be due to changes in the dust optical properties so a higher proportion of radiation is absorbed, and/or increasing optical depth so that the stellar photons are re-emitted making radiation pressure more efficient. This is consistent with Herschel and other results which show that terminal velocity is not reached until hundreds of .
Dense clumps
The wind at is concentrated in clumps which are 40–110 times denser than the wind average. They comprise between a fifth and almost all of the mass in the stellar wind in the maser shell, although accurate comparisons are difficult due to uncertainties in measuring the total mass loss rate. The volume filling factor is less than 1%. At least two to six clouds are formed per stellar period.
Flare due to cloud overlap
Single-dish monitoring of H2O masers reveals various forms of variability; in some instances a single spectral feature brightens by more than one order of magnitude for between a few weeks and a year or two. One such flare, in W Hya, was imaged at 3 epochs from 2000–2002, bracketing the 2500-Jy maximum captured by Pushchino. The images show that the variable cloud appears to pass in front of another. Two sets of components are spatially differentiated, at slightly different , both with distinct Gaussian spectral profiles. The flaring feature is initially to the S of the other cloud, both Jy. Two years later it has exceeded 400 Jy and moved to the NW of the fainter feature (in a direction consistent with outflow). This is a dramatic confirmation of the predictions of Kartje et al. (1999) for maser amplification by overlapping clouds.
Variability throughout the maser shell
The majority of matched features in each of VX Sgr, U Her and IK Tau decrease in flux density between the two imaging epochs regardless of their position in the maser shell; the majority of U Ori matched features increase. The intervals between epochs are of order 1–2 stellar periods, but there is no obvious connection between optical phase and brightening or dimming. Features throughout the RT Vir maser shell, imaged six times during the decline of optical brightness, rise and then slightly decline again in 22-GHz flux density. S Per and W Hya matched features show an apparently random mixture of brightening and dimming. The coordinated behaviour of features in 5 CSEs suggests that radiative effects play a major role in determining maser brightness, probably linked to the IR stellar phase (which lags the optical). The 22-GHz maser shells are 10–200 AU thick, so the light travel time is less than a few days but a shock at 5–10 km S-1 would take many years to cross even the thinnest shell. Nonetheless, the H2O masers may be affected by shocks close to the inner rim of the shell.
Cloud size depends on star size
The average radius of water maser clouds is 0.5–2 AU for the AGB stars and 6–9 AU for the RSG, showing a close dependence on . Assuming the clouds expand steadily in the outflow, this corresponds to birth radii . Previous CO and dust imaging have hinted at similar clumping scales and overdensity, but only MERLIN H2O maser observations have well-resolved all the emission from such clumps, close to the star. The dependence on stellar size suggests that stellar surface phenomena such as convection cells determine the scale of clumps.
Future work
We are in the process of analysing multi-epoch MERLIN and VLBI observations of OH masers which probe different conditions in these objects. A future paper will compare the H2O morphology with the distribution of OH masers to investigate asymmetry and inhomogeneity. There are very few estimates published for the sizes of SiO or OH maser clouds in our sources, but we will seek available data where the clouds are likely to be resolved but not resolved-out, to test whether the sizes do increase with distance from the star.
The advent of ALMA, e-MERLIN, upgraded VLBI and other interferometers will allow the unanswered questions to be tackled. The current baselines of ALMA, up to 1 km, will locate sub-mm H2O masers with respect to the 22 GHz transition and the dust formation zone, mapping changes in excitation conditions. Eventual longer baselines and full sensitivity will resolve both dust and molecular species in clumps, showing whether the 22-GHz clouds are indeed dustier and denser. ALMA will also resolve the stars, as will e-MERLIN and the EVLA at its highest frequencies. This will reveal any convective disurbances and timely VLBA SiO maser monitoring will show whether these lead directly to clumpy mass loss, and if the SiO clumps in turn become dusty water maser clouds, resolved by ALMA and e-MERLIN in multiple transitions. Simultaneous imaging of the star and masers at 22 GHz (only previously achieved for a very few objects e.g. Reid & Menten 1990; Reid & Menten 1997) will solve the current astrometric ambiguities.
Acknowledgements.
We recall the tremendous contributions of Jim Cohen (1948–2006) in the early years of this project. We warmly thank the referee, Dieter Engels, for a very thorough reading of the paper which led to great improvements in clarity, Indra Bains for many useful contributions and Robert Laing for trigonometric discussions. We acknowledge, with thanks, our use of data from the AAVSO (American Association of Variable Star Observers), the GCVS (General Catalogue of Variable Stars) and the Vizier and ADS services.References
- Asaki et al. (2010) Asaki, Y., Deguchi, S., Imai, H., et al. 2010, ApJ, 721, 267
- Assaf et al. (2011) Assaf, K. A., Diamond, P. J., Richards, A. M. S., & Gray, M. D. 2011, MNRAS, 415, 1083
- Bains et al. (2003) Bains, I., Cohen, R. J., Louridas, A., et al. 2003, MNRAS, 342, 8, (B03)
- Bergman et al. (1993) Bergman, P., Carlström, U., & Olofsson, H. 1993, A&A, 268, 685
- Bieging et al. (2000) Bieging, J. H., Shaked, S., & Gensheimer, P. D. 2000, ApJ, 543, 897
- Bowers et al. (1993) Bowers, P. F., Claussen, M. J., & Johnston, K. J. 1993, AJ, 105, 284
- Bowers & Johnston (1988) Bowers, P. F. & Johnston, K. J. 1988, ApJ, 330, 339
- Bowers & Johnston (1994) Bowers, P. F. & Johnston, K. J. 1994, ApJS, 92, 189
- Browne et al. (1998) Browne, I. W. A., Wilkinson, P. N., Patnaik, A. R., & Wrobel, J. M. 1998, MNRAS, 293, 257
- Carlsberg Meridian Catalog 14 (2006) Carlsberg Meridian Catalog 14 . 2006, Copenhagen University Obs., IoA, Cambridge, UK and Real Instituto y Observatorio de La Armada en San Fernando, 1304, 0
- Chapman & Cohen (1986) Chapman, J. M. & Cohen, R. J. 1986, MNRAS, 220, 513
- Chapman et al. (1991) Chapman, J. S., Cohen, R. J., & Saikia, D. J. 1991, MNRAS, 249, 227
- Chapman et al. (1994) Chapman, J. S., Sivagnanam, P., Cohen, R. J., & LeSqueren, A. M. 1994, MNRAS, 268, 475
- Chen et al. (2007) Chen, X., Shen, Z.-Q., & Xu, Y. 2007, CJAA, 7, 531
- Chiavassa et al. (2009) Chiavassa, A., Plez, B., Josselin, E., & Freytag, B. 2009, A&A, 506, 1351
- Colomer et al. (2000) Colomer, F., Reid, M. J., Menten, K. M., & Bujarrabal, V. 2000, A&A, 355, 979
- Condon (1997) Condon, J. J. 1997, PASP, 109, 166
- Condon et al. (1998) Condon, J. J., Cotton, W. D., Greisen, E. W., et al. 1998, AJ, 115, 1693
- Cooke & Elitzur (1985) Cooke, B. & Elitzur, M. 1985, ApJ, 295, 175
- Decin et al. (2010) Decin, L., Justtanont, K., De Beck, E., et al. 2010, A&A, 521, L4
- Diamond et al. (1987) Diamond, P. J., Johnston, K. J., Chapman, J. M., et al. 1987, A&A, 174, 95
- Ducourant et al. (2006) Ducourant, C., Le Campion, J. F., Rapaport, M., et al. 2006, A&A, 448, 1235
- Elitzur et al. (1992) Elitzur, M., Hollenbach, D. J., & McKee, C. F. 1992, ApJ, 394, 221, (EHM92)
- Engels et al. (1997) Engels, D., Winnberg, A., Walmsley, C. M., & Brand, J. 1997, A&A, 322, 291
- Esipov et al. (1999) Esipov, V. F., Pashchenko, M. I., Rudnitskii, G. M., & Fomin, S. V. 1999, Astronomy Letters, 25, 672
- Etoka et al. (2001) Etoka, S., Blaskiewicz, L., Szymczak, M., & Le Squeren, A. M. 2001, A&A, 378, 522
- Freytag & Höfner (2008) Freytag, B. & Höfner, S. 2008, A&A, 483, 571
- Greisen (1994) Greisen, E., ed. 1994, AIPS Cookbook (NRAO, Charlottesville, VA 22903-2475, USA)
- Habing (1996) Habing, H. J. 1996, A&A Rev., 7, 97
- Höfner et al. (1995) Höfner, S., Feuchtinger, M. U., & Dorfi, E. A. 1995, A&A, 297, 815
- Imai et al. (2003) Imai, H., Shibata, K. M., Marvel, K. B., et al. 2003, ApJ, 590, 460
- Ivezić & Elitzur (2010) Ivezić, Z. & Elitzur, M. 2010, MNRAS, 404, 1415
- Jeong et al. (2003) Jeong, K. S., Winters, J. M., Le Bertre, T., & Sedlmayr, E. 2003, A&A, 407, 191
- Kartje et al. (1999) Kartje, J. F., Königl, A., & Elitzur, M. 1999, ApJ, 513, 180
- Kerschbaum & Olofsson (1999) Kerschbaum, F. & Olofsson, H. 1999, A&AS, 138, 299
- Kim et al. (2010) Kim, J., Cho, S.-H., Oh, C. S., & Byun, D.-Y. 2010, ApJS, 188, 209
- Kirrane (1987) Kirrane, T.-M. 1987, PhD thesis, University of Manchester
- Knapp et al. (1998) Knapp, G. R., Young, K., Lee, E., & Jorissen, A. 1998, ApJS, 117, 209
- Lane et al. (1987) Lane, A. P., Johnston, K. J., Bowers, P. F., Spencer, J. H., & Diamond, P. J. 1987, ApJ, 323, 756
- Lekht et al. (1999) Lekht, E. E., Mendoza-Torres, J. E., Pashchenko, M. I., & Berulis, I. I. 1999, A&A, 343, 241
- Lekht et al. (2005) Lekht, E. E., Rudnitskij, G. M., Mendoza-Torres, J. E., & Tolmachev, A. M. 2005, A&A, 437, 127
- Levesque et al. (2005) Levesque, E. M., Massey, P., Olsen, K. A. G., et al. 2005, ApJ, 628, 973
- Marvel et al. (1998) Marvel, K. B., Diamond, P. J., & Kemball, A. J. 1998, in ASP Conference Series, Vol. 154, Cool Stars, Stellar Systems, and the Sun, ed. R. A. Donahue & J. A. Bookbinder, 1621
- Matsumoto et al. (2008) Matsumoto, N., Omodaka, T., Imai, H., et al. 2008, PASJ, 60, 1039
- Mayne & Naylor (2008) Mayne, N. J. & Naylor, T. 2008, MNRAS, 386, 261
- Mendoza-Torres et al. (1997) Mendoza-Torres, J. E., Lekht, E. E., Pashchenko, M. I., & Berulis, I. I. 1997, A&AS, 126, 257
- Menut et al. (2007) Menut, J.-L., Gendron, E., Schartmann, M., et al. 2007, MNRAS, 376, L6
- Monnier et al. (2004) Monnier, J. D., Millan-Gabet, R., Tuthill, P. G., et al. 2004, ApJ, 605, 436
- Murakawa et al. (2003) Murakawa, K., Yates, J. A., Richards, A. M. S., & Cohen, R. J. 2003, MNRAS, 344, 1, (M03)
- Neufeld et al. (1996) Neufeld, D. A., Chen, W., Melnick, G. J., et al. 1996, A&A, 315, L237
- Nyman et al. (1986) Nyman, L.-A., Johansson, L. E. B., & Booth, R. S. 1986, A&A, 160, 352
- Olofsson et al. (1996) Olofsson, H., Bergmann, P., Eriksson, K., & Gustafsson, B. 1996, A&A, 311, 587
- Olofsson et al. (1998) Olofsson, H., Lindqvist, M., Nyman, L.-A., & Winnberg, A. 1998, A&A, 329, 1059
- Olofsson et al. (2010) Olofsson, H., Maercker, M., Eriksson, K., Gustafsson, B., & Schöier, F. 2010, A&A, 515, A27
- Pashchenko & Rudnitskii (1999) Pashchenko, M. I. & Rudnitskii, G. M. 1999, Astronomy Reports, 43, 311
- Pashchenko & Rudnitskii (2004) Pashchenko, M. I. & Rudnitskii, G. M. 2004, Astronomy Reports, 48, 380
- Petrov et al. (2011) Petrov, L., Kovalev, Y. Y., Fomalont, E. B., & Gordon, D. 2011, AJ, 142, 35
- Pluzhnik et al. (2009) Pluzhnik, E. A., Ragland, S., LeCoroller, H., et al. 2009, ApJ, 700, 114
- Ragland et al. (2006) Ragland, S., Traub, W. A., Berger, J.-P., et al. 2006, ApJ, 652, 650
- Reid & Menten (1990) Reid, M. J. & Menten, K. M. 1990, ApJ, 360, L51
- Reid & Menten (1997) Reid, M. J. & Menten, K. M. 1997, ApJ, 476, 327
- Richards (1997) Richards, A. M. S. 1997, PhD thesis, University of Manchester
- Richards et al. (2011) Richards, A. M. S., Elitzur, M., & Yates, J. A. 2011, A&A, 525, A56, (R11)
- Richards & Yates (1998) Richards, A. M. S. & Yates, J. A. 1998, Ir. AJ, 25, 7
- Richards et al. (1996) Richards, A. M. S., Yates, J. A., & Cohen, R. J. 1996, MNRAS, 282, 665
- Richards et al. (1998) Richards, A. M. S., Yates, J. A., & Cohen, R. J. 1998, MNRAS, 299, 319
- Richards et al. (1999) Richards, A. M. S., Yates, J. A., & Cohen, R. J. 1999, MNRAS, 306, 954, (R99)
- Rudnitskii & Chuprikov (1990) Rudnitskii, G. M. & Chuprikov, A. A. 1990, Soviet Astronomy, 34, 147
- Rudnitskii et al. (1999) Rudnitskii, G. M., Lekht, E. E., & Berulis, I. I. 1999, Astronomy Letters, 25, 398
- Rudnitskij et al. (2000) Rudnitskij, G. M., Mendoza-Torres, J. E., Pashchenko, M. I., & Berulis, I. I. 2000, A&AS, 146, 385
- Samus et al. (2011) Samus, N. N., Durlevich, O. V., & et al. 2011, VizieR Online Data Catalog, 1, 2025
- Shintani et al. (2008) Shintani, M., Imai, H., Ando, K., et al. 2008, PASJ, 60, 1077
- Smith et al. (2006) Smith, B. J., Price, S. D., & Moffett, A. J. 2006, AJ, 131, 612
- Titov (2004) Titov, O. A. 2004, Astronomy Reports, 48, 941
- van Leeuwen (2007) van Leeuwen, F. 2007, A&A, 474, 653
- van Loon et al. (2005) van Loon, J. T., Cioni, M.-R. L., Zijlstra, A. A., & Loup, C. 2005, A&A, 438, 273
- Verhoelst et al. (2009) Verhoelst, T., van der Zypen, N., Hony, S., et al. 2009, A&A, 498, 127
- Vlemmings et al. (2001) Vlemmings, W., Diamond, P. J., & van Langevelde, H. J. 2001, A&A, 375, L1
- Vlemmings et al. (2002) Vlemmings, W. H. T., Diamond, P. J., & van Langevelde, H. J. 2002, A&A, 394, 589
- Vlemmings & van Langevelde (2007) Vlemmings, W. H. T. & van Langevelde, H. J. 2007, A&A, 472, 547
- Vlemmings et al. (2005) Vlemmings, W. H. T., van Langevelde, H. J., & Diamond, P. J. 2005, A&A, 434, 1029
- Vlemmings et al. (2003) Vlemmings, W. H. T., van Langevelde, H. J., Diamond, P. J., Habing, H. J., & Schilizzi, R. T. 2003, A&A, 407, 213
- Winnberg et al. (2011) Winnberg, A., Brand, J., & Engels, D. 2011, in ASP Conference Series, Vol. 445, Why Galaxies Care about AGB Stars II, ed. F. Kerschbaum, T. Lebzelter, & R. F. Wing, 375
- Winnberg et al. (2008) Winnberg, A., Engels, D., Brand, J., Baldacci, L., & Walmsley, C. M. 2008, A&A, 482, 831
- Wittkowski et al. (2011) Wittkowski, M., Boboltz, D. A., Ireland, M., et al. 2011, A&A, 532, L7
- Wittkowski et al. (2007) Wittkowski, M., Boboltz, D. A., Ohnaka, K., Driebe, T., & Scholz, M. 2007, A&A, 470, 191
- Woitke (2006) Woitke, P. 2006, A&A, 460, L9
- Yates & Cohen (1994) Yates, J. A. & Cohen, R. J. 1994, MNRAS, 270, 958
- Yates et al. (1997) Yates, J. A., Field, D., & Gray, M. D. 1997, MNRAS, 285, 383
- Zacharias et al. (2005) Zacharias, N., Monet, D. G., Levine, S. E., et al. 2005, VizieR Online Data: NOMAD Catalog, 1297
- Zhao-Geisler et al. (2011) Zhao-Geisler, R., Quirrenbach, A., Köhler, R., Lopez, B., & Leinert, C. 2011, A&A, 530, A120
- Zubko & Elitzur (2000) Zubko, V. & Elitzur, M. 2000, ApJ, 544, L137
Appendix A Contour plots of H2O maser emission
These plots show channel-averaged emission (see Section 2 for the original channel widths used). The restoring beams are shown in the first or last panel; in most cases these are slightly larger than the beams used in the full-resolution images for analysis (Table 2). The lowest contour is at the average for the cube but bright channels have been blanked where they are dynamic-range limited. Plots for VX Sgr were published by M03.
The image cubes for these plots were made by averaging 5 to 10 channels ( km s-1) and thus, due to frequency dilution, the peaks are often lower than those measured at full resolution. The same contour levels were used for all epochs of each source, at , to aid comparison. Negative contours are not shown to avoid crowding the plots; these generally do not exceed the first positive but blanking has been applied to dynamic-range limited channels where indicated (identified by broken contours).
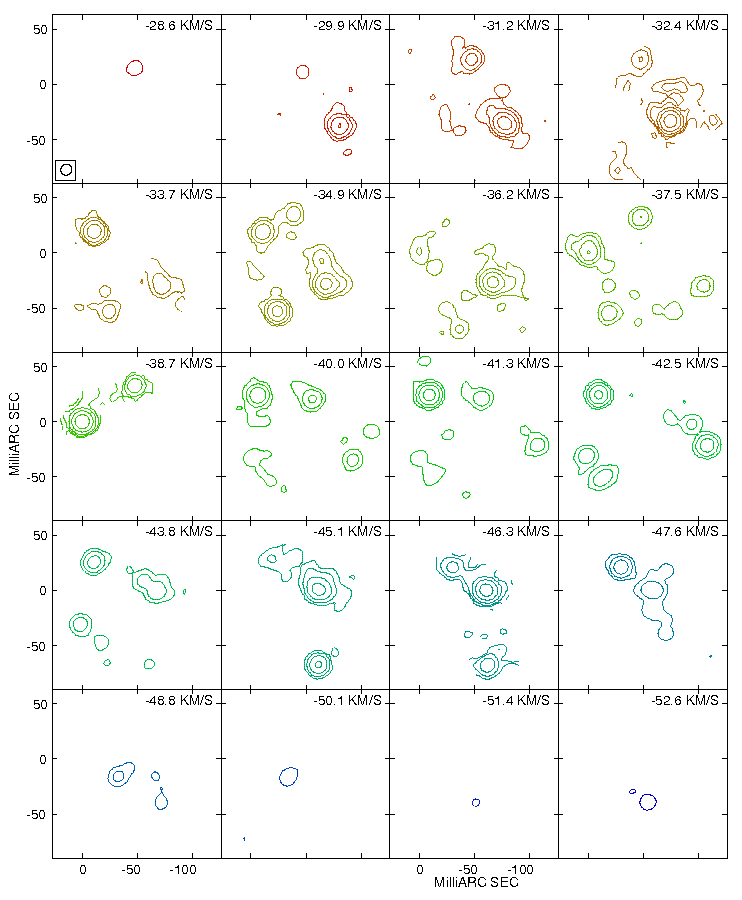
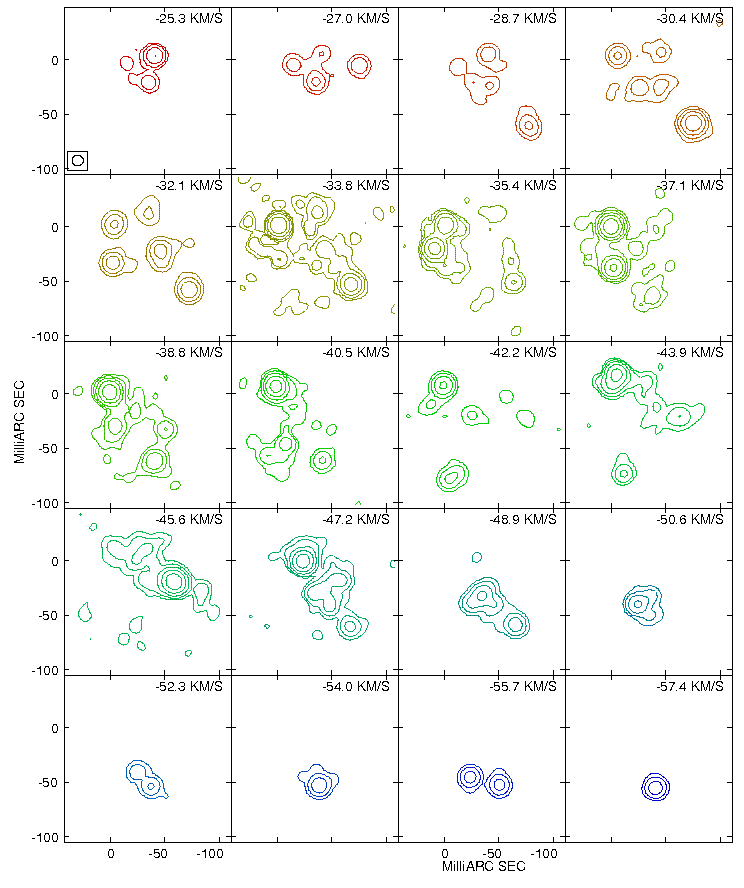
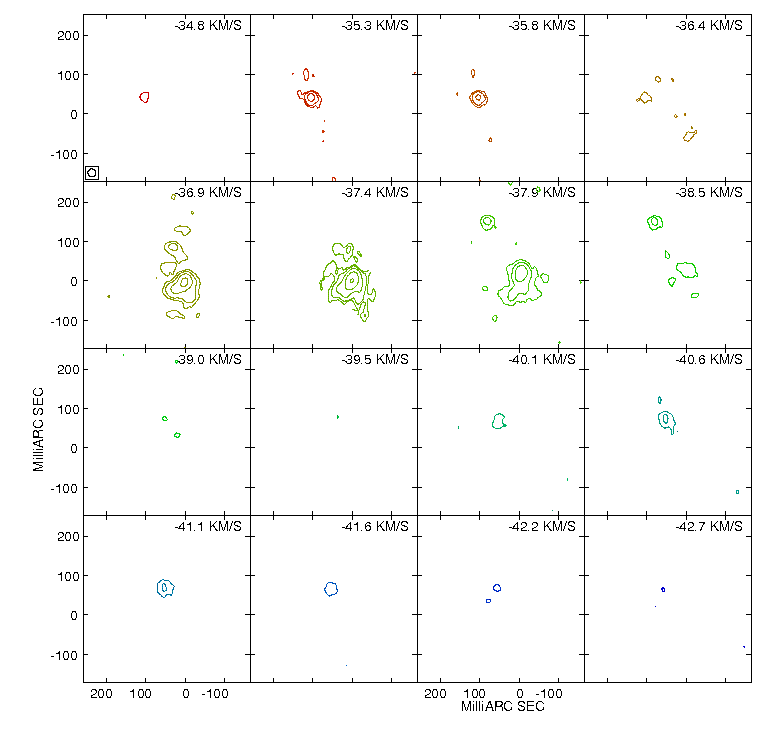
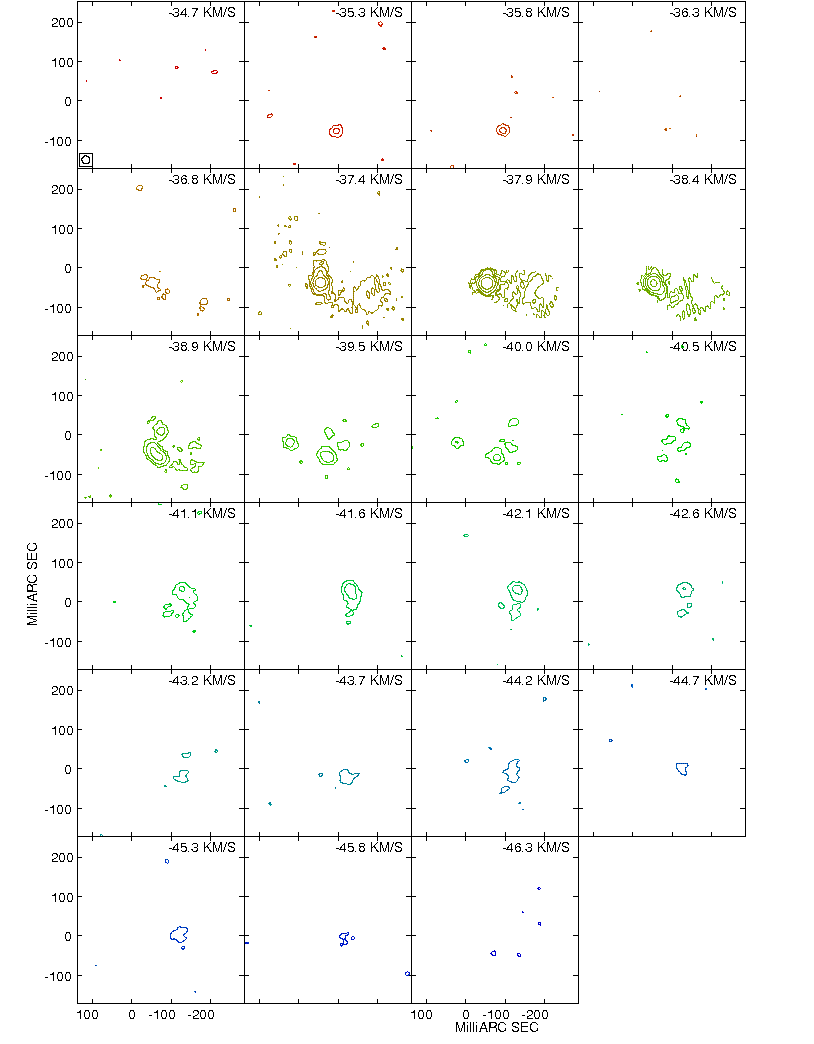
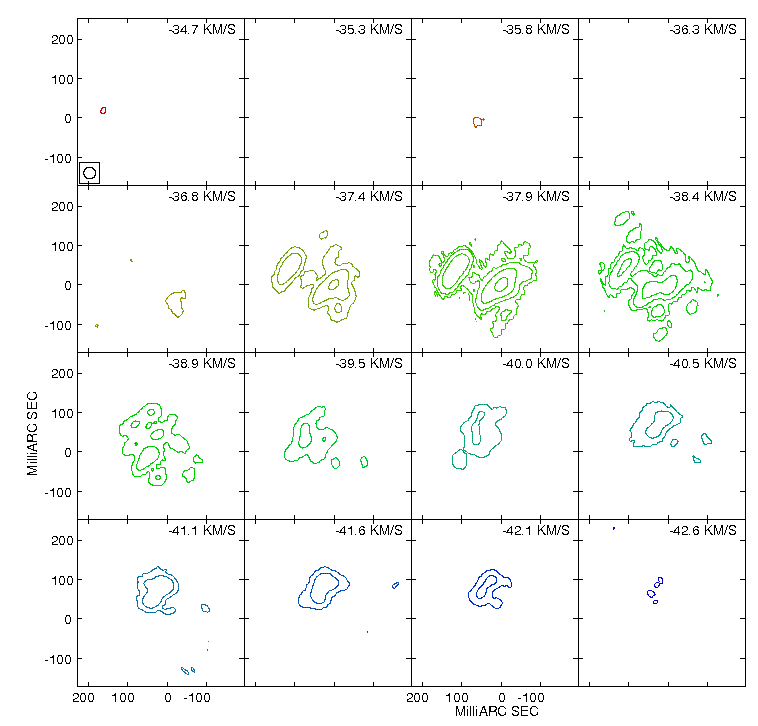
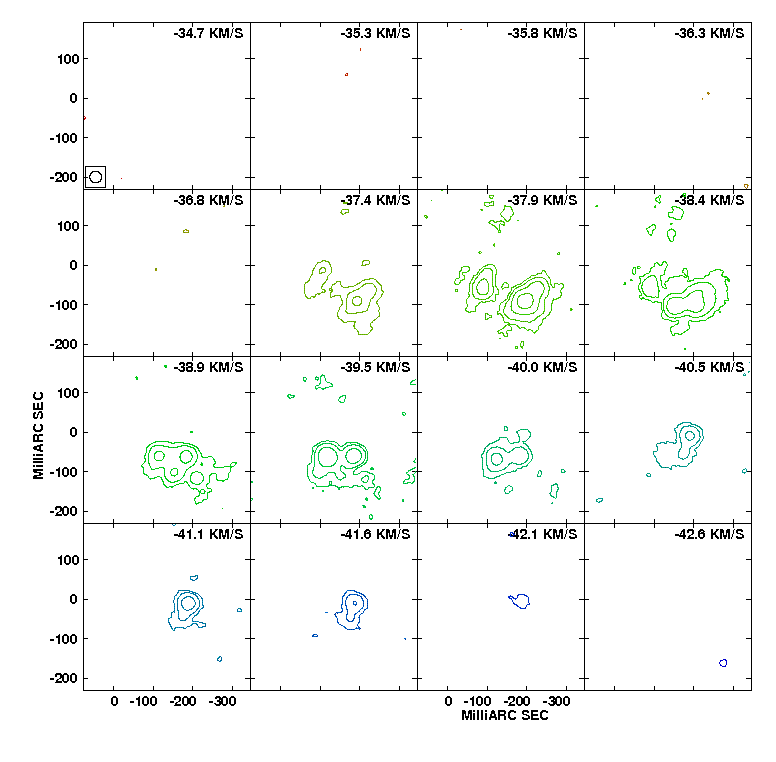
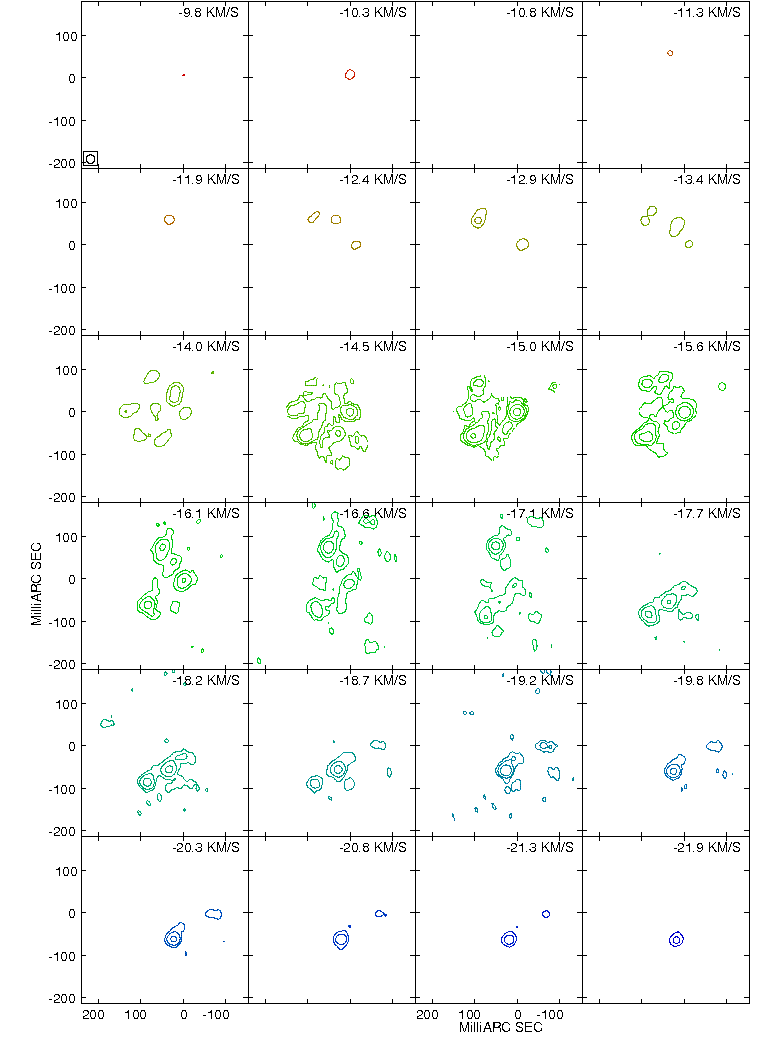
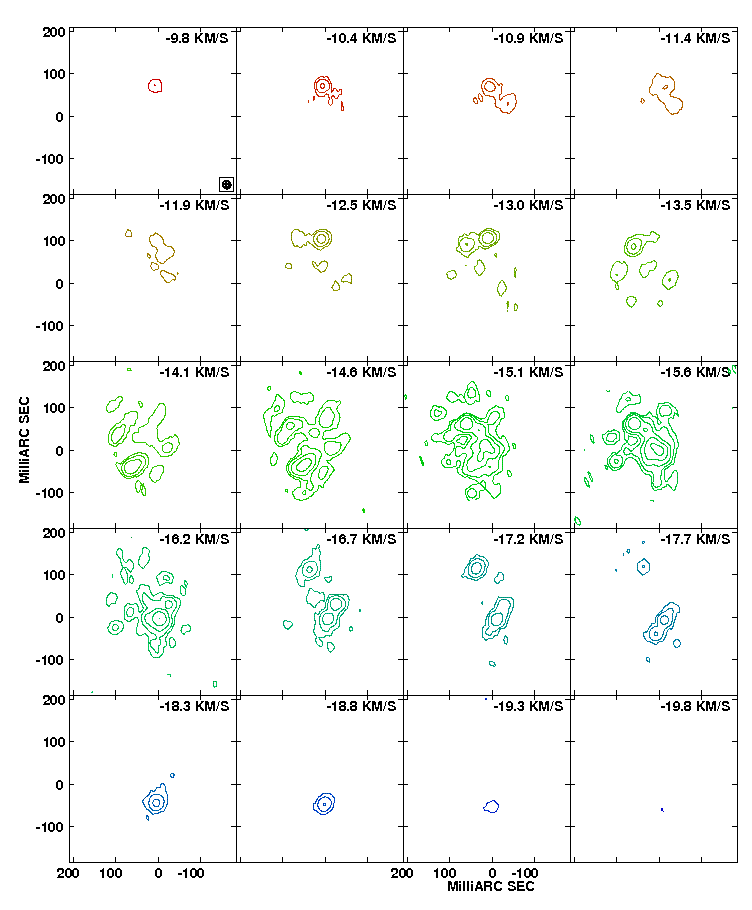
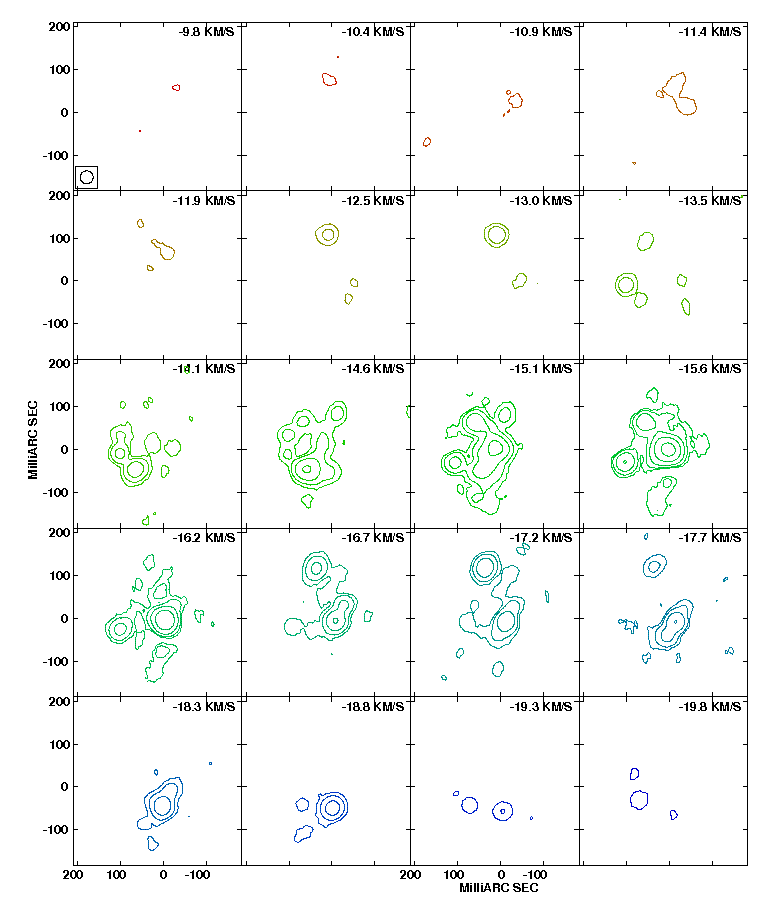
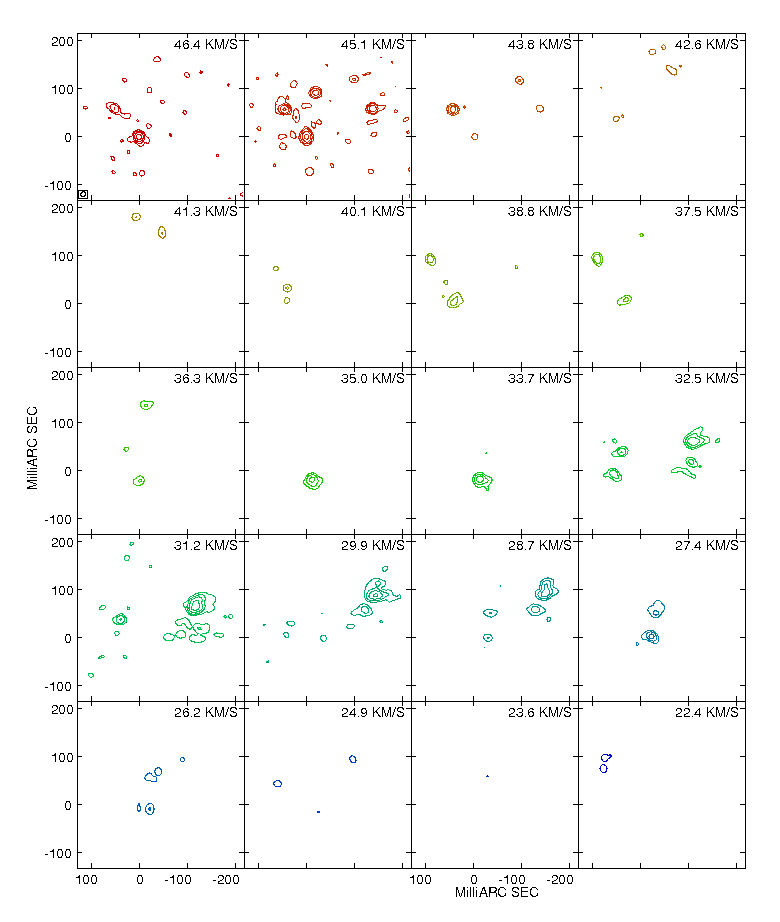
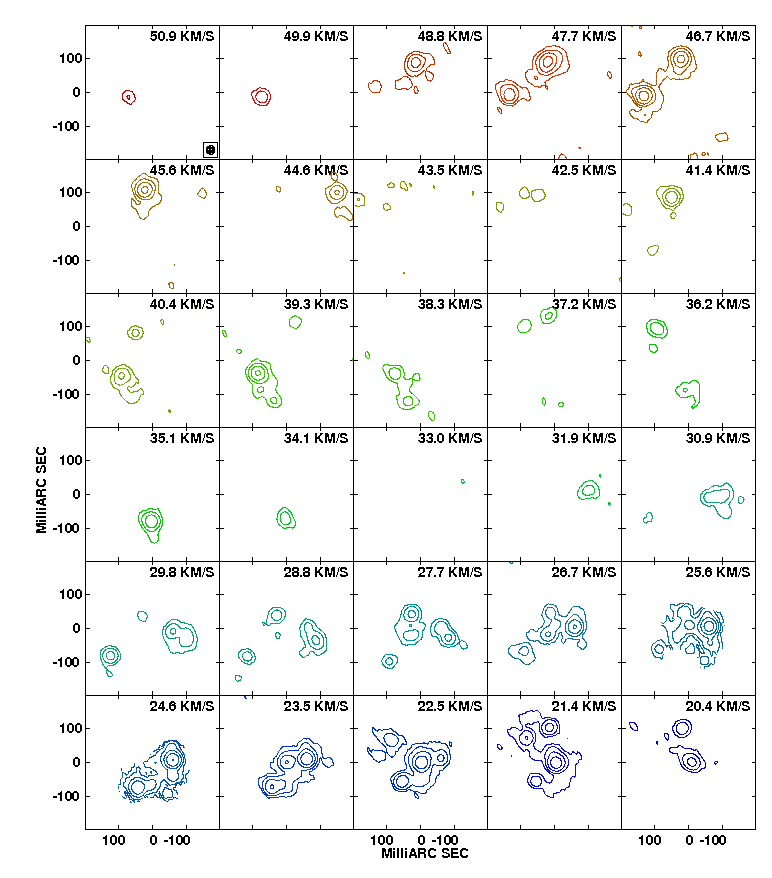
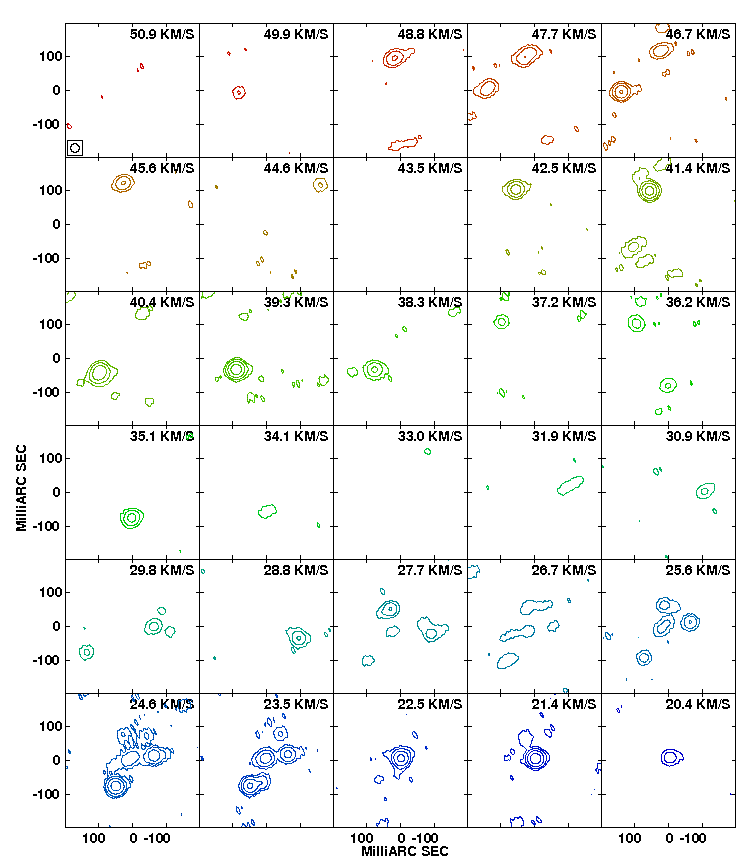
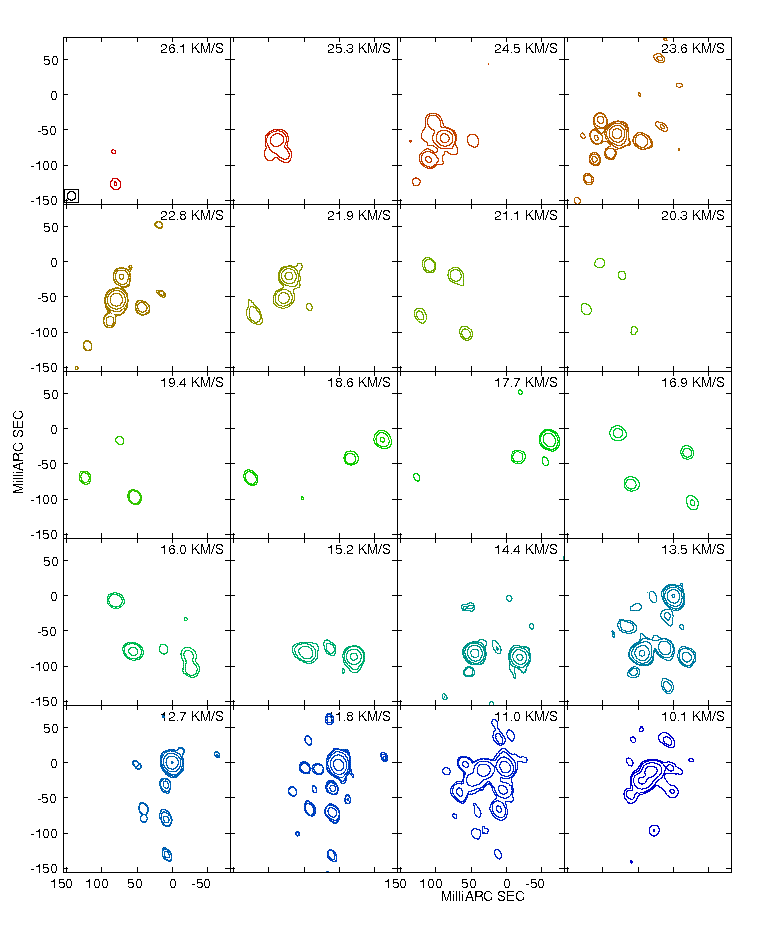
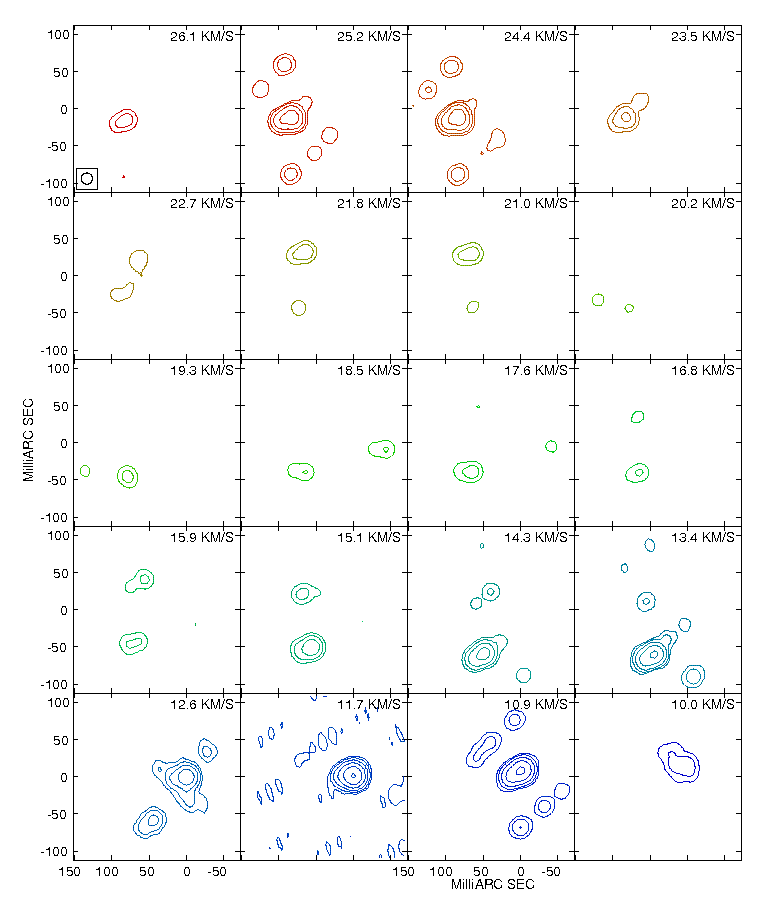
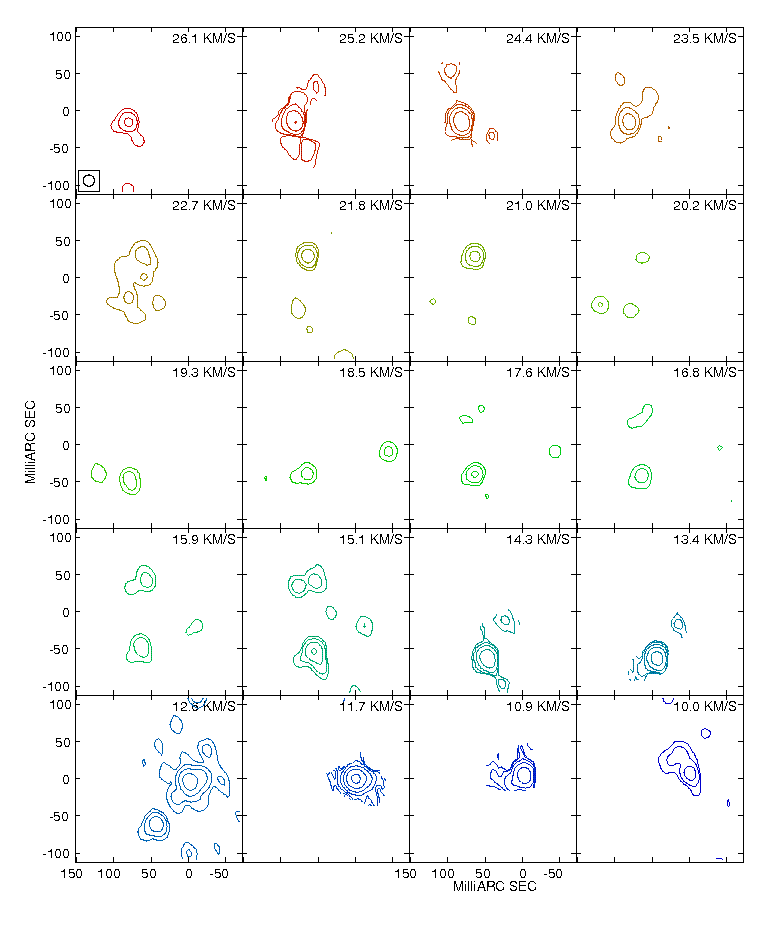
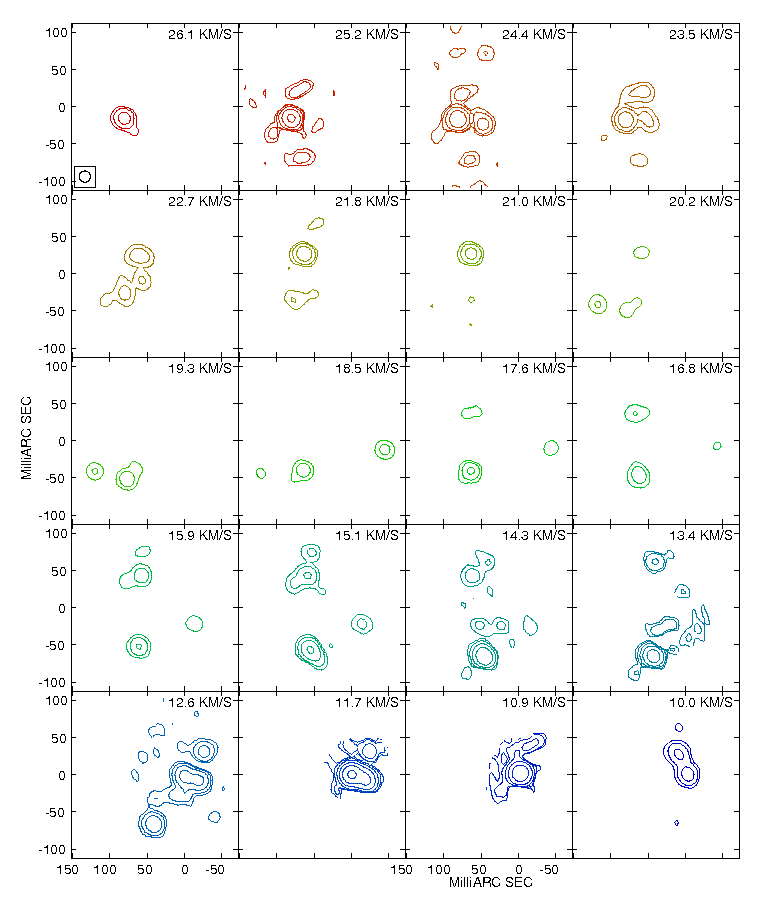
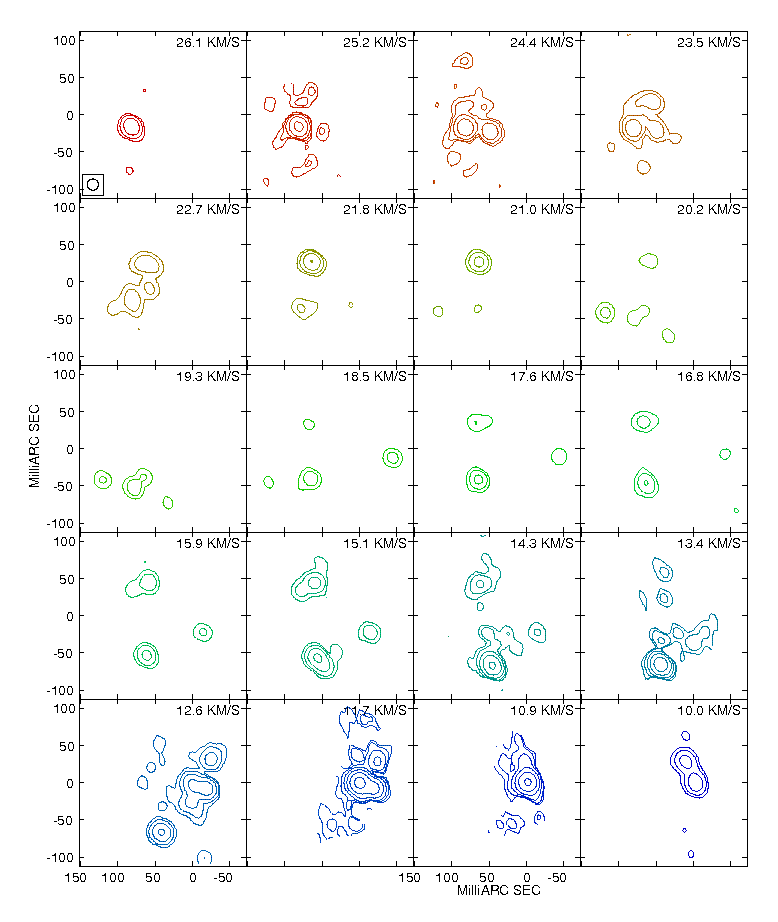
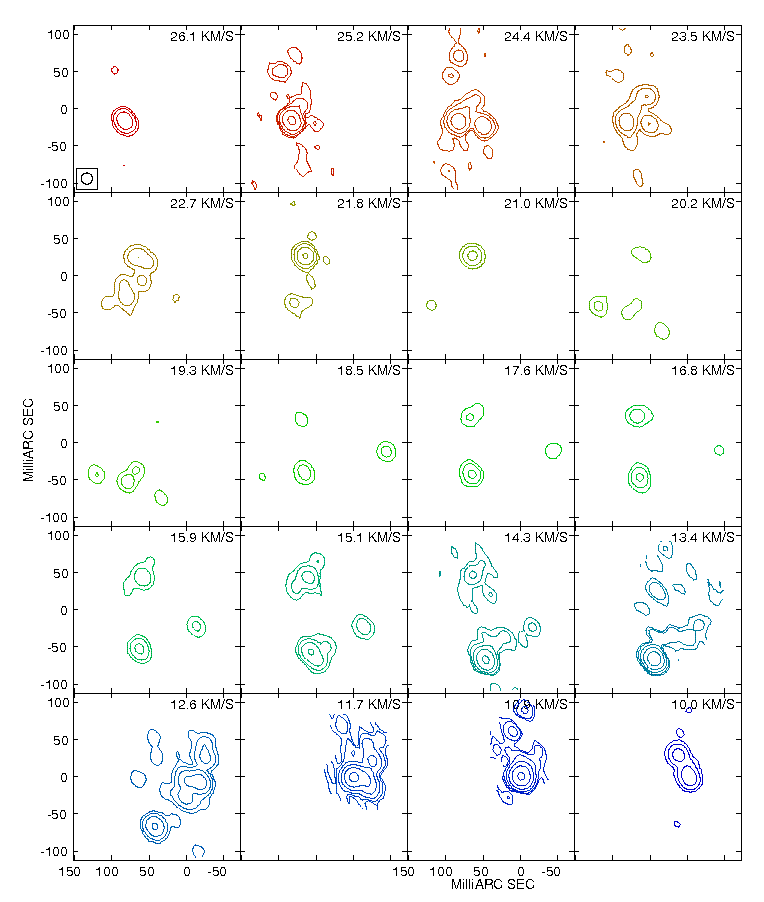
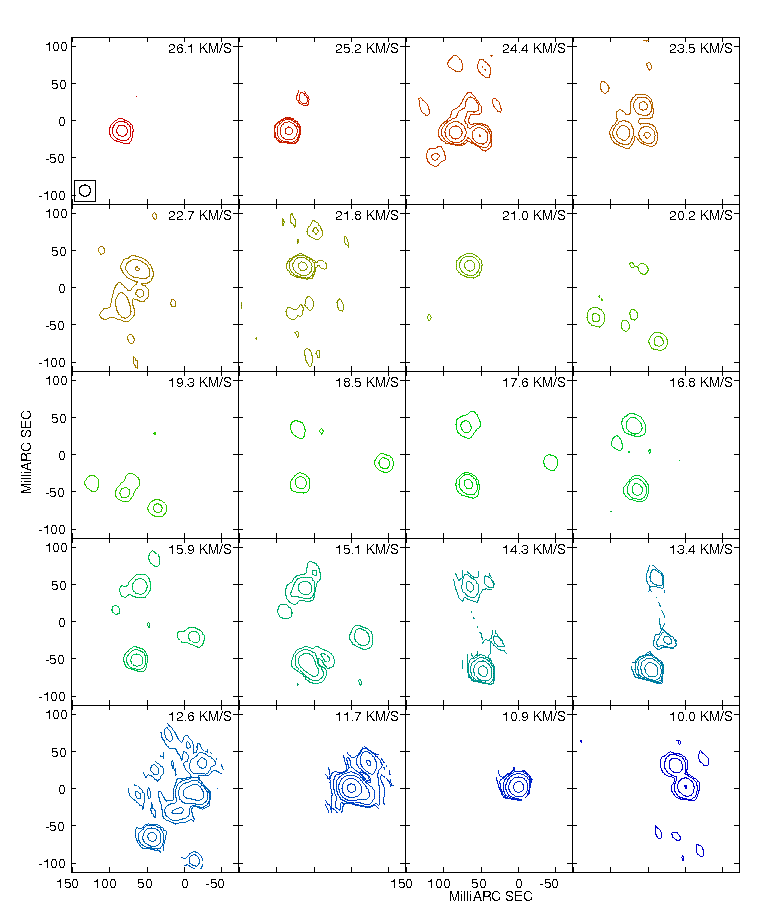
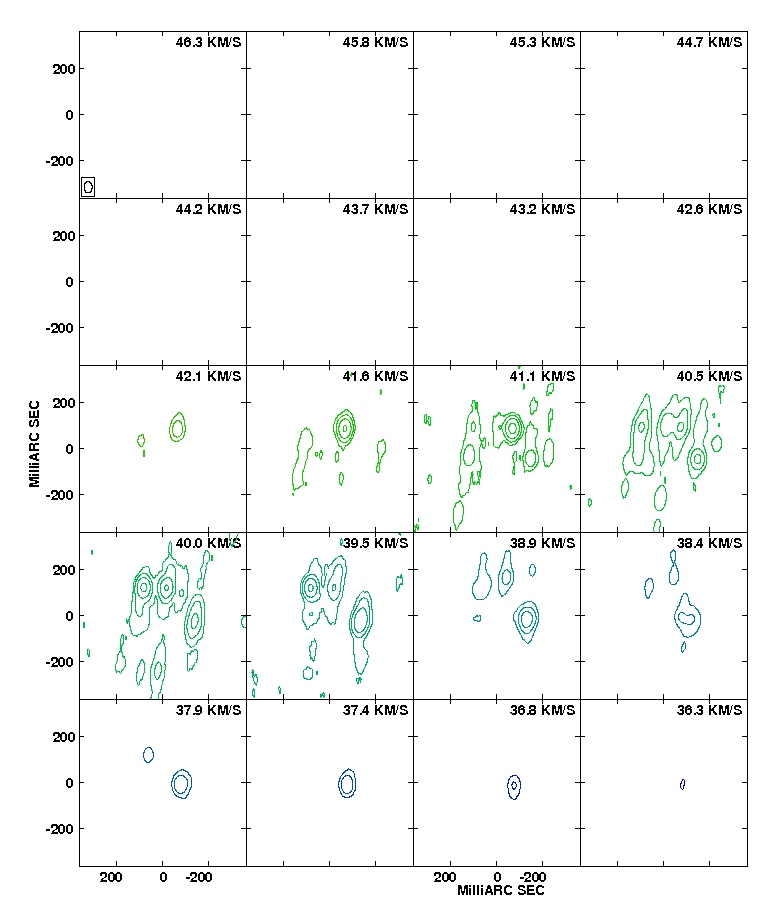
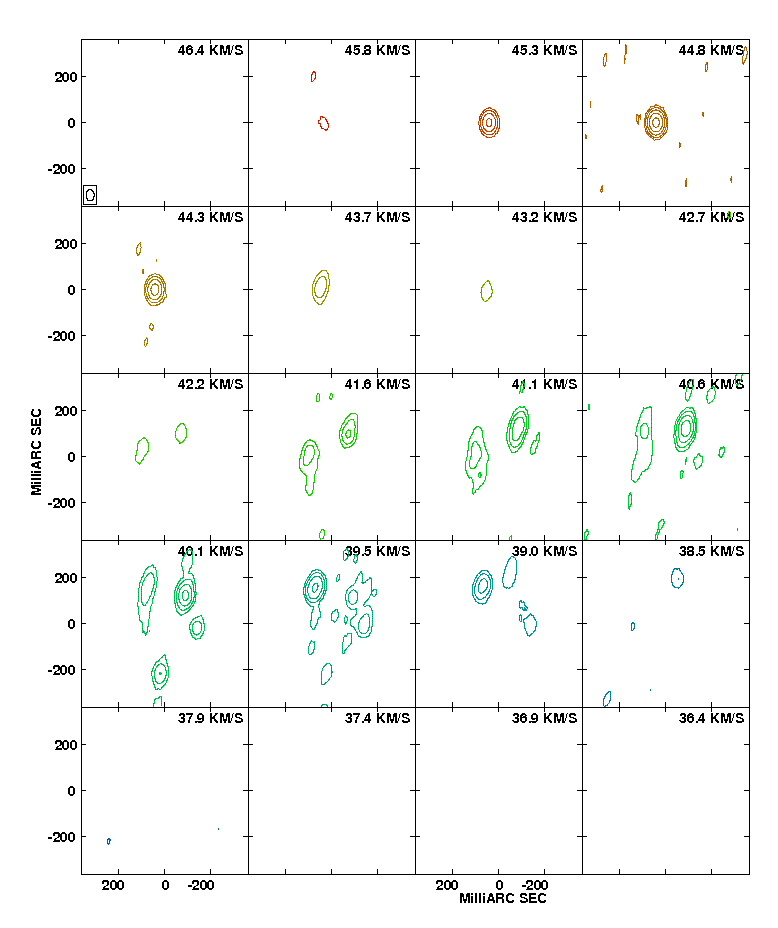
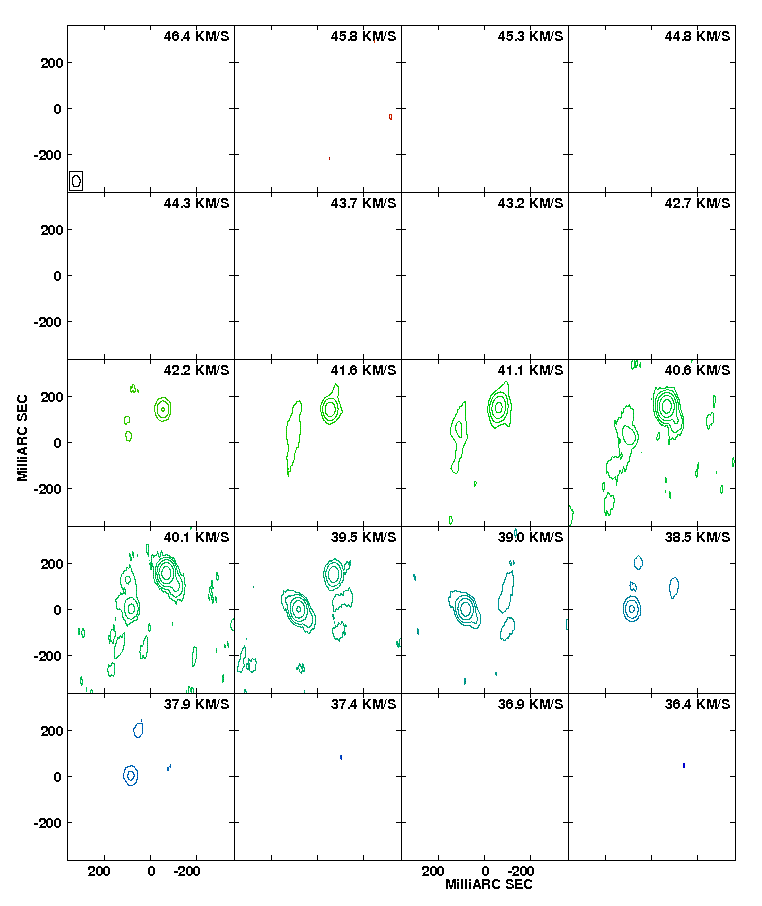
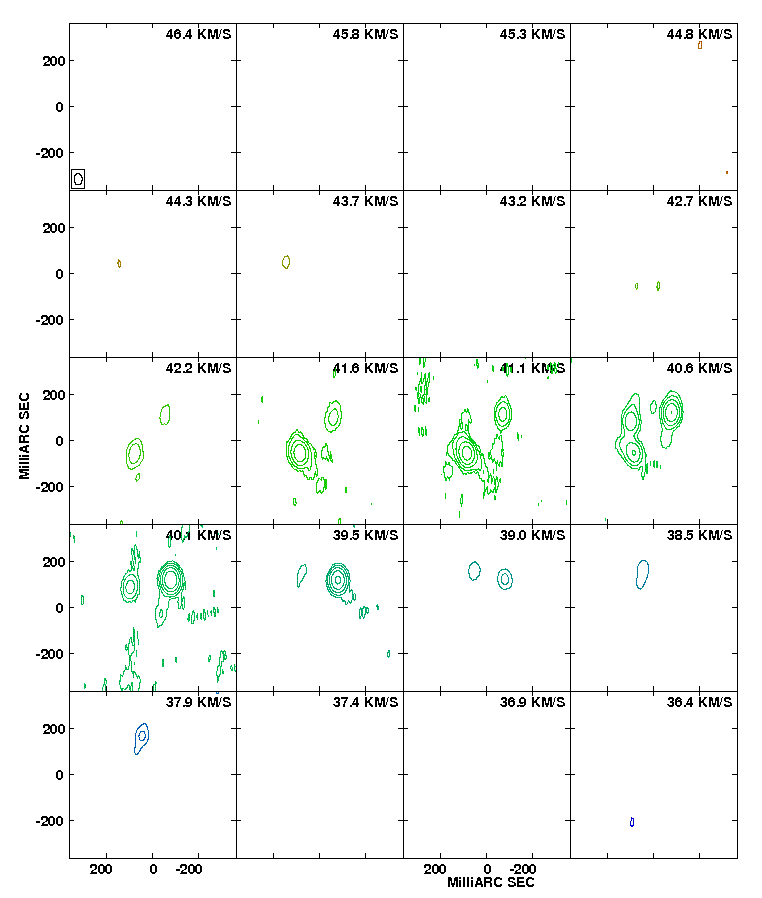
Appendix B Measured maser feature parameters
These tables list the maser feature parameters. Lists for VX Sgr were published by M03.
| (km s-1) | (km s-1) | (km s-1) | (mas) | (mas) | (mas) | (mas) | (Jy) |
|---|---|---|---|---|---|---|---|
| -52.5 | 0.6 | 0.15 | |||||
| -51.8 | 0.4 | 0.22 | |||||
| -51.6 | 1.4 | 0.35 | |||||
| -48.7 | 1.8 | 0.80 | |||||
| -48.2 | 0.8 | 0.19 | |||||
| -47.6 | 1.0 | 0.13 | |||||
| -47.6 | 0.8 | 0.14 | |||||
| -47.1 | 0.7 | 0.45 | |||||
| -46.8 | 1.2 | 0.22 | |||||
| -46.7 | 1.2 | 0.24 | |||||
| -46.3 | 1.9 | 7.05 | |||||
| -45.7 | 0.8 | 0.09 | |||||
| -45.7 | 0.8 | 1.11 | |||||
| -45.4 | 3.3 | 46.21 | |||||
| -45.4 | 0.9 | 0.94 | |||||
| -45.0 | 1.0 | 0.42 | |||||
| -44.9 | 2.7 | 8.12 | |||||
| -44.9 | 0.8 | 0.42 | |||||
| -44.6 | 0.5 | 0.15 | |||||
| -44.4 | 0.9 | 0.85 | |||||
| -44.0 | 1.0 | 0.48 | |||||
| -44.0 | 0.8 | 0.85 | |||||
| -43.8 | 1.7 | 1.96 | |||||
| -43.5 | 1.3 | 2.04 | |||||
| -43.1 | 0.6 | 0.15 | |||||
| -43.0 | 1.3 | 0.38 | |||||
| -42.7 | 1.6 | 3.26 | |||||
| -42.4 | 2.2 | 1.43 | |||||
| -42.4 | 0.6 | 0.44 | |||||
| -42.4 | 0.9 | 0.27 | |||||
| -41.9 | 1.3 | 1.29 | |||||
| -41.7 | 1.8 | 0.39 | |||||
| -41.6 | 0.6 | 0.31 | |||||
| -41.4 | 2.0 | 5.07 | |||||
| -41.1 | 1.7 | 14.35 | |||||
| -40.8 | 0.9 | 0.24 | |||||
| -40.5 | 0.8 | 0.21 | |||||
| -40.1 | 0.6 | 0.23 | |||||
| -40.0 | 1.9 | 0.42 | |||||
| -39.9 | 2.1 | 2.92 | |||||
| -39.9 | 0.7 | 0.30 | |||||
| -39.7 | 1.6 | 4.65 | |||||
| -39.0 | 0.7 | 0.25 | |||||
| -38.9 | 1.6 | 0.90 | |||||
| -38.8 | 0.8 | 0.30 | |||||
| -38.6 | 0.9 | 0.67 | |||||
| -38.5 | 0.7 | 2.11 | |||||
| -38.0 | 2.2 | 0.43 | |||||
| -38.0 | 1.0 | 0.84 | |||||
| -37.9 | 2.0 | 72.77 | |||||
| -37.7 | 0.5 | 0.69 | |||||
| -37.6 | 1.2 | 7.44 | |||||
| -37.2 | 1.3 | 1.43 | |||||
| -37.2 | 0.4 | 0.32 | |||||
| -36.9 | 0.5 | 0.23 | |||||
| -36.8 | 1.7 | 0.69 | |||||
| -36.8 | 0.8 | 0.30 | |||||
| -36.6 | 1.3 | 0.45 | |||||
| -36.6 | 0.9 | 0.40 | |||||
| -36.5 | 1.9 | 3.77 | |||||
| -36.5 | 0.7 | 0.29 | |||||
| -35.9 | 0.8 | 0.14 | |||||
| -35.9 | 0.5 | 0.14 | |||||
| -35.9 | 0.6 | 0.20 | |||||
| -35.6 | 0.5 | 0.41 |
| (km s-1) | (km s-1) | (km s-1) | (mas) | (mas) | (mas) | (mas) | (Jy) |
|---|---|---|---|---|---|---|---|
| -35.4 | 1.0 | 1.44 | |||||
| -35.4 | 1.3 | 0.44 | |||||
| -35.3 | 1.4 | 11.24 | |||||
| -35.2 | 0.7 | 0.29 | |||||
| -35.2 | 0.6 | 0.50 | |||||
| -34.9 | 1.9 | 1.44 | |||||
| -34.5 | 0.7 | 0.33 | |||||
| -34.4 | 2.1 | 11.86 | |||||
| -34.3 | 1.6 | 1.75 | |||||
| -34.1 | 2.4 | 10.16 | |||||
| -34.1 | 1.3 | 1.07 | |||||
| -33.4 | 1.9 | 17.62 | |||||
| -33.4 | 0.8 | 0.47 | |||||
| -33.4 | 0.5 | 0.49 | |||||
| -33.3 | 0.7 | 0.19 | |||||
| -33.1 | 0.5 | 0.33 | |||||
| -32.9 | 0.5 | 0.25 | |||||
| -32.0 | 1.0 | 0.78 | |||||
| -32.0 | 0.7 | 0.68 | |||||
| -32.0 | 0.8 | 1.02 | |||||
| -31.5 | 2.4 | 53.76 | |||||
| -31.0 | 1.2 | 1.28 | |||||
| -30.8 | 1.7 | 2.81 | |||||
| -30.7 | 1.2 | 0.41 | |||||
| -30.3 | 0.8 | 0.22 | |||||
| -29.8 | 1.9 | 12.96 |
| (km s-1) | (km s-1) | (km s-1) | (mas) | (mas) | (mas) | (mas) | (Jy) |
|---|---|---|---|---|---|---|---|
| -29.0 | 0.7 | 0.32 | |||||
| -28.1 | 0.8 | 0.48 | |||||
| -57.9 | 2.5 | 1.83 | |||||
| -55.8 | 1.9 | 1.29 | |||||
| -55.5 | 2.3 | 1.08 | |||||
| -53.9 | 0.8 | 0.08 | |||||
| -53.5 | 3.4 | 1.90 | |||||
| -51.1 | 1.5 | 0.18 | |||||
| -50.5 | 4.0 | 2.44 | |||||
| -49.8 | 1.3 | 0.19 | |||||
| -49.1 | 2.7 | 2.66 | |||||
| -48.3 | 2.9 | 1.80 | |||||
| -47.9 | 0.8 | 0.18 | |||||
| -47.8 | 2.1 | 1.74 | |||||
| -47.8 | 1.3 | 3.37 | |||||
| -47.6 | 0.8 | 0.13 | |||||
| -47.6 | 1.3 | 1.58 | |||||
| -46.9 | 1.0 | 1.02 | |||||
| -46.8 | 0.8 | 0.12 | |||||
| -46.8 | 1.3 | 39.38 | |||||
| -46.7 | 0.6 | 0.16 | |||||
| -46.0 | 0.8 | 0.12 | |||||
| -45.9 | 0.6 | 0.21 | |||||
| -45.8 | 2.9 | 38.99 | |||||
| -45.2 | 1.0 | 1.39 | |||||
| -45.1 | 0.8 | 0.94 | |||||
| -44.7 | 1.3 | 0.13 | |||||
| -44.6 | 0.6 | 0.14 | |||||
| -44.5 | 0.6 | 0.57 | |||||
| -44.1 | 1.3 | 0.20 | |||||
| -43.8 | 1.3 | 33.28 | |||||
| -43.8 | 2.9 | 8.60 | |||||
| -43.5 | 0.8 | 0.05 | |||||
| -43.5 | 0.8 | 0.35 |
| (km s-1) | (km s-1) | (km s-1) | (mas) | (mas) | (mas) | (mas) | (Jy) |
|---|---|---|---|---|---|---|---|
| -43.1 | 1.3 | 1.89 | |||||
| -42.5 | 0.6 | 0.17 | |||||
| -42.5 | 1.0 | 0.28 | |||||
| -42.4 | 0.8 | 0.14 | |||||
| -42.1 | 1.3 | 1.24 | |||||
| -41.9 | 1.7 | 0.26 | |||||
| -41.0 | 1.5 | 0.14 | |||||
| -40.8 | 2.7 | 16.12 | |||||
| -40.8 | 1.0 | 2.52 | |||||
| -40.8 | 0.6 | 0.03 | |||||
| -40.6 | 1.9 | 0.52 | |||||
| -39.9 | 1.5 | 0.13 | |||||
| -39.5 | 1.7 | 3.10 | |||||
| -39.4 | 0.8 | 15.44 | |||||
| -39.4 | 1.3 | 0.13 | |||||
| -39.3 | 0.6 | 0.04 | |||||
| -39.2 | 1.9 | 0.88 | |||||
| -39.0 | 1.7 | 0.53 | |||||
| -38.9 | 2.3 | 1.50 | |||||
| -38.1 | 1.7 | 1.52 | |||||
| -37.9 | 3.1 | 42.61 | |||||
| -37.9 | 0.6 | 0.22 | |||||
| -37.8 | 0.8 | 0.26 | |||||
| -37.8 | 0.8 | 0.21 | |||||
| -37.8 | 1.9 | 0.45 | |||||
| -37.6 | 0.6 | 0.04 | |||||
| -37.4 | 0.8 | 0.34 | |||||
| -37.1 | 2.3 | 12.73 | |||||
| -36.9 | 0.8 | 0.13 | |||||
| -36.8 | 0.6 | 0.10 | |||||
| -36.5 | 1.7 | 0.19 | |||||
| -36.2 | 0.6 | 0.09 | |||||
| -35.9 | 0.8 | 0.23 | |||||
| -35.6 | 2.3 | 26.31 | |||||
| -35.6 | 0.8 | 0.07 | |||||
| -34.5 | 0.6 | 0.06 | |||||
| -34.5 | 0.6 | 0.12 | |||||
| -34.5 | 2.1 | 0.54 | |||||
| -34.3 | 0.6 | 0.15 | |||||
| -34.2 | 3.6 | 42.14 | |||||
| -34.1 | 1.0 | 0.07 | |||||
| -34.0 | 2.1 | 8.64 | |||||
| -33.9 | 0.6 | 0.18 | |||||
| -33.4 | 0.8 | 0.28 | |||||
| -33.4 | 1.9 | 1.76 | |||||
| -32.9 | 1.3 | 2.28 | |||||
| -32.4 | 2.7 | 1.15 | |||||
| -31.7 | 0.8 | 0.78 | |||||
| -31.4 | 0.8 | 0.33 | |||||
| -31.2 | 2.1 | 1.02 | |||||
| -31.1 | 2.5 | 7.12 | |||||
| -30.6 | 1.5 | 0.60 | |||||
| -30.5 | 1.5 | 0.25 | |||||
| -30.4 | 1.9 | 0.42 | |||||
| -29.9 | 1.7 | 9.42 | |||||
| -29.5 | 0.8 | 0.14 | |||||
| -28.9 | 0.6 | 0.07 | |||||
| -28.5 | 1.5 | 0.12 | |||||
| -28.3 | 1.3 | 0.18 | |||||
| -28.1 | 1.3 | 0.87 | |||||
| -28.1 | 0.8 | 0.19 | |||||
| -26.9 | 1.5 | 0.61 | |||||
| -26.7 | 1.0 | 0.12 | |||||
| -26.7 | 1.9 | 0.31 | |||||
| -26.3 | 2.5 | 1.40 | |||||
| -25.8 | 1.3 | 0.09 | |||||
| -25.6 | 0.6 | 0.09 | |||||
| -25.2 | 2.1 | 2.77 |
| (km s-1) | (km s-1) | (km s-1) | (mas) | (mas) | (mas) | (mas) | (Jy) |
|---|---|---|---|---|---|---|---|
| -40.8 | 0.3 | 0.04 | |||||
| -40.7 | 1.5 | 0.37 | |||||
| -40.1 | 0.5 | 0.07 | |||||
| -38.0 | 0.3 | 0.10 | |||||
| -37.9 | 0.3 | 0.15 | |||||
| -37.6 | 0.7 | 0.92 | |||||
| -37.5 | 0.3 | 0.34 | |||||
| -37.5 | 0.3 | 0.06 | |||||
| -37.4 | 2.0 | 15.76 | |||||
| -37.3 | 0.4 | 0.35 | |||||
| -37.3 | 0.3 | 0.08 | |||||
| -36.8 | 0.7 | 0.24 | |||||
| -36.8 | 0.6 | 0.15 | |||||
| -35.5 | 1.8 | 1.22 |
| (km s-1) | (km s-1) | (km s-1) | (mas) | (mas) | (mas) | (mas) | (Jy) |
|---|---|---|---|---|---|---|---|
| -42.1 | 0.2 | 0.38 | |||||
| -41.8 | 1.5 | 0.83 | |||||
| -41.4 | 0.3 | 0.27 | |||||
| -39.6 | 0.7 | 0.42 | |||||
| -39.1 | 1.6 | 1.68 | |||||
| -39.0 | 0.7 | 0.30 | |||||
| -38.4 | 0.5 | 0.36 | |||||
| -38.3 | 0.5 | 0.85 | |||||
| -38.0 | 1.9 | 55.93 | |||||
| -37.9 | 0.8 | 0.77 | |||||
| -37.8 | 0.4 | 0.38 | |||||
| -35.6 | 0.6 | 0.39 |
| (km s-1) | (km s-1) | (km s-1) | (mas) | (mas) | (mas) | (mas) | (Jy) |
|---|---|---|---|---|---|---|---|
| -42.3 | 0.5 | 0.51 | |||||
| -42.1 | 1.1 | 0.93 | |||||
| -41.6 | 0.5 | 0.67 | |||||
| -41.3 | 1.5 | 0.85 | |||||
| -40.7 | 1.5 | 1.08 | |||||
| -40.6 | 0.5 | 0.30 | |||||
| -39.1 | 0.4 | 0.64 | |||||
| -38.9 | 0.4 | 0.37 | |||||
| -38.7 | 0.4 | 1.06 | |||||
| -38.7 | 0.8 | 0.51 | |||||
| -38.7 | 0.8 | 0.52 | |||||
| -38.7 | 0.6 | 0.66 | |||||
| -38.6 | 0.7 | 0.59 | |||||
| -38.6 | 1.4 | 0.90 | |||||
| -38.6 | 0.5 | 0.19 | |||||
| -38.5 | 0.9 | 2.53 | |||||
| -38.5 | 0.5 | 1.22 | |||||
| -38.5 | 0.5 | 0.25 | |||||
| -38.4 | 0.4 | 0.27 | |||||
| -38.3 | 0.4 | 0.53 | |||||
| -38.2 | 0.6 | 4.98 | |||||
| -37.9 | 1.1 | 0.54 | |||||
| -37.9 | 0.9 | 0.45 | |||||
| -37.9 | 0.5 | 0.37 | |||||
| -37.8 | 0.7 | 2.75 | |||||
| -37.8 | 0.8 | 1.19 | |||||
| -37.8 | 0.4 | 1.22 | |||||
| -37.7 | 0.5 | 7.43 |
| (km s-1) | (km s-1) | (km s-1) | (mas) | (mas) | (mas) | (mas) | (Jy) |
|---|---|---|---|---|---|---|---|
| -37.7 | 0.5 | 0.86 | |||||
| -37.5 | 0.9 | 2.11 | |||||
| -37.5 | 1.4 | 8.49 | |||||
| -37.5 | 0.5 | 3.43 | |||||
| -37.5 | 0.7 | 1.37 |
| (km s-1) | (km s-1) | (km s-1) | (mas) | (mas) | (mas) | (mas) | (Jy) |
|---|---|---|---|---|---|---|---|
| -41.4 | 0.7 | 0.52 | |||||
| -41.0 | 2.0 | 1.61 | |||||
| -41.0 | 1.3 | 1.14 | |||||
| -40.8 | 0.6 | 0.53 | |||||
| -40.4 | 0.5 | 0.20 | |||||
| -39.9 | 1.4 | 2.86 | |||||
| -39.5 | 1.7 | 2.12 | |||||
| -39.4 | 1.1 | 0.58 | |||||
| -39.2 | 1.4 | 1.68 | |||||
| -39.2 | 1.7 | 3.00 | |||||
| -39.0 | 1.3 | 1.40 | |||||
| -39.0 | 0.5 | 0.46 | |||||
| -38.9 | 1.6 | 4.71 | |||||
| -38.6 | 0.7 | 0.72 | |||||
| -38.4 | 1.1 | 2.28 | |||||
| -38.1 | 0.6 | 0.42 | |||||
| -37.9 | 1.6 | 4.06 | |||||
| -37.9 | 0.6 | 0.92 | |||||
| -37.9 | 0.5 | 0.24 | |||||
| -37.8 | 0.8 | 3.43 | |||||
| -37.8 | 1.4 | 2.22 | |||||
| -37.8 | 0.4 | 0.48 | |||||
| -37.6 | 0.9 | 0.68 | |||||
| -37.5 | 1.4 | 10.39 | |||||
| -37.4 | 0.8 | 0.54 |
| (km s-1) | (km s-1) | (km s-1) | (mas) | (mas) | (mas) | (mas) | (Jy) |
|---|---|---|---|---|---|---|---|
| -21.6 | 1.3 | 0.75 | |||||
| -20.4 | 1.2 | 1.72 | |||||
| -20.3 | 0.6 | 0.22 | |||||
| -19.5 | 0.4 | 0.78 | |||||
| -19.1 | 1.7 | 3.96 | |||||
| -18.9 | 0.3 | 0.51 | |||||
| -18.5 | 0.3 | 0.45 | |||||
| -18.1 | 1.3 | 2.52 | |||||
| -18.0 | 0.9 | 0.88 | |||||
| -17.9 | 1.1 | 2.44 | |||||
| -17.2 | 1.0 | 1.62 | |||||
| -16.8 | 0.7 | 0.69 | |||||
| -16.6 | 1.7 | 4.16 | |||||
| -16.6 | 0.3 | 0.22 | |||||
| -16.5 | 0.5 | 0.70 | |||||
| -16.0 | 1.4 | 2.73 | |||||
| -15.5 | 0.4 | 0.94 | |||||
| -15.2 | 3.0 | 10.72 | |||||
| -14.8 | 1.5 | 8.42 | |||||
| -14.8 | 1.0 | 2.23 | |||||
| -14.4 | 0.7 | 0.96 | |||||
| -14.2 | 0.4 | 0.41 | |||||
| -14.1 | 0.8 | 1.99 | |||||
| -14.0 | 0.4 | 0.41 |
| (km s-1) | (km s-1) | (km s-1) | (mas) | (mas) | (mas) | (mas) | (Jy) |
|---|---|---|---|---|---|---|---|
| -13.7 | 0.7 | 0.32 | |||||
| -13.6 | 0.6 | 0.55 | |||||
| -13.4 | 0.4 | 0.27 | |||||
| -13.0 | 0.7 | 0.25 | |||||
| -12.9 | 1.1 | 0.44 | |||||
| -12.8 | 0.8 | 0.38 | |||||
| -12.2 | 1.1 | 0.23 | |||||
| -12.2 | 0.4 | 0.14 | |||||
| -11.5 | 0.5 | 0.12 | |||||
| -10.2 | 0.8 | 0.27 |
| (km s-1) | (km s-1) | (km s-1) | (mas) | (mas) | (mas) | (mas) | (Jy) |
|---|---|---|---|---|---|---|---|
| -18.5 | 2.3 | 3.77 | |||||
| -17.8 | 1.3 | 12.30 | |||||
| -17.3 | 0.8 | 2.19 | |||||
| -17.3 | 1.6 | 7.36 | |||||
| -16.8 | 1.7 | 122.30 | |||||
| -16.7 | 0.9 | 1.16 | |||||
| -16.7 | 0.6 | 0.30 | |||||
| -16.6 | 1.4 | 7.27 | |||||
| -16.6 | 0.8 | 6.58 | |||||
| -16.4 | 1.1 | 3.42 | |||||
| -16.4 | 0.6 | 0.45 | |||||
| -16.3 | 1.1 | 0.72 | |||||
| -16.1 | 1.4 | 3.20 | |||||
| -15.9 | 1.9 | 3.10 | |||||
| -15.8 | 1.9 | 4.09 | |||||
| -15.8 | 0.4 | 0.72 | |||||
| -15.7 | 0.7 | 1.70 | |||||
| -15.5 | 0.5 | 0.48 | |||||
| -15.3 | 0.5 | 1.67 | |||||
| -15.1 | 1.1 | 13.49 | |||||
| -15.1 | 0.8 | 29.47 | |||||
| -15.0 | 1.1 | 140.80 | |||||
| -15.0 | 0.4 | 0.88 | |||||
| -14.9 | 0.7 | 2.00 | |||||
| -14.8 | 1.1 | 4.44 | |||||
| -14.7 | 1.5 | 56.66 | |||||
| -14.7 | 0.7 | 2.20 | |||||
| -14.6 | 0.9 | 1.68 | |||||
| -14.6 | 0.7 | 0.51 | |||||
| -14.5 | 0.5 | 2.08 | |||||
| -14.4 | 0.6 | 2.42 | |||||
| -14.3 | 0.5 | 5.12 | |||||
| -14.2 | 1.3 | 2.49 | |||||
| -14.2 | 1.2 | 1.14 | |||||
| -14.2 | 0.9 | 1.63 | |||||
| -13.9 | 0.6 | 1.71 | |||||
| -13.8 | 1.6 | 37.23 | |||||
| -13.6 | 2.0 | 3.77 | |||||
| -13.4 | 1.1 | 1.99 | |||||
| -13.3 | 1.5 | 3.66 | |||||
| -13.3 | 0.9 | 0.46 | |||||
| -13.1 | 0.7 | 0.60 | |||||
| -12.4 | 1.7 | 9.00 | |||||
| -12.3 | 0.6 | 0.84 | |||||
| -11.7 | 1.2 | 1.90 | |||||
| -11.0 | 1.4 | 0.99 | |||||
| -10.2 | 1.7 | 3.13 | |||||
| -10.2 | 0.4 | 0.36 |
| (km s-1) | (km s-1) | (km s-1) | (mas) | (mas) | (mas) | (mas) | (Jy) |
|---|---|---|---|---|---|---|---|
| -19.9 | 0.5 | 0.48 | |||||
| -18.3 | 0.5 | 0.32 | |||||
| -17.9 | 1.4 | 4.69 | |||||
| -17.9 | 2.6 | 3.58 | |||||
| -17.3 | 1.5 | 1.03 | |||||
| -17.3 | 0.6 | 0.28 | |||||
| -17.2 | 0.4 | 0.29 | |||||
| -16.9 | 1.6 | 4.63 | |||||
| -16.8 | 2.1 | 0.36 | |||||
| -16.3 | 1.8 | 1.83 | |||||
| -16.3 | 1.1 | 4.59 | |||||
| -16.3 | 1.5 | 1.55 | |||||
| -16.1 | 1.1 | 8.93 | |||||
| -16.0 | 2.1 | 4.67 | |||||
| -15.9 | 2.1 | 38.01 | |||||
| -15.8 | 1.1 | 0.94 | |||||
| -15.8 | 0.6 | 0.95 | |||||
| -15.8 | 0.5 | 0.35 | |||||
| -15.8 | 0.6 | 0.48 | |||||
| -15.4 | 0.5 | 0.68 | |||||
| -15.3 | 0.5 | 0.43 | |||||
| -15.2 | 0.9 | 7.21 | |||||
| -15.2 | 0.5 | 0.56 | |||||
| -15.1 | 1.9 | 0.83 | |||||
| -15.1 | 1.1 | 2.13 | |||||
| -15.0 | 1.5 | 6.42 | |||||
| -15.0 | 0.6 | 5.01 | |||||
| -14.8 | 0.8 | 0.35 | |||||
| -14.7 | 1.3 | 0.61 | |||||
| -14.5 | 1.3 | 6.33 | |||||
| -14.4 | 0.9 | 0.87 | |||||
| -14.3 | 0.9 | 0.87 | |||||
| -14.0 | 1.4 | 1.80 | |||||
| -13.7 | 1.1 | 6.94 | |||||
| -12.8 | 0.9 | 1.14 | |||||
| -11.7 | 0.6 | 0.22 |
| (km s-1) | (km s-1) | (km s-1) | (mas) | (mas) | (mas) | (mas) | (Jy) |
|---|---|---|---|---|---|---|---|
| 21.3 | 0.3 | 0.03 | |||||
| 21.8 | 0.7 | 0.13 | |||||
| 21.9 | 0.7 | 0.19 | |||||
| 22.2 | 0.3 | 0.02 | |||||
| 22.3 | 0.3 | 0.04 | |||||
| 22.5 | 0.8 | 0.16 | |||||
| 22.6 | 0.5 | 0.07 | |||||
| 24.2 | 0.3 | 0.03 | |||||
| 24.2 | 0.4 | 0.02 | |||||
| 24.3 | 0.3 | 0.02 | |||||
| 24.4 | 0.9 | 0.14 | |||||
| 24.4 | 0.3 | 0.03 | |||||
| 24.9 | 0.3 | 0.02 | |||||
| 24.9 | 0.6 | 0.08 | |||||
| 25.1 | 0.6 | 0.03 | |||||
| 25.2 | 0.6 | 0.06 | |||||
| 25.4 | 0.4 | 0.03 | |||||
| 25.4 | 0.4 | 0.06 | |||||
| 25.4 | 0.3 | 0.03 | |||||
| 25.8 | 0.4 | 0.03 | |||||
| 25.8 | 0.3 | 0.01 | |||||
| 25.8 | 0.6 | 0.13 | |||||
| 25.8 | 0.6 | 0.13 | |||||
| 25.9 | 0.4 | 0.03 |
| (km s-1) | (km s-1) | (km s-1) | (mas) | (mas) | (mas) | (mas) | (Jy) |
|---|---|---|---|---|---|---|---|
| 25.9 | 0.3 | 0.02 | |||||
| 26.0 | 0.5 | 0.06 | |||||
| 26.1 | 0.3 | 0.02 | |||||
| 26.2 | 0.3 | 0.04 | |||||
| 26.4 | 0.4 | 0.07 | |||||
| 26.5 | 0.3 | 0.02 | |||||
| 26.6 | 0.4 | 0.03 | |||||
| 26.6 | 0.4 | 0.08 | |||||
| 26.6 | 0.3 | 0.03 | |||||
| 26.6 | 0.7 | 0.22 | |||||
| 26.6 | 0.7 | 0.26 | |||||
| 26.7 | 0.5 | 0.14 | |||||
| 26.9 | 0.3 | 0.04 | |||||
| 27.0 | 0.3 | 0.13 | |||||
| 27.2 | 0.8 | 0.16 | |||||
| 27.3 | 1.0 | 0.05 | |||||
| 27.3 | 0.3 | 0.05 | |||||
| 27.4 | 0.3 | 0.02 | |||||
| 27.5 | 0.6 | 0.10 | |||||
| 27.5 | 0.3 | 0.02 | |||||
| 27.6 | 0.3 | 0.11 | |||||
| 27.6 | 5.3 | 2.82 | |||||
| 27.6 | 0.4 | 0.12 | |||||
| 27.8 | 0.4 | 0.05 | |||||
| 28.0 | 1.4 | 0.69 | |||||
| 28.1 | 0.6 | 0.07 | |||||
| 28.1 | 0.3 | 0.03 | |||||
| 28.2 | 0.5 | 0.05 | |||||
| 28.2 | 0.4 | 0.04 | |||||
| 28.2 | 0.4 | 0.04 | |||||
| 28.3 | 0.4 | 0.05 | |||||
| 28.4 | 0.6 | 0.08 | |||||
| 28.5 | 0.3 | 0.04 | |||||
| 28.7 | 0.5 | 0.08 | |||||
| 28.7 | 0.4 | 0.04 | |||||
| 28.9 | 0.3 | 0.05 | |||||
| 28.9 | 0.3 | 0.04 | |||||
| 28.9 | 0.7 | 0.16 | |||||
| 29.1 | 1.4 | 2.44 | |||||
| 29.3 | 2.1 | 1.58 | |||||
| 29.3 | 0.9 | 0.19 | |||||
| 29.3 | 0.3 | 0.08 | |||||
| 29.4 | 1.0 | 0.25 | |||||
| 29.5 | 0.6 | 0.17 | |||||
| 29.5 | 2.0 | 12.29 | |||||
| 29.6 | 0.5 | 0.06 | |||||
| 29.7 | 0.8 | 0.17 | |||||
| 30.1 | 0.4 | 0.07 | |||||
| 30.3 | 0.3 | 0.10 | |||||
| 30.3 | 0.7 | 0.30 | |||||
| 30.4 | 0.8 | 0.27 | |||||
| 30.4 | 0.9 | 0.14 | |||||
| 30.4 | 0.3 | 0.08 | |||||
| 30.6 | 0.4 | 0.06 | |||||
| 30.7 | 0.5 | 0.10 | |||||
| 30.8 | 0.7 | 0.17 | |||||
| 30.8 | 0.5 | 0.10 | |||||
| 30.8 | 0.3 | 0.03 | |||||
| 30.8 | 0.3 | 0.03 | |||||
| 30.9 | 0.5 | 0.05 | |||||
| 31.0 | 0.4 | 0.13 | |||||
| 31.0 | 0.4 | 0.15 | |||||
| 31.0 | 0.5 | 0.15 | |||||
| 31.1 | 0.6 | 0.03 | |||||
| 31.3 | 0.3 | 0.05 | |||||
| 31.4 | 0.4 | 0.15 |
| (km s-1) | (km s-1) | (km s-1) | (mas) | (mas) | (mas) | (mas) | (Jy) |
|---|---|---|---|---|---|---|---|
| 31.4 | 0.4 | 0.21 | |||||
| 31.5 | 0.5 | 0.13 | |||||
| 31.5 | 0.3 | 0.15 | |||||
| 31.6 | 2.1 | 26.74 | |||||
| 31.6 | 0.8 | 0.21 | |||||
| 31.6 | 0.5 | 0.11 | |||||
| 31.7 | 0.4 | 0.27 | |||||
| 31.8 | 2.6 | 2.21 | |||||
| 31.8 | 0.5 | 0.25 | |||||
| 31.9 | 0.4 | 0.22 | |||||
| 31.9 | 0.8 | 0.14 | |||||
| 31.9 | 0.4 | 0.11 | |||||
| 31.9 | 0.3 | 0.12 | |||||
| 32.0 | 0.7 | 0.32 | |||||
| 32.2 | 0.6 | 0.42 | |||||
| 32.2 | 0.4 | 0.13 | |||||
| 32.3 | 1.2 | 0.44 | |||||
| 32.3 | 0.3 | 0.06 | |||||
| 32.3 | 0.3 | 0.07 | |||||
| 32.4 | 1.3 | 1.07 | |||||
| 32.4 | 0.4 | 0.05 | |||||
| 32.4 | 0.8 | 0.20 | |||||
| 32.5 | 0.4 | 0.10 | |||||
| 32.8 | 0.3 | 0.04 | |||||
| 33.1 | 0.7 | 0.06 | |||||
| 33.3 | 0.5 | 0.06 | |||||
| 33.8 | 0.4 | 0.05 | |||||
| 34.1 | 0.7 | 0.10 | |||||
| 34.1 | 0.7 | 0.08 | |||||
| 34.2 | 0.4 | 0.08 | |||||
| 34.2 | 0.3 | 0.06 | |||||
| 34.5 | 4.1 | 5.93 | |||||
| 34.6 | 0.6 | 0.06 | |||||
| 34.7 | 0.5 | 0.07 | |||||
| 34.8 | 0.4 | 0.04 | |||||
| 35.2 | 0.3 | 0.02 | |||||
| 35.2 | 0.3 | 0.02 | |||||
| 35.6 | 0.3 | 0.03 | |||||
| 35.7 | 0.4 | 0.04 | |||||
| 35.9 | 0.6 | 0.05 | |||||
| 35.9 | 0.4 | 0.03 | |||||
| 36.2 | 0.3 | 0.03 | |||||
| 36.3 | 0.4 | 0.04 | |||||
| 36.3 | 0.4 | 0.05 | |||||
| 36.3 | 0.3 | 0.02 | |||||
| 36.3 | 0.8 | 0.08 | |||||
| 36.5 | 1.3 | 0.47 | |||||
| 36.8 | 0.4 | 0.03 | |||||
| 36.8 | 0.3 | 0.02 | |||||
| 37.0 | 0.6 | 0.09 | |||||
| 37.3 | 0.3 | 0.02 | |||||
| 37.4 | 0.7 | 0.07 | |||||
| 37.5 | 0.4 | 0.04 | |||||
| 37.6 | 0.4 | 0.04 | |||||
| 37.6 | 0.4 | 0.04 | |||||
| 37.8 | 1.2 | 0.71 | |||||
| 37.9 | 0.3 | 0.02 | |||||
| 38.0 | 0.6 | 0.05 | |||||
| 38.0 | 0.3 | 0.03 | |||||
| 38.0 | 0.4 | 0.04 | |||||
| 38.0 | 0.3 | 0.03 | |||||
| 38.1 | 1.8 | 1.78 | |||||
| 38.2 | 0.4 | 0.06 | |||||
| 38.3 | 0.7 | 0.14 | |||||
| 38.4 | 0.3 | 0.03 | |||||
| 38.4 | 0.3 | 0.04 |
| (km s-1) | (km s-1) | (km s-1) | (mas) | (mas) | (mas) | (mas) | (Jy) |
|---|---|---|---|---|---|---|---|
| 38.5 | 0.3 | 0.03 | |||||
| 38.5 | 0.4 | 0.04 | |||||
| 38.6 | 0.8 | 0.09 | |||||
| 38.6 | 0.4 | 0.40 | |||||
| 38.7 | 0.5 | 0.04 | |||||
| 38.8 | 0.3 | 0.05 | |||||
| 39.0 | 0.8 | 0.29 | |||||
| 39.1 | 0.4 | 0.03 | |||||
| 39.2 | 0.4 | 0.03 | |||||
| 39.3 | 0.3 | 0.03 | |||||
| 39.3 | 0.3 | 0.02 | |||||
| 39.4 | 0.4 | 0.18 | |||||
| 39.8 | 0.3 | 0.02 | |||||
| 39.8 | 0.3 | 0.02 | |||||
| 39.9 | 0.8 | 0.08 | |||||
| 39.9 | 0.4 | 0.09 | |||||
| 40.2 | 0.3 | 0.02 | |||||
| 40.3 | 1.1 | 0.29 | |||||
| 40.3 | 0.4 | 0.05 | |||||
| 40.4 | 0.3 | 0.03 | |||||
| 40.6 | 0.3 | 0.02 | |||||
| 40.7 | 0.3 | 0.03 | |||||
| 41.0 | 0.6 | 0.02 | |||||
| 41.1 | 0.3 | 0.03 | |||||
| 41.4 | 1.3 | 0.30 | |||||
| 41.5 | 2.8 | 0.30 | |||||
| 41.6 | 0.4 | 0.05 | |||||
| 41.7 | 0.4 | 0.03 | |||||
| 42.0 | 0.6 | 0.05 | |||||
| 42.1 | 0.3 | 0.03 | |||||
| 42.2 | 0.4 | 0.03 | |||||
| 42.3 | 0.3 | 0.02 | |||||
| 42.5 | 0.7 | 0.12 | |||||
| 42.5 | 0.3 | 0.03 | |||||
| 42.6 | 0.4 | 0.03 | |||||
| 42.6 | 0.4 | 0.03 | |||||
| 42.6 | 0.3 | 0.04 | |||||
| 42.7 | 1.1 | 0.19 | |||||
| 42.9 | 1.2 | 0.20 | |||||
| 42.9 | 0.9 | 0.12 | |||||
| 42.9 | 0.3 | 0.04 | |||||
| 43.0 | 1.0 | 0.14 | |||||
| 43.0 | 0.8 | 0.03 | |||||
| 43.0 | 0.6 | 0.04 | |||||
| 43.0 | 0.6 | 0.03 | |||||
| 43.1 | 0.3 | 0.02 | |||||
| 43.3 | 0.6 | 0.05 | |||||
| 43.4 | 0.4 | 0.03 | |||||
| 43.5 | 0.4 | 0.03 | |||||
| 43.9 | 0.3 | 0.02 | |||||
| 44.0 | 0.6 | 0.06 | |||||
| 44.1 | 0.3 | 0.02 | |||||
| 44.5 | 1.6 | 0.54 | |||||
| 44.6 | 0.3 | 0.03 | |||||
| 44.7 | 0.7 | 0.11 | |||||
| 44.7 | 0.3 | 0.06 | |||||
| 44.8 | 0.4 | 0.04 | |||||
| 44.8 | 0.5 | 0.06 | |||||
| 44.9 | 2.7 | 7.87 | |||||
| 44.9 | 1.7 | 3.19 | |||||
| 44.9 | 1.0 | 0.31 | |||||
| 44.9 | 0.5 | 0.06 | |||||
| 44.9 | 0.4 | 0.04 | |||||
| 44.9 | 0.4 | 0.03 | |||||
| 44.9 | 0.6 | 0.10 | |||||
| 45.0 | 0.6 | 0.03 |
| (km s-1) | (km s-1) | (km s-1) | (mas) | (mas) | (mas) | (mas) | (Jy) |
|---|---|---|---|---|---|---|---|
| 45.2 | 1.4 | 0.11 | |||||
| 45.2 | 0.5 | 0.07 | |||||
| 45.2 | 0.3 | 0.08 | |||||
| 45.3 | 1.6 | 2.30 | |||||
| 45.3 | 0.3 | 0.03 | |||||
| 45.3 | 0.4 | 0.07 | |||||
| 45.5 | 0.4 | 0.06 | |||||
| 45.5 | 0.5 | 0.08 | |||||
| 45.5 | 0.4 | 0.09 | |||||
| 45.5 | 0.5 | 0.17 | |||||
| 45.5 | 0.3 | 0.06 | |||||
| 45.6 | 0.7 | 0.22 | |||||
| 45.7 | 3.0 | 14.83 | |||||
| 45.7 | 0.6 | 0.10 | |||||
| 45.7 | 0.3 | 0.04 | |||||
| 45.8 | 0.6 | 0.12 | |||||
| 45.8 | 0.6 | 0.08 | |||||
| 45.8 | 0.6 | 0.08 | |||||
| 45.9 | 0.4 | 0.08 | |||||
| 45.9 | 0.3 | 0.06 | |||||
| 45.9 | 0.7 | 0.09 | |||||
| 46.0 | 0.6 | 0.08 | |||||
| 46.0 | 0.3 | 0.04 | |||||
| 46.0 | 0.5 | 0.05 | |||||
| 46.0 | 0.6 | 0.15 | |||||
| 46.0 | 0.4 | 0.07 | |||||
| 46.2 | 0.4 | 0.06 | |||||
| 46.2 | 0.4 | 0.06 | |||||
| 46.2 | 0.3 | 0.04 | |||||
| 46.3 | 0.3 | 0.04 | |||||
| 46.3 | 0.3 | 0.03 | |||||
| 46.4 | 0.3 | 0.05 | |||||
| 46.5 | 0.4 | 0.04 | |||||
| 46.5 | 0.6 | 0.14 | |||||
| 46.5 | 0.5 | 0.28 |
| (km s-1) | (km s-1) | (km s-1) | (mas) | (mas) | (mas) | (mas) | (Jy) |
|---|---|---|---|---|---|---|---|
| 21.0 | 1.5 | 4.92 | |||||
| 21.1 | 1.1 | 1.13 | |||||
| 21.5 | 1.1 | 1.30 | |||||
| 21.6 | 3.4 | 1.89 | |||||
| 21.8 | 2.3 | 1.67 | |||||
| 21.8 | 1.1 | 0.49 | |||||
| 22.0 | 1.3 | 2.50 | |||||
| 22.1 | 1.3 | 2.64 | |||||
| 22.3 | 1.7 | 1.01 | |||||
| 22.6 | 2.1 | 1.81 | |||||
| 22.6 | 0.8 | 1.09 | |||||
| 22.8 | 5.0 | 25.13 | |||||
| 23.1 | 1.5 | 3.62 | |||||
| 23.1 | 0.8 | 0.67 | |||||
| 23.3 | 2.7 | 5.39 | |||||
| 23.7 | 0.8 | 1.31 | |||||
| 23.9 | 1.5 | 3.89 | |||||
| 23.9 | 0.6 | 1.02 | |||||
| 24.2 | 1.3 | 1.02 | |||||
| 24.3 | 1.1 | 5.06 | |||||
| 24.3 | 1.1 | 2.10 | |||||
| 24.4 | 0.6 | 1.20 | |||||
| 24.5 | 0.6 | 4.27 | |||||
| 24.7 | 1.5 | 5.30 | |||||
| 24.8 | 1.7 | 2.01 |
| (km s-1) | (km s-1) | (km s-1) | (mas) | (mas) | (mas) | (mas) | (Jy) |
|---|---|---|---|---|---|---|---|
| 24.8 | 1.9 | 27.63 | |||||
| 25.0 | 1.1 | 0.86 | |||||
| 25.2 | 1.1 | 1.81 | |||||
| 25.4 | 0.8 | 3.07 | |||||
| 25.4 | 1.3 | 3.36 | |||||
| 25.6 | 1.3 | 2.11 | |||||
| 25.7 | 7.4 | 84.07 | |||||
| 25.7 | 1.5 | 2.59 | |||||
| 25.7 | 1.3 | 3.02 | |||||
| 25.7 | 0.6 | 1.53 | |||||
| 26.0 | 2.3 | 4.10 | |||||
| 26.1 | 0.6 | 1.17 | |||||
| 26.2 | 0.8 | 1.49 | |||||
| 26.5 | 0.8 | 0.38 | |||||
| 26.7 | 0.6 | 0.66 | |||||
| 26.9 | 1.7 | 0.86 | |||||
| 27.2 | 2.7 | 2.01 | |||||
| 27.6 | 1.3 | 0.68 | |||||
| 28.4 | 2.5 | 2.80 | |||||
| 28.8 | 2.5 | 2.75 | |||||
| 28.9 | 0.8 | 0.85 | |||||
| 29.5 | 1.9 | 3.52 | |||||
| 29.9 | 2.1 | 2.23 | |||||
| 30.3 | 1.5 | 3.02 | |||||
| 30.9 | 0.6 | 1.24 | |||||
| 31.8 | 1.1 | 1.27 | |||||
| 34.8 | 2.3 | 6.45 | |||||
| 36.9 | 1.3 | 1.88 | |||||
| 37.4 | 1.1 | 0.94 | |||||
| 38.7 | 1.1 | 1.32 | |||||
| 39.6 | 3.4 | 7.66 | |||||
| 40.2 | 0.6 | 0.90 | |||||
| 41.2 | 1.7 | 5.62 | |||||
| 41.2 | 0.6 | 0.60 | |||||
| 43.9 | 0.8 | 0.53 | |||||
| 44.6 | 1.3 | 1.95 | |||||
| 45.3 | 1.7 | 11.25 | |||||
| 46.3 | 0.6 | 0.77 | |||||
| 46.7 | 1.5 | 19.71 | |||||
| 46.7 | 0.6 | 0.64 | |||||
| 47.1 | 0.8 | 33.59 | |||||
| 47.4 | 1.7 | 1.34 | |||||
| 48.1 | 1.3 | 3.40 | |||||
| 48.2 | 1.9 | 8.35 | |||||
| 48.3 | 0.8 | 0.41 | |||||
| 48.7 | 2.7 | 11.78 | |||||
| 50.4 | 1.7 | 1.45 |
| (km s-1) | (km s-1) | (km s-1) | (mas) | (mas) | (mas) | (mas) | (Jy) |
|---|---|---|---|---|---|---|---|
| 20.6 | 1.7 | 3.89 | |||||
| 22.1 | 1.1 | 0.51 | |||||
| 22.7 | 0.6 | 0.54 | |||||
| 23.0 | 2.7 | 20.66 | |||||
| 23.4 | 0.8 | 1.64 | |||||
| 23.4 | 0.6 | 1.46 | |||||
| 23.4 | 1.3 | 0.54 | |||||
| 23.7 | 1.7 | 16.61 | |||||
| 23.9 | 0.8 | 1.69 | |||||
| 24.2 | 0.8 | 0.49 | |||||
| 24.6 | 1.9 | 1.35 | |||||
| 24.6 | 1.5 | 3.89 | |||||
| 24.9 | 1.9 | 2.74 |
| (km s-1) | (km s-1) | (km s-1) | (mas) | (mas) | (mas) | (mas) | (Jy) |
|---|---|---|---|---|---|---|---|
| 24.9 | 0.8 | 0.49 | |||||
| 25.1 | 1.3 | 0.65 | |||||
| 25.4 | 2.9 | 3.84 | |||||
| 25.6 | 1.3 | 0.75 | |||||
| 25.8 | 0.6 | 0.84 | |||||
| 25.9 | 0.8 | 1.16 | |||||
| 26.3 | 0.6 | 0.45 | |||||
| 27.8 | 1.1 | 1.74 | |||||
| 28.1 | 2.3 | 1.41 | |||||
| 29.6 | 0.8 | 0.59 | |||||
| 35.8 | 1.7 | 2.50 | |||||
| 36.4 | 1.1 | 1.29 | |||||
| 38.8 | 2.7 | 18.19 | |||||
| 40.0 | 1.3 | 0.59 | |||||
| 40.2 | 0.6 | 0.70 | |||||
| 41.1 | 1.3 | 16.58 | |||||
| 41.2 | 1.7 | 3.40 | |||||
| 41.6 | 1.1 | 0.47 | |||||
| 42.6 | 0.8 | 3.27 | |||||
| 44.8 | 0.6 | 0.55 | |||||
| 46.2 | 1.5 | 2.02 | |||||
| 47.2 | 1.7 | 8.31 | |||||
| 47.4 | 1.1 | 1.55 | |||||
| 47.6 | 0.6 | 1.67 | |||||
| 47.8 | 0.8 | 1.03 | |||||
| 48.2 | 1.1 | 1.70 | |||||
| 48.7 | 1.5 | 1.84 |
| (km s-1) | (km s-1) | (km s-1) | (mas) | (mas) | (mas) | (mas) | (Jy) |
|---|---|---|---|---|---|---|---|
| 10.4 | 1.9 | 11.37 | |||||
| 10.5 | 1.8 | 0.80 | |||||
| 10.5 | 0.9 | 0.66 | |||||
| 10.7 | 2.1 | 26.71 | |||||
| 10.9 | 0.9 | 0.56 | |||||
| 11.0 | 1.3 | 2.24 | |||||
| 11.1 | 2.2 | 3.25 | |||||
| 12.1 | 3.2 | 7.87 | |||||
| 12.2 | 1.5 | 4.08 | |||||
| 12.2 | 1.6 | 6.82 | |||||
| 12.3 | 1.6 | 3.39 | |||||
| 12.4 | 3.3 | 10.55 | |||||
| 12.4 | 4.4 | 360.30 | |||||
| 12.5 | 1.9 | 2.68 | |||||
| 12.6 | 1.2 | 4.11 | |||||
| 12.8 | 0.5 | 2.04 | |||||
| 14.0 | 1.2 | 1.27 | |||||
| 14.1 | 2.6 | 44.05 | |||||
| 14.5 | 2.6 | 30.91 | |||||
| 15.2 | 1.9 | 0.64 | |||||
| 16.1 | 2.1 | 2.80 | |||||
| 16.3 | 2.3 | 1.46 | |||||
| 16.3 | 1.5 | 1.51 | |||||
| 17.8 | 2.9 | 1.01 | |||||
| 17.9 | 0.7 | 0.35 | |||||
| 18.0 | 1.8 | 6.63 | |||||
| 19.0 | 2.9 | 0.89 | |||||
| 19.1 | 1.0 | 0.48 |
| (km s-1) | (km s-1) | (km s-1) | (mas) | (mas) | (mas) | (mas) | (Jy) |
|---|---|---|---|---|---|---|---|
| 19.4 | 1.4 | 0.97 | |||||
| 20.9 | 1.7 | 1.23 | |||||
| 21.1 | 1.2 | 0.86 | |||||
| 21.7 | 1.7 | 1.29 | |||||
| 22.2 | 2.9 | 12.43 | |||||
| 23.0 | 1.4 | 4.20 | |||||
| 23.0 | 1.4 | 0.98 | |||||
| 23.0 | 1.9 | 0.98 | |||||
| 23.1 | 2.6 | 101.34 | |||||
| 23.1 | 1.6 | 1.79 | |||||
| 23.1 | 1.0 | 1.23 | |||||
| 23.2 | 1.9 | 1.67 | |||||
| 23.2 | 0.9 | 0.95 | |||||
| 23.2 | 0.4 | 0.72 | |||||
| 23.3 | 2.0 | 5.38 | |||||
| 23.4 | 0.8 | 0.58 | |||||
| 23.4 | 0.5 | 0.53 | |||||
| 23.7 | 1.1 | 2.15 | |||||
| 24.0 | 1.8 | 2.65 | |||||
| 24.0 | 1.1 | 3.18 | |||||
| 24.5 | 0.7 | 0.38 | |||||
| 24.7 | 1.7 | 12.76 | |||||
| 24.7 | 0.6 | 0.52 | |||||
| 25.3 | 1.3 | 1.10 | |||||
| 25.3 | 0.4 | 0.33 | |||||
| 25.9 | 0.5 | 0.27 | |||||
| 26.3 | 0.9 | 0.75 |
| (km s-1) | (km s-1) | (km s-1) | (mas) | (mas) | (mas) | (mas) | (Jy) |
|---|---|---|---|---|---|---|---|
| 9.8 | 0.5 | 1.50 | |||||
| 10.3 | 0.3 | 0.70 | |||||
| 10.6 | 0.4 | 1.00 | |||||
| 11.1 | 0.6 | 0.80 | |||||
| 11.7 | 2.9 | 0.40 | |||||
| 12.5 | 0.5 | 1.70 | |||||
| 12.7 | 0.6 | 1.40 | |||||
| 12.8 | 0.5 | 1.20 | |||||
| 12.8 | 0.4 | 0.70 | |||||
| 12.9 | 0.5 | 0.50 | |||||
| 13.6 | 2.1 | 0.40 | |||||
| 14.5 | 0.3 | 1.00 | |||||
| 15.0 | 1.5 | 0.40 | |||||
| 15.1 | 0.9 | 0.80 | |||||
| 15.5 | 0.3 | 1.30 | |||||
| 15.7 | 0.9 | 0.60 | |||||
| 15.7 | 0.4 | 1.80 | |||||
| 16.1 | 0.8 | 1.20 | |||||
| 16.4 | 0.6 | 0.40 | |||||
| 17.0 | 0.8 | 1.60 | |||||
| 17.1 | 0.4 | 2.50 | |||||
| 17.2 | 0.8 | 2.10 | |||||
| 17.5 | 0.4 | 3.70 | |||||
| 17.7 | 0.3 | 2.90 | |||||
| 17.7 | 1.9 | 0.90 | |||||
| 17.7 | 2.3 | 1.00 | |||||
| 18.3 | 1.3 | 2.20 | |||||
| 18.4 | 1.5 | 3.70 | |||||
| 19.1 | 0.9 | 2.80 | |||||
| 19.3 | 1.5 | 3.30 | |||||
| 19.4 | 1.6 | 0.80 | |||||
| 20.2 | 0.3 | 2.50 | |||||
| 20.2 | 1.2 | 3.20 |
| (km s-1) | (km s-1) | (km s-1) | (mas) | (mas) | (mas) | (mas) | (Jy) |
|---|---|---|---|---|---|---|---|
| 20.7 | 0.4 | 3.50 | |||||
| 20.8 | 0.6 | 3.50 | |||||
| 20.9 | 0.3 | 3.40 | |||||
| 21.1 | 0.3 | 5.20 | |||||
| 21.4 | 0.7 | 2.30 | |||||
| 21.4 | 1.7 | 1.40 | |||||
| 21.6 | 2.9 | 1.60 | |||||
| 21.8 | 1.4 | 1.20 | |||||
| 21.9 | 0.5 | 3.20 | |||||
| 22.6 | 0.3 | 1.30 | |||||
| 22.8 | 0.4 | 0.90 | |||||
| 22.9 | 0.5 | 0.50 | |||||
| 23.1 | 0.3 | 3.00 | |||||
| 23.2 | 0.5 | 0.60 | |||||
| 23.4 | 0.3 | 2.70 | |||||
| 23.5 | 0.5 | 2.30 | |||||
| 23.5 | 0.9 | 1.10 | |||||
| 23.9 | 0.4 | 0.30 | |||||
| 24.2 | 0.5 | 1.40 | |||||
| 24.4 | 0.4 | 1.50 | |||||
| 24.7 | 3.5 | 2.60 | |||||
| 24.8 | 1.7 | 1.40 | |||||
| 24.9 | 1.4 | 1.40 | |||||
| 25.7 | 0.4 | 1.80 | |||||
| 26.4 | 0.8 | 2.30 |
| (km s-1) | (km s-1) | (km s-1) | (mas) | (mas) | (mas) | (mas) | (Jy) |
|---|---|---|---|---|---|---|---|
| 9.8 | 0.8 | 4.30 | |||||
| 10.3 | 0.4 | 0.50 | |||||
| 10.4 | 0.8 | 1.30 | |||||
| 10.4 | 0.4 | 1.60 | |||||
| 11.1 | 0.8 | 1.50 | |||||
| 11.2 | 0.6 | 0.50 | |||||
| 11.3 | 0.4 | 0.80 | |||||
| 11.5 | 3.3 | 0.50 | |||||
| 12.1 | 0.6 | 0.30 | |||||
| 12.5 | 0.6 | 0.70 | |||||
| 12.8 | 0.3 | 0.70 | |||||
| 13.0 | 0.3 | 1.40 | |||||
| 13.4 | 0.7 | 0.70 | |||||
| 13.6 | 2.6 | 0.70 | |||||
| 14.4 | 0.3 | 1.30 | |||||
| 14.8 | 0.8 | 1.10 | |||||
| 15.1 | 2.6 | 2.80 | |||||
| 15.1 | 0.6 | 1.50 | |||||
| 15.2 | 0.5 | 1.10 | |||||
| 15.2 | 2.0 | 0.30 | |||||
| 15.3 | 0.7 | 1.40 | |||||
| 15.6 | 2.0 | 1.90 | |||||
| 16.9 | 0.3 | 2.80 | |||||
| 17.3 | 0.5 | 3.10 | |||||
| 17.4 | 0.6 | 2.90 | |||||
| 17.7 | 0.4 | 2.90 | |||||
| 17.7 | 2.5 | 1.30 | |||||
| 18.1 | 2.0 | 2.80 | |||||
| 19.0 | 0.9 | 2.50 | |||||
| 19.4 | 2.0 | 2.90 | |||||
| 20.0 | 1.7 | 2.40 | |||||
| 20.4 | 0.6 | 3.90 | |||||
| 21.4 | 0.6 | 1.80 | |||||
| 21.6 | 2.9 | 2.50 | |||||
| 22.1 | 1.4 | 2.00 |
| (km s-1) | (km s-1) | (km s-1) | (mas) | (mas) | (mas) | (mas) | (Jy) |
|---|---|---|---|---|---|---|---|
| 22.3 | 0.3 | 2.40 | |||||
| 22.5 | 0.3 | 2.30 | |||||
| 22.8 | 0.3 | 1.40 | |||||
| 22.8 | 0.6 | 4.50 | |||||
| 22.9 | 1.7 | 1.80 | |||||
| 23.3 | 0.8 | 1.20 | |||||
| 23.4 | 0.7 | 1.10 | |||||
| 23.5 | 0.3 | 3.00 | |||||
| 23.6 | 0.3 | 3.00 | |||||
| 23.7 | 0.6 | 1.60 | |||||
| 24.2 | 1.3 | 2.00 | |||||
| 24.3 | 0.3 | 1.60 | |||||
| 24.8 | 3.8 | 1.20 | |||||
| 25.1 | 1.9 | 1.40 | |||||
| 26.0 | 0.5 | 2.80 | |||||
| 26.1 | 0.4 | 1.70 | |||||
| 26.5 | 0.6 | 2.40 |
| (km s-1) | (km s-1) | (km s-1) | (mas) | (mas) | (mas) | (mas) | (Jy) |
|---|---|---|---|---|---|---|---|
| 9.1 | 0.6 | 3.10 | |||||
| 10.2 | 0.3 | 2.30 | |||||
| 10.3 | 1.6 | 2.90 | |||||
| 10.7 | 0.3 | 0.90 | |||||
| 11.1 | 0.4 | 1.40 | |||||
| 11.4 | 3.3 | 0.60 | |||||
| 12.0 | 0.5 | 1.00 | |||||
| 12.0 | 1.4 | 0.50 | |||||
| 12.1 | 0.6 | 1.70 | |||||
| 12.4 | 0.7 | 0.90 | |||||
| 12.5 | 0.3 | 0.40 | |||||
| 12.9 | 0.6 | 0.90 | |||||
| 13.6 | 2.6 | 0.90 | |||||
| 13.8 | 0.5 | 1.10 | |||||
| 15.2 | 2.2 | 0.20 | |||||
| 15.2 | 1.8 | 3.10 | |||||
| 15.2 | 0.4 | 1.70 | |||||
| 15.3 | 1.8 | 1.10 | |||||
| 15.3 | 1.8 | 2.90 | |||||
| 15.4 | 3.5 | 1.20 | |||||
| 17.0 | 0.8 | 2.70 | |||||
| 17.5 | 1.3 | 3.50 | |||||
| 17.8 | 2.7 | 1.00 | |||||
| 18.1 | 0.8 | 3.90 | |||||
| 18.1 | 2.4 | 2.30 | |||||
| 18.7 | 0.3 | 4.40 | |||||
| 19.3 | 0.4 | 2.70 | |||||
| 19.4 | 1.9 | 1.40 | |||||
| 19.7 | 2.7 | 2.30 | |||||
| 19.9 | 0.9 | 2.50 | |||||
| 20.0 | 1.4 | 3.00 | |||||
| 20.6 | 0.9 | 3.20 | |||||
| 21.5 | 0.3 | 1.80 | |||||
| 21.6 | 3.4 | 3.30 | |||||
| 22.1 | 1.1 | 0.80 | |||||
| 22.6 | 0.7 | 1.40 | |||||
| 23.0 | 0.5 | 1.50 | |||||
| 23.0 | 1.6 | 0.70 | |||||
| 23.1 | 0.5 | 3.40 | |||||
| 23.3 | 0.4 | 1.60 | |||||
| 23.4 | 1.3 | 0.60 | |||||
| 23.7 | 0.8 | 1.90 | |||||
| 23.8 | 0.6 | 1.30 |
| (km s-1) | (km s-1) | (km s-1) | (mas) | (mas) | (mas) | (mas) | (Jy) |
|---|---|---|---|---|---|---|---|
| 24.3 | 0.6 | 1.30 | |||||
| 24.3 | 1.6 | 0.70 | |||||
| 24.7 | 0.6 | 1.20 | |||||
| 24.8 | 3.9 | 0.70 | |||||
| 26.1 | 0.3 | 1.40 | |||||
| 26.1 | 0.3 | 2.80 | |||||
| 26.4 | 0.8 | 3.20 |
| (km s-1) | (km s-1) | (km s-1) | (mas) | (mas) | (mas) | (mas) | (Jy) |
|---|---|---|---|---|---|---|---|
| 10.2 | 1.3 | 1.20 | |||||
| 11.4 | 3.5 | 0.60 | |||||
| 12.0 | 1.4 | 0.40 | |||||
| 12.1 | 1.3 | 0.30 | |||||
| 12.7 | 0.9 | 0.40 | |||||
| 12.7 | 0.3 | 1.10 | |||||
| 13.6 | 2.7 | 0.10 | |||||
| 14.7 | 0.5 | 0.60 | |||||
| 15.1 | 2.1 | 0.40 | |||||
| 15.2 | 1.8 | 0.90 | |||||
| 15.3 | 2.3 | 0.10 | |||||
| 15.3 | 1.7 | 1.40 | |||||
| 15.4 | 0.3 | 0.40 | |||||
| 15.7 | 0.3 | 2.20 | |||||
| 15.8 | 0.3 | 3.30 | |||||
| 17.1 | 0.7 | 3.60 | |||||
| 17.1 | 2.1 | 2.30 | |||||
| 17.4 | 1.1 | 2.40 | |||||
| 17.9 | 3.8 | 0.50 | |||||
| 18.1 | 2.5 | 3.20 | |||||
| 18.5 | 0.9 | 3.10 | |||||
| 18.6 | 0.3 | 5.20 | |||||
| 19.3 | 0.3 | 5.20 | |||||
| 19.5 | 2.4 | 3.10 | |||||
| 19.8 | 1.7 | 3.40 | |||||
| 19.8 | 2.7 | 2.30 | |||||
| 20.6 | 0.8 | 4.10 | |||||
| 21.8 | 3.6 | 1.50 | |||||
| 22.1 | 1.2 | 0.80 | |||||
| 22.5 | 0.4 | 1.60 | |||||
| 22.8 | 1.3 | 0.70 | |||||
| 23.1 | 1.1 | 3.40 | |||||
| 23.3 | 0.4 | 1.30 | |||||
| 23.4 | 0.8 | 2.70 | |||||
| 23.4 | 1.7 | 0.70 | |||||
| 23.9 | 0.4 | 1.00 | |||||
| 24.3 | 1.4 | 0.40 | |||||
| 24.5 | 0.4 | 0.60 | |||||
| 24.9 | 3.9 | 0.30 | |||||
| 26.2 | 0.3 | 3.30 | |||||
| 26.4 | 0.8 | 3.00 |
| (km s-1) | (km s-1) | (km s-1) | (mas) | (mas) | (mas) | (mas) | (Jy) |
|---|---|---|---|---|---|---|---|
| 9.1 | 0.4 | 3.90 | |||||
| 10.2 | 1.3 | 1.10 | |||||
| 10.5 | 0.3 | 1.10 | |||||
| 11.3 | 3.4 | 3.00 | |||||
| 12.0 | 0.9 | 0.50 | |||||
| 12.1 | 1.4 | 0.70 |
| (km s-1) | (km s-1) | (km s-1) | (mas) | (mas) | (mas) | (mas) | (Jy) |
|---|---|---|---|---|---|---|---|
| 12.2 | 1.2 | 0.60 | |||||
| 12.6 | 0.3 | 0.80 | |||||
| 12.7 | 1.2 | 0.60 | |||||
| 13.7 | 2.5 | 0.20 | |||||
| 14.7 | 0.6 | 0.90 | |||||
| 15.0 | 0.3 | 5.90 | |||||
| 15.1 | 1.9 | 0.20 | |||||
| 15.2 | 1.7 | 2.50 | |||||
| 15.3 | 0.7 | 1.40 | |||||
| 15.3 | 1.9 | 1.80 | |||||
| 15.5 | 2.1 | 0.10 | |||||
| 17.1 | 0.9 | 1.80 | |||||
| 17.1 | 2.8 | 3.10 | |||||
| 17.1 | 0.7 | 3.20 | |||||
| 17.5 | 1.7 | 2.70 | |||||
| 17.9 | 3.5 | 0.50 | |||||
| 18.3 | 1.4 | 1.10 | |||||
| 18.9 | 0.4 | 4.90 | |||||
| 19.3 | 1.2 | 4.50 | |||||
| 19.4 | 2.2 | 4.60 | |||||
| 19.7 | 0.3 | 5.70 | |||||
| 19.8 | 2.9 | 2.80 | |||||
| 19.8 | 1.7 | 5.10 | |||||
| 19.9 | 0.3 | 5.00 | |||||
| 20.4 | 0.6 | 3.30 | |||||
| 20.5 | 0.8 | 3.40 | |||||
| 20.9 | 0.3 | 4.40 | |||||
| 21.2 | 0.4 | 2.70 | |||||
| 21.5 | 0.3 | 1.80 | |||||
| 21.7 | 2.7 | 3.20 | |||||
| 22.6 | 0.5 | 3.50 | |||||
| 22.7 | 0.7 | 1.60 | |||||
| 22.7 | 0.3 | 3.90 | |||||
| 22.8 | 1.2 | 0.70 | |||||
| 22.9 | 0.4 | 3.70 | |||||
| 23.1 | 0.7 | 4.10 | |||||
| 23.2 | 1.2 | 0.40 | |||||
| 23.2 | 0.5 | 1.60 | |||||
| 23.8 | 0.3 | 0.50 | |||||
| 23.9 | 0.4 | 1.60 | |||||
| 24.0 | 0.5 | 1.40 | |||||
| 24.2 | 1.4 | 0.60 | |||||
| 24.9 | 0.8 | 0.70 | |||||
| 24.9 | 5.2 | 0.70 | |||||
| 26.4 | 0.8 | 3.10 |
| (km s-1) | (km s-1) | (km s-1) | (mas) | (mas) | (mas) | (mas) | (Jy) |
|---|---|---|---|---|---|---|---|
| 10.2 | 1.3 | 3.10 | |||||
| 11.3 | 3.0 | 2.30 | |||||
| 12.1 | 1.2 | 0.40 | |||||
| 12.1 | 1.3 | 1.30 | |||||
| 12.2 | 0.5 | 1.80 | |||||
| 12.6 | 0.7 | 1.30 | |||||
| 13.1 | 0.6 | 1.40 | |||||
| 13.7 | 2.5 | 1.30 | |||||
| 14.4 | 0.8 | 1.10 | |||||
| 14.6 | 0.3 | 2.70 | |||||
| 14.7 | 0.9 | 0.80 | |||||
| 14.8 | 0.3 | 2.80 | |||||
| 14.9 | 0.4 | 1.20 | |||||
| 15.3 | 0.4 | 1.30 | |||||
| 15.3 | 1.6 | 2.30 |
| (km s-1) | (km s-1) | (km s-1) | (mas) | (mas) | (mas) | (mas) | (Jy) |
|---|---|---|---|---|---|---|---|
| 15.6 | 1.1 | 2.60 | |||||
| 15.7 | 2.2 | 0.20 | |||||
| 15.8 | 0.4 | 3.30 | |||||
| 17.1 | 1.5 | 3.20 | |||||
| 17.9 | 3.3 | 1.40 | |||||
| 18.3 | 1.3 | 4.40 | |||||
| 18.3 | 1.0 | 2.70 | |||||
| 18.8 | 0.4 | 4.40 | |||||
| 19.4 | 1.2 | 2.30 | |||||
| 19.8 | 1.2 | 3.40 | |||||
| 19.9 | 2.0 | 3.70 | |||||
| 20.4 | 0.3 | 5.00 | |||||
| 21.7 | 0.5 | 1.70 | |||||
| 21.8 | 2.9 | 2.60 | |||||
| 22.4 | 0.7 | 1.40 | |||||
| 22.5 | 0.3 | 2.50 | |||||
| 22.8 | 0.9 | 1.80 | |||||
| 22.8 | 0.3 | 3.60 | |||||
| 23.2 | 0.9 | 0.60 | |||||
| 23.7 | 0.5 | 1.70 | |||||
| 24.2 | 1.1 | 0.40 | |||||
| 24.6 | 2.3 | 1.00 | |||||
| 24.9 | 3.6 | 0.70 |
| (km s-1) | (km s-1) | (km s-1) | (mas) | (mas) | (mas) | (mas) | (Jy) |
|---|---|---|---|---|---|---|---|
| 37.0 | 1.9 | 12.85 | |||||
| 37.3 | 0.5 | 10.20 | |||||
| 37.3 | 0.5 | 14.43 | |||||
| 37.8 | 0.4 | 2.95 | |||||
| 38.2 | 0.7 | 16.34 | |||||
| 38.5 | 0.6 | 37.15 | |||||
| 38.7 | 0.9 | 8.41 | |||||
| 38.8 | 2.0 | 54.10 | |||||
| 39.3 | 1.4 | 13.97 | |||||
| 39.3 | 0.4 | 11.48 | |||||
| 39.4 | 1.3 | 14.57 | |||||
| 39.4 | 0.8 | 13.39 | |||||
| 39.4 | 0.7 | 4.48 | |||||
| 39.8 | 0.8 | 24.99 | |||||
| 39.9 | 0.6 | 9.66 | |||||
| 40.0 | 1.1 | 15.89 | |||||
| 40.0 | 0.9 | 39.69 | |||||
| 40.0 | 0.5 | 16.05 | |||||
| 40.2 | 0.8 | 8.96 | |||||
| 40.6 | 2.6 | 20.98 | |||||
| 40.6 | 2.0 | 17.94 | |||||
| 40.6 | 1.1 | 7.90 | |||||
| 40.7 | 0.5 | 10.43 | |||||
| 40.8 | 0.5 | 8.42 | |||||
| 41.0 | 1.3 | 8.67 | |||||
| 41.1 | 0.6 | 7.35 | |||||
| 41.1 | 0.6 | 9.78 | |||||
| 41.5 | 0.5 | 18.70 | |||||
| 41.9 | 0.6 | 11.42 |
| (km s-1) | (km s-1) | (km s-1) | (mas) | (mas) | (mas) | (mas) | (Jy) |
|---|---|---|---|---|---|---|---|
| 38.7 | 0.6 | 14.04 | |||||
| 39.7 | 1.8 | 20.24 | |||||
| 39.7 | 0.4 | 20.87 | |||||
| 39.8 | 2.0 | 18.03 | |||||
| 39.9 | 1.7 | 6.78 | |||||
| 40.0 | 0.4 | 6.09 | |||||
| 40.1 | 0.8 | 4.81 | |||||
| 40.2 | 1.5 | 2.51 | |||||
| 40.6 | 1.4 | 10.10 | |||||
| 40.6 | 0.8 | 4.14 | |||||
| 40.9 | 0.7 | 35.69 | |||||
| 41.2 | 0.9 | 13.54 | |||||
| 41.5 | 0.6 | 3.50 | |||||
| 41.6 | 0.5 | 13.71 | |||||
| 41.7 | 1.1 | 2.62 | |||||
| 43.5 | 0.5 | 3.59 | |||||
| 43.8 | 0.8 | 8.66 | |||||
| 45.2 | 2.3 | 30.25 |
| (km s-1) | (km s-1) | (km s-1) | (mas) | (mas) | (mas) | (mas) | (Jy) |
|---|---|---|---|---|---|---|---|
| 38.1 | 0.5 | 8.67 | |||||
| 38.5 | 2.3 | 4.95 | |||||
| 39.0 | 0.5 | 6.91 | |||||
| 39.0 | 0.8 | 11.64 | |||||
| 39.5 | 1.1 | 9.96 | |||||
| 39.5 | 0.8 | 21.46 | |||||
| 39.6 | 0.4 | 38.73 | |||||
| 40.0 | 2.1 | 13.11 | |||||
| 40.1 | 0.6 | 46.49 | |||||
| 40.4 | 1.1 | 22.13 | |||||
| 40.4 | 1.3 | 6.99 | |||||
| 40.5 | 1.5 | 14.03 | |||||
| 40.5 | 0.5 | 6.92 | |||||
| 40.9 | 0.9 | 8.25 | |||||
| 41.0 | 1.4 | 33.41 | |||||
| 41.3 | 0.8 | 8.65 | |||||
| 41.4 | 0.4 | 11.39 | |||||
| 42.1 | 1.1 | 2.32 |
| (km s-1) | (km s-1) | (km s-1) | (mas) | (mas) | (mas) | (mas) | (Jy) |
|---|---|---|---|---|---|---|---|
| 38.4 | 1.2 | 9.71 | |||||
| 39.9 | 0.7 | 9.14 | |||||
| 40.2 | 0.7 | 20.18 | |||||
| 40.4 | 2.4 | 11.63 | |||||
| 40.5 | 0.4 | 36.24 | |||||
| 40.5 | 1.4 | 4.38 | |||||
| 40.5 | 0.6 | 6.48 | |||||
| 40.6 | 1.1 | 32.55 | |||||
| 40.6 | 0.4 | 3.29 | |||||
| 40.8 | 1.2 | 19.29 | |||||
| 40.9 | 0.4 | 2.89 | |||||
| 41.0 | 1.1 | 9.32 | |||||
| 41.4 | 0.7 | 27.16 | |||||
| 41.6 | 0.4 | 4.18 | |||||
| 41.7 | 0.7 | 11.74 | |||||
| 42.0 | 2.2 | 17.72 |