11email: bzhang@mpifr.de 22institutetext: Shanghai Astronomical Observatory, Chinese Academy of Sciences, 80 Nandan Road, Shanghai 200030, China 33institutetext: Harvard-Smithsonian Center for Astrophysics, 60 Garden Street, Cambridge, MA 02138, USA 44institutetext: Department of Astronomy, Nanjing University, 22 Hankou Road, Nanjing 210093, China 55institutetext: National Radio Astronomy Observatory, Socorro, NM 87801, USA
The Distance and Size of the Red Hypergiant NML Cyg from VLBA and VLA Astrometry
Abstract
Context. The red hypergiant NML Cyg has been assumed to be at part of the Cyg OB2 association, although its distance has never been measured directly. A reliable distance is crucial to study the properties of this prominent star. For example, its luminosity, and hence its position on the H-R diagram, is critical information to determine its evolutionary status. In addition, a detection of the radio photosphere would be complementary to other methods of determining the stellar size.
Aims. We aim to understand the characteristics of NML Cyg with direct measurements of its absolute position, distance, kinematics, and size.
Methods. We observe circumstellar 22 GHz H2O and 43 GHz SiO masers with the Very Long Baseline Array to determine the parallax and proper motion of NML Cyg. We observe continuum emission at 43 GHz from the radio photosphere of NML Cyg with the Very Large Array.
Results. We measure the annual parallax of NML Cyg to be 0.620 0.047 mas, corresponding to a distance of kpc. The measured proper motion of NML Cyg is = mas yr-1 eastward and = mas yr-1 northward. Both the distance and proper motion are consistent with that of Cyg OB2, within their joint uncertainty, confirming their association. Taking into consideration molecular absorption signatures seen toward NML Cyg, we suggest that NML Cyg lies on the far side of the Cyg OB2 association. The stellar luminosity revised with our distance brings NML Cyg significantly below the empirical luminosity limit for a red supergiant. We partially resolve the radio photosphere of NML Cyg at 43 GHz and find its diameter is about 44 mas, suggesting an optical stellar diameter of 22 mas, if the size of radio photosphere is 2 times the optical photosphere. Based on the position of circumstellar SiO masers relative to the radio photosphere, we estimate the absolute position of NML Cyg at epoch 2008.868 to be = 20h46m255382 00010, = 40∘06′59379 0015. The peculiar motions of NML Cyg, the average of stars in Cyg OB2, and four other star-forming regions rules out that an expanding “Strömgren sphere” centered on Cyg OB2 is responsible for the kinematics of the Cygnus X region.
Key Words.:
astrometry — masers — parallaxes — proper motions — stars: individual (NML Cyg) — supergiants1 Introduction
NML Cyg is one of the most massive and luminous red hypergiants. It is a semi-regular star with period 1000 days (Denisenkova et al., 1988; Monnier et al., 1997) and has been suggested to be associated with Cyg OB2, possibly the largest stellar association in the Galaxy (Habing et al., 1982; Morris & Jura, 1983). Previous distance estimates for NML Cyg have been mainly based on the assumption that it is at the distance with Cyg OB2. Even so, the distance to Cyg OB2 is hard to determine accurately by photometry and spectroscopy, due to difficulty in calibrating spectral types and luminosities. Previous investigators have derived distance moduli of 10.8 – 11.6 (Johnson & Morgan, 1954; Reddish et al., 1966; Walborn, 1973; Abbott et al., 1981; Torres-Dodgen et al., 1991; Massey & Thompson, 1991; Hanson, 2003; Kharchenko et al., 2005), corresponding to distances of 1.45 – 2.10 kpc to Cyg OB2. These values are marginally different from kpc to NML Cyg determined by Danchi et al. (2001), based on the comparison of Doppler velocities and proper motions of two discrete dust shells around NML Cyg measured with interferometry at 11 m over a period about 6 yr.
Adopting a distance of 1.74 0.2 kpc (Massey & Thompson, 1991), Schuster et al. (2009) estimated NML Cyg’s minimum bolometric luminosity to be , which is similar to that of other red hypergiants and places it near the empirical upper-luminosity boundary in the Hertzsprung-Russell (H-R) diagram (Schuster et al., 2006). However, the estimated luminosity of a star depends on the square of its distance. Thus, an accurate distance is crucial to derive a reliable luminosity and the location on the H-R diagram. Recently, trigonometric parallaxes of circumstellar maser sources (H2O or SiO) surrounding red hypergiants with VLBI phase-referencing have been measured with accuracies of 20 – 80 as (Choi et al., 2008; Zhang et al., 2012; Asaki et al., 2010). We carried out a program to measure the trigonometric parallax and proper motion of masers in the circumstellar envelope (CSE) of NML Cyg with the National Radio Astronomical Observatory’s111The national Radio Astronomy Observatory is a facility of the National Science Foundation operated under cooperative agreement by Associated Universities, Inc (NRAO’s) Very Long Baseline Array (VLBA).
In addition to distance, another fundamental stellar parameter is size. NML Cyg’s high mass-loss rate results in a dense circumstellar envelope, and the star is faint and hard to observe at visual wavelengths due to high extinction. However, it is extremely luminous in the infrared. Ridgway et al. (1986) used infrared speckle interferometric observations of NML Cyg and a simple model of multiple shells to derive an inner radius for its dust shell of 45 12 mas. They also obtained the star’s effective temperature, 3250 K, which is appropriate for an M6 III star (Johnson, 1967). Monnier et al. (1997) conducted infrared interferometry at 11.15 m, yielding evidence for multiple dust shells and asymmetric dust emission around NML Cyg. They obtained better fits to all data by assuming a 2500 K, using a model (Rowan-Robinson & Harris, 1983). Blöcker et al. (2001) presented diffraction-limited 2.13 m observations with 73 mas resolution and obtained a bolometric flux of W m-2, corresponding to a stellar luminosity of = . Using the spectral energy distribution (SED) from 2 to 50 m, they derived a stellar diameter of 16.2 mas assuming = 2500 K. Clearly, a direct detection of the star would be complementary to the methods mentioned above. Radio continuum emission from the evolved star’s photosphere can be imaged with the Very Large Array (VLA), using H2O or SiO masers as a phase reference (Reid & Menten, 1990, 1997, 2007; Zhang et al., 2012). Such observations allow us to directly measure the size of NML Cyg’s radio photosphere and, using the observed flux density and our measured distance, its effective temperature.
2 Observations and data reduction
2.1 VLBA phase-referencing observations
We conducted VLBI phase-referencing observations of NML Cyg at 22 and 43 GHz with the VLBA under program BZ036 with 7-hour tracks on 2008 May 25, August 13 and November 8, and 2009 January 27 and May 3. This sequence samples the peaks of the sinusoidal trigonometric parallax curve and has low correlation coefficients among the parallax and proper motion parameters. We observed several extragalactic radio sources as potential background references for parallax solutions. We alternated between two 16 min blocks at 22 and 43 GHz. Within a block, the observing sequence was NML Cyg, J20523635, NML Cyg, J20444005, NML Cyg, J20464106, NML Cyg, J20494118. We switched between the maser target and background sources every 40 s for 22 GHz and 30 s for 43 GHz, typically achieving 30 s for 22 GHz and 20 s for 43 GHz of on-source data.
We placed observations of two strong sources 3C345 (J1642+3948) and 3C454.3 (J2253+1608) near the beginning, middle, and end of the observations in order to monitor delay and electronic phase differences among the intermediate-frequency bands. The rapid-switching observations employed four adjacent bands of 8 MHz bandwidth and recorded both right and left circularly polarized signals. The H2O and SiO masers were contained in the second band centered at a Local Standard of Rest (LSR) velocity of 7 km s-1. In order to do atmospheric delay calibration, we placed “geodetic” blocks before and after our phase-reference observations. These data were taken in left circular polarization with eight 8 MHz bands that spanned 480 MHz of bandwidth between 22.0 and 22.5 GHz; the bands were spaced in a “minimum redundancy configuration” to uniformly sample, as best as possible, all frequency differences.
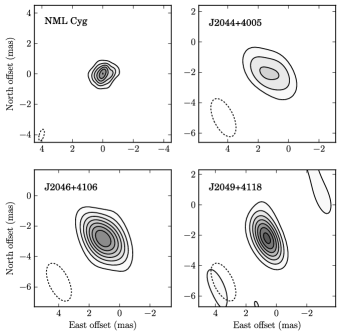
The data were correlated in two passes with the VLBA correlator in Socorro, NM. One pass generated 16 spectral channels for all the data and a second pass generated 256 spectral channels, but only for the single (dual-polarized) frequency band containing the maser signals, giving a velocity resolution of 0.42 km s-1 for 22 GHz and 0.21 km s-1 for 43 GHz, respectively. Generally, the data calibration was performed with the NRAO Astronomical Image Processing System (AIPS), following similar procedures as described in Reid et al. (2009a). We used an H2O maser spot at a of 5.22 km s-1 and a SiO maser spot at a of km s-1 as phase-reference sources, because they are considerable stronger than the background source and could be detected on individual baselines in the available on-source time. We imaged the calibrated data with the AIPS task IMAGR; Fig. 1 shows example images at 22 GHz from the middle epoch. Table 1 lists the positions, intensities, source separations, LSR velocity of the reference maser spot and synthesized beam sizes.
| Source | R.A. (J2000) | Dec. (J2000) | P.A. | Beam | |||
|---|---|---|---|---|---|---|---|
| (h m s) | (° ′ ″) | (Jy/beam) | (°) | (°) | (km s-1) | (mas mas °) | |
| (1) | (2) | (3) | (4) | (5) | (6) | (7) | (8) |
| 22 GHz | |||||||
| NML Cyg……. | 20 46 25.5444 | 40 06 59.383 | 16 77 | … | … | 5.22 | 0.6 0.3 @ 08 |
| J20523635…. | 20 52 52.0550 | 36 35 35.300 | 0.050 | 3.7 | 19 | … | 2.7 1.4 @ 31 |
| J20444005…. | 20 44 11.0877 | 40 05 36.360 | 0.005 | 0.4 | 87 | … | 2.7 1.3 @ 25 |
| J20464106…. | 20 46 21.8414 | 41 06 01.107 | 0.014 | 1.0 | 01 | … | 2.7 1.2 @ 24 |
| J20494118…. | 20 49 43.9548 | 41 18 14.583 | 0.011 | 1.3 | 28 | … | 2.7 1.2 @ 26 |
| 43 GHz | |||||||
| NML Cyg……. | 20 46 25.5378 | 40 06 59.413 | 3.4 | … | … | 0.3 0.1 @ 07 | |
| J20464106…. | 20 46 21.8414 | 41 06 01.107 | 0.017 | 1.0 | 01 | … | 0.7 0.4 @ 25 |
2.2 VLA observation for radio photosphere
In addition to the VLBA observations, we carried out an observation of the radio photosphere and maser emission toward NML Cyg at 43 GHz with the VLA in its largest (A) configuration under program AZ178 on 2008 December 20. We used a dual intermediate frequency band setup in continuum mode with a narrow (3.125 MHz) band centered at of km s-1 for the SiO maser line (rest frequency of 43122.027 MHz) and a broad (50 MHz) band centered MHz above in a line-free portion of the spectrum. Additionaly, we observed the SiO maser emission in two sub-bands centered at of and km s-1 at high spectral resolution (channel spacing of 97.6563 kHz and bandwidth of 6.25 MHz) with several scans in spectral-line mode interspersed among the dual-band continuum observations. We also observed H2O maser emission (rest frequency of 22235.080 MHz) centered at of 5 km s-1 with a channel spacing of 48.8281 kHz and bandwidth of 6.25 MHz in a snapshot mode.
A typical observing unit for our continuum observations consisted of a minute NML Cyg scan, followed by a 5 minute scan of, alternately, the quasar J2015+3710 and J2012+4628. For a spectral-line observation, we observed a calibrator for about 3 minutes and NML Cyg for 5 minutes. Absolute flux density calibration was established by an observation of 3C286 (J1331+3030), assuming a flux density of 1.554 Jy at 43 GHz and 2.540 Jy at 22 GHz. Data calibration procedures are described in detail in Reid & Menten (1997, 2007).
3 Results
3.1 Maser spectrum and spatial distribution
Figure 2 shows scalar averaged cross-power spectra of H2O maser emission observed using only the inner 5 antennae of the VLBA at all five epochs. The H2O maser emission spans a range from about 25 to 17 km s-1, which is consistent with previous observations (Richards et al., 1996; Nagayama et al., 2008). One can see that the flux densities of some maser features varied considerably from epoch to epoch within about 1.0 yr, while the peaks of blue-shifted ( = 22.17 km s-1) and red-shifted ( = 5.22 km s-1) features appear more stable. We confirmed that the brightest and most blue-shifted component appears to exhibit a velocity drift, the LSR velocities of this component in 1981, 1993, 2006 and 2008-2009 (this paper) were 18, 20, 21.8 and 22.2 km s-1, the resulting acceleration is consistent with that derived by Shintani et al. (2008).
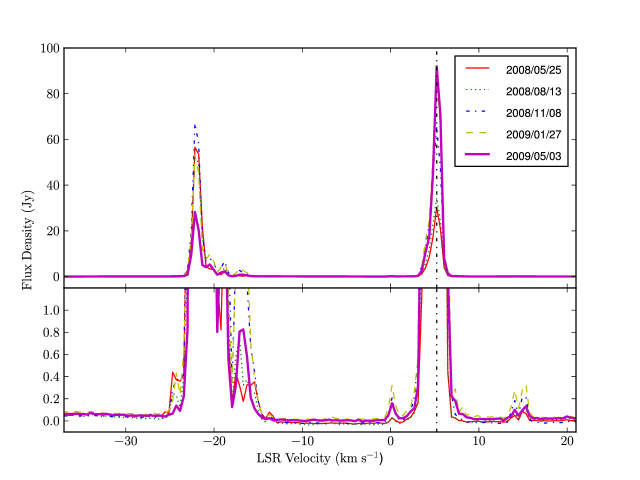
(A color version of this figure is available in the online journal.)
(A color version of this figure is available in the online journal.)
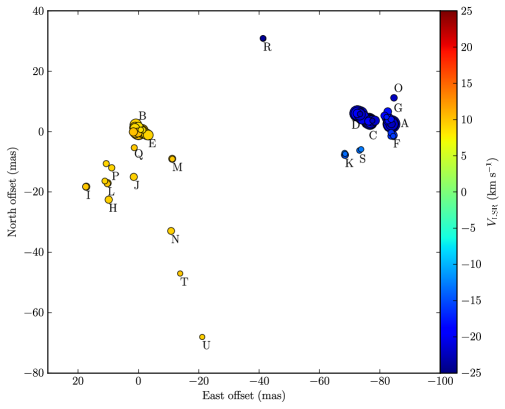
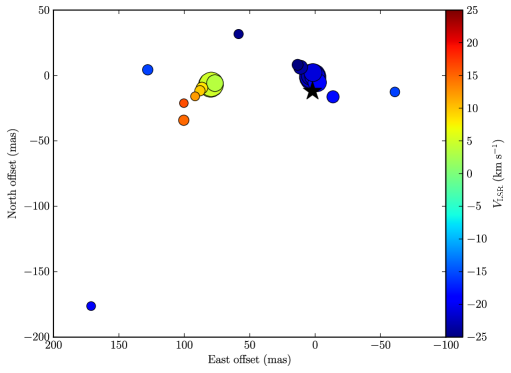
Figure 3 shows the spatial distribution of H2O maser emission toward NML Cyg relative to the reference maser spot at = 5.22 km s-1 from observations at five epochs. We considered maser spots at different epochs as being from the same feature if their positions in the same spectral channel were coincident within mas (where = 3 mas yr-1 yr, and is the time gap between two epochs), corresponding to a linear motion of less than 23 km s-1. Selecting the bright maser spots with flux density 0.5 Jy beam-1 and SNR 10 in each channel, we found 21 features that were detected at one or more epochs.
The total extent of the H2O maser spot distribution is about 120 mas, which is consistent with previous studies from VLBI observations (Marvel, 1996; Nagayama et al., 2008). Our first epoch observation took place about 1 yr later than the last epoch in Nagayama et al. (2008), and we found that the most red-shifted maser cluster (including features B and E) and the most blue shifted maser cluster (including features D and C) in Fig. 3 are consistent with features at about 6 and km s-1 in Nagayama et al. (2008), respectively. These two dominant maser clusters are about 70 mas apart. This suggests that even though the spatial distribution changes in details, the maser features at the near the distribution of the masers in the two peaks remains relatively stable.
Richards et al. (1996) reported an irregular ring of emission mas across and a pair of outlying features to the north-west (NW) and south-east (SE), nearly 600 mas apart, based on MERLIN observations (Yates & Cohen, 1994; Richards et al., 1996) and VLA observations (Johnston et al., 1985). The prominent maser features in the irregular ring are consistent with the features at about 5 and km s-1 reported in this paper. However, the NW and SE maser features were not detected in our VLBA nor in previous VLBI observations (Marvel, 1996; Nagayama et al., 2008). For our VLBI observations, typical diameters of the H2O maser spots are 1 mas and the detected limitation is 10 mJy. This corresponds to a brightness temperature lower limit of K. However, the brightness temperatures for the two outlying features reported by Richards et al. (1996) are K. This might be the reason why the outlying features were not detected with VLBI observations.
(A color version of this figure is available in the online journal.)
Unlike the H2O maser, the SiO maser emission toward NML Cyg during our observation was very weak, and phase referencing with the maser succeeded only at the last epoch. Because we could register H2O and SiO masers to the same background sources, the relative position between the reference maser spots for two maser species should be accurate to mas (see Fig. 4). The brightest SiO maser features detected in our observations are at about and 11.03 km s-1. This differs from the VLBA observation of the same SiO maser emission by Boboltz & Marvel (2000). The extent of the maser distribution is about 30 mas and is consistent with the diameter of the ring-like distribution from about 10 yr earlier. ¿From a VLA observation of SiO maser emission, Boboltz & Claussen (2004) reported a radius of 50 mas for the maser distribution, which is consistent with the inner boundary for the dust shell at 2.13 m (Blöcker et al., 2001).
3.2 Parallax and proper motion
We fitted elliptical Gaussian brightness distributions to the images of strong maser spots and the extragalactic radio sources for all five epochs. The change in position of each maser spot relative to each background radio source was modeled by the parallax sinusoid in both coordinates (determined by a single parameter, the star’s parallax) and a linear proper motion in each coordinate. The extragalactic source with the best known position, J20523635, was relatively far (3.7∘) from NML Cyg, and it was only used to determine the absolute position of the maser reference spot. We used the other three calibrators, which are separated by less than 1.5∘ from NML Cyg, to determine the parallax.
As mentioned in Zhang et al. (2012), the apparent motions of the maser spots can be complicated by a combination of spectral blending and changes in intensity. Thus, for parallax fitting, one needs to find stable, unblended spots and/or use many maser spots to average out these effects. Thus, we first fitted a parallax and proper motion to the position offsets for each H2O maser spot relative to each background source separately. In Fig. 5, we plot the position of the maser spot at = 6.48 km s-1 (the first maser spot listed in Table LABEL:tab:para_pm) relative to the three background radio sources as an example, with superposed curves representing a model that uses a combined estimate for the parallax and proper motion as described below. This is one of the most red-shifted compact and unblended spots that was detectable at all five epochs.
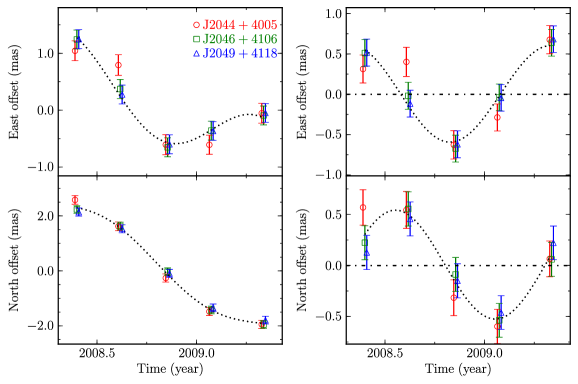
(A color version of this figure is available in the online journal.)
Table LABEL:tab:para_pm shows the independently estimated parallaxes and proper motions for each maser spot and extragalactic source pair. While the parallaxes should be identical within measurement uncertainties, the proper motions are expected to vary among maser spots owing to internal motions of km s-1 ( mas yr-1 at a distance of 1.6 kpc). While most of the maser spot parallaxes show good internal consistency, the dispersion of parallax estimates over the entire ensemble is considerably larger than the formal errors would suggest. This is caused by residual systematic errors affecting the fits, which originate in the complexity and evolution of blended spectral and spatial structure for some of the masers.
Among these independent solutions, we found the parallaxes associated with maser spot at = km s-1 had the largest relative uncertainties of 200 as. The spots in this feature are likely affected by line blended, and we discarded the data for this feature. We used all remaining position data in a combined solution, which used a single parallax parameter for all maser spots and extragalactic source pairs (but allowed for different proper motions for different maser spots).
The combined parallax estimate is mas, corresponding to a distance of kpc, placing NML Cyg possibly in a Local (Orion) arm. The quoted uncertainty is the formal error multiplied by (where is the number of maser spots used in the final parallax fit) to allow for the possibility of correlated position variations for all the maser spots. This could result from small variations in the background source or from un-modeled atmospheric delays, both of which would affect the maser spots nearly identically (Reid et al., 2009a). The un-weighted average absolute proper motion of all selected maser spots is = mas yr-1 and = mas yr-1, where = and = .
Combining the parallax and proper motion measurements with the systemic of km s-1 (Kemper et al., 2003; Etoka & Diamond, 2004) enable us to determine the three-dimensional peculiar motion (relative to circular motion around the Galactic center) of NML Cyg. Adopting a flat rotation curve for the Milky Way with rotation speed of LSR = km s-1, distance to the Galactic center of = kpc (Brunthaler et al., 2011), and the solar motion of (=, =, =) km s-1 from Hipparcos measurement revised by Schönrich et al. (2010), we estimate a peculiar motion for NML Cyg of (=, =, =) km s-1, where , , are directed toward the Galactic center, in the direction of Galactic rotation and toward the North Galactic Pole (NGP), respectively. Thus, NML Cyg is orbiting the Galaxy slower than expected from a circular orbit for a flat rotation curve, similarly to the average of many massive star forming regions found by Reid et al. (2009b). The peculiar velocity components toward the Galactic center and the NGP are relatively small with somewhat larger uncertainties.
3.3 Radio photosphere and circumstellar maser emission from VLA observation
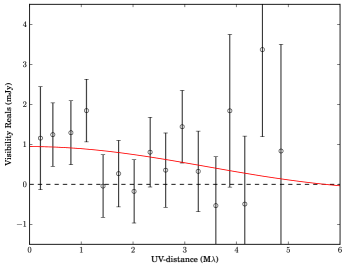
We detected the radio photosphere of NML Cyg at 43 GHz and made a uniformly weighted image (see Fig. 7). We also fitted a model of an uniformly bright disk to the -data directly using the AIPS task OMFIT, obtained a diameter of mas and integrated flux density of mJy. We binned the data and plotted the real part of the visibility versus baseline length in Fig. 6.
Taking the crude characteristics of the radio photosphere to be , and , which are inferred from the imaging of variable stars by Reid & Menten (1997) (where and are the radii of the radio and optical photospheres, respectively, and and are the effective temperatures of the radio and optical photospheres), the semi-diameter of radio photosphere, 22 mas, is reasonably consistent with that of 16.2 mas derived by Blöcker et al. (2001).
(A color version of this figure is available in the online journal.)
(A color version of this figure is available in the online journal.)
(A color version of this figure is available in the online journal.)
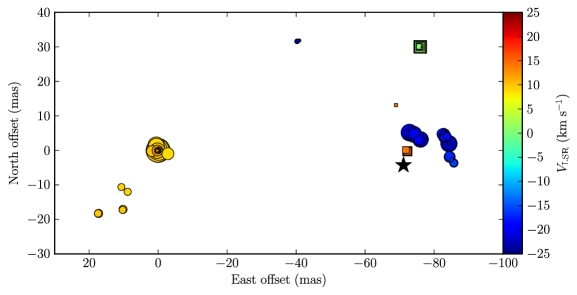
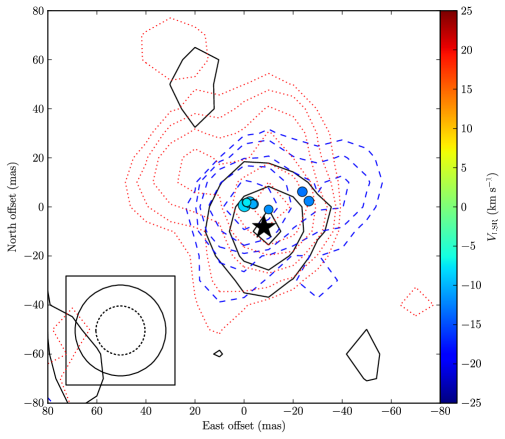
In order to register the SiO masers relative to the radio photosphere, we first measured the position of the radio photosphere from the broad-band data relative the maser emission from the narrow-band data. Next, we aligned the maser emission from the spectral-line data by producing a map of pseudo-continuum data by integrating the line data over the entire narrow-band. Because the narrow-band and the pseudo-continuum data cover the maser emission from the same velocity range, we can align them by comparing the positions of peaks in each map. This allows the positions of the emission in individual channels to be registered to the map of narrow-band data, and then to the radio photosphere. We estimated a position offset of the weak continuum source (radio photosphere) relative to the reference maser spot to be ( = , = ) mas with an uncertainty of 3 mas. Fig. 7 shows the relative positions of the SiO maser and 43 GHz continuum emission used to register the images.
The relative offsets of the peaks of SiO maser emission and the central star agree well with observations of Mira variable stars (Reid & Menten, 2007), which show the SiO maser emission surrounds the central star in a partial ring with radii of 2 – 3 . For NML Cyg the SiO radius is also consistent with the dust inner-radius of 45 mas (Ridgway et al., 1986).
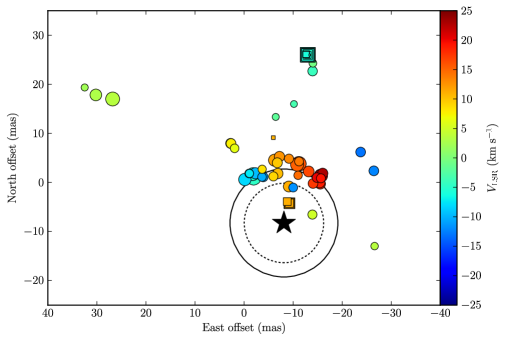
In order to estimate the absolute position of the radio photosphere (which should be that of the central star), we have to align the SiO maser spots measured with the VLA with those from the VLBA observations. As discussed in Zhang et al. (2012), if a single spectral channel contains emission from across the source, the VLA position would be falsely interpreted as being near the center of the distribution. Furthermore, the VLBA observing date of SiO emission is about five months later than that of VLA. So, there is no guarantee that the VLA and VLBA maps should be identical. However, we found that the two maser clusters at about 11 and km s-1 in the VLBA map are in good agreement with those at similar values in the VLA map, after shifted the VLBA map ( = , = 26) mas, with an uncertainty of mas. Thus, we can register the radio photosphere to the VLBA SiO maser spots with a conservative uncertainty of 10 mas (see Fig. 8).
The absolute position of the reference SiO maser spot can be estimated relative to the extragalactic sources, yielding the absolute stellar position of NML Cyg at epoch 2008.868 of = 20h46m255382 00010, = 40∘06′59379 0015. The absolute position is consistent with, but considerably more accurate than, that from the Two Micron All Sky Survey (2MASS) by Skrutskie et al. (2006) (after converting to J2000 coordinates and accounting for our measured absolute proper motion); differences of 39 mas in right ascension and 10 mas in declination are well within the 170 mas uncertainty of the 2MASS position.
Fig. 9 shows the H2O maser distribution from our VLA observation. Similar to the map as shown in Fig. 3, the maser distribution is dominated by two maser clusters with a separation of 70 mas. However, the total extent of the maser distribution is much larger than that of VLBA map. The outlying maser spot to the south-east in the VLA map is likely associated with a feature reported by Richards et al. (1996).
4 Discussion
4.1 Relation to the Cyg region and OB association
Habing et al. (1982) observed a H ii region located northwest of NML Cyg, and Morris & Jura (1983) suggested that it represented a portion of NML Cyg’s circumstellar envelope photoionized by the luminous and hot stars in the Cyg OB2 association. Cyg OB2 lies near the center of the X-ray emitting Cygnus X super bubble, which is composed of numerous individual H ii regions, a number of Wolf-Rayet and O3 stars and several OB associations.
Recently, Rygl et al. (2012) reported distances from trigonometric parallax measurements of four 6.7 GHz methanol maser sources in the Cygnus X region that are consistent with kpc for this region (see Fig. 11). This is similar to the distance of 1.45 kpc to Cyg OB2 obtained by Hanson (2003), based on fitting 35 dwarf cluster members with spectral types between O7.5 and B1 to a yr isochrone, and also consistent with latest estimated photometric distance of 1.5 kpc determined by Kharchenko et al. (2005), although slightly smaller than previous work quoting 1.74 kpc (Massey & Thompson, 1991).
Given that the Cygnus X region contains huge amounts of dust, one might expect that this dust would extinguish the optical light from Cyg OB2. However, little extinction toward Cyg OB2 was found from the NIR extinction map of the region (Motte et al., 2007). We also note that the interstellar medium (ISM) absorption signatures from NML Cyg, seen in Herschel spectra of the H2O ortho () and para ground-state () line (Teyssier et al., in prep.) and low CO transitions (Kemper et al., 2003), suggest that they arise from a cold gas component. One possible explanation is that the diffuse gas in Cygnus X is located in front of NML Cyg. Taking our distance of kpc to NML Cyg, we offer new observational evidence that NML Cyg might be associated with Cyg OB2.
|
|
|
|
|
|
|
||||||||||||||||||||
|---|---|---|---|---|---|---|---|---|---|---|---|---|---|---|---|---|---|---|---|---|---|---|---|---|---|---|
| NML Cyg | 1610 120 | |||||||||||||||||||||||||
| Cyg OB2 | 2.7 | 1500 | ||||||||||||||||||||||||
| VY CMa | 1200 120 | |||||||||||||||||||||||||
| NGC2362 | 1.3 | 1389 | ||||||||||||||||||||||||
| S Per | 2400 100 | |||||||||||||||||||||||||
| h Per | 1.5 | 2079 | ||||||||||||||||||||||||
| Per | 1.5 | 2345 |
As listed in Table 3, our measured absolute proper motion of NML Cyg is in good agreement with that of Cyg OB2, computed by averaging proper motions of the most probable cluster members (Kharchenko et al., 2005). NML Cyg’s of km s-1 is consist with the systemic of 7 km s-1 (helio-centric velocity km s-1), within a dispersion of 6 km s-1, for Cyg OB2 as estimated by Kiminki et al. (2007, 2008). For comparison, Table 3 also lists parameters for two other red hypergiants and their associated clusters. We find that the radio proper motions of stars and the optical proper motion of their associated clusters are in good agreement, providing new observational evidence for their association.
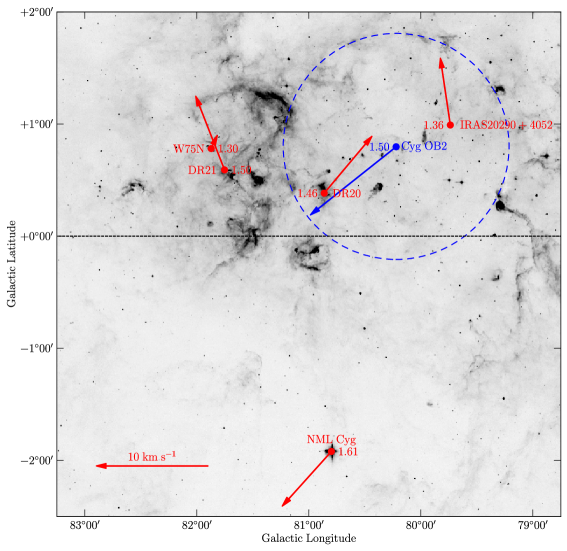
Figure 11 shows the positions of maser sources in the Cygnus X region with accurate parallax measurements and their peculiar motions projected on the sky. We find that the methanol sources are moving upward (toward increasing Galactic latitude) while NML Cyg and Cyg OB2 are moving downward from the Galactic plane. This suggest that the space motions in the Cygnus X region are much more complicated than expected from an expanding Strömgren sphere centered on Cyg OB2 with an angular diameter of 4∘ (Knödlseder, 2003).
(A color version of this figure is available in the online journal.)
4.2 Stellar parameters
Schuster et al. (2009) determined NML Cyg’s minimum bolometric luminosity, = , by integrating its SED from 0.5 to 100 m without correction for extinction. This luminosity is in good agreement with the estimate of = by Blöcker et al. (2001). Adopting our measured distance of kpc, we find NML Cyg’s luminosity to be . We note that a stellar temperature of 2500 K, first derived from a model by Rowan-Robinson & Harris (1983), gives a good fit to the infrared data (Monnier et al., 1997), as compared to a temperature of 3250 K obtained from spectroscopy by Ridgway et al. (1986).
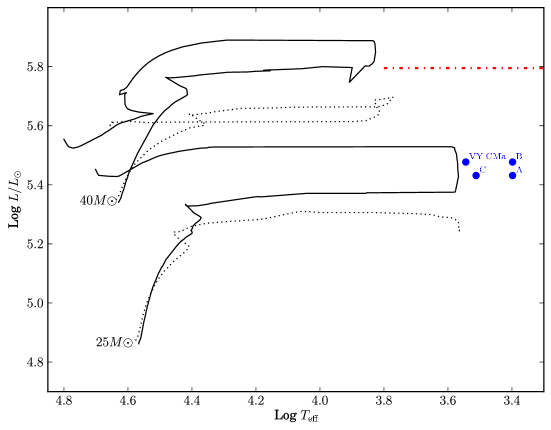
To examine the evolutionary status of NML Cyg, we compared its position on the H-R diagram with stellar evolutionary tracks (Meynet & Maeder, 2003), using different and luminosity values (see Fig. 10). Although NML Cyg’s position with of 3250 K is more consistent with the evolutionary track than those with of 2500 K (compare dots ‘C’ with ‘A’), we find that NML Cyg’s position is closest to the evolutionary track with an initial mass of 25 , instead of 40 quoted in Schuster et al. (2009), no matter which luminosity and we adopted (see dots ‘A’, ‘B’ and ‘C’ in Fig. 10). This mass is similar to that of VY CMa, another red hypergaint star, estimated by Choi et al. (2008). Re-scaling NML Cyg’s luminosity (compare dots ‘A’ with ‘B’) with our distance drops it in the H-R diagram well below the empirical upper luminosity boundary (see the red dot-dashed line in Fig. 10), which is not sensitive to temperature for stars K. However, NML Cyg’s position on the H-R diagram, compared with the evolutionary track, constrains its age (by adopting the evolutionary time of the closest point to NML Cyg on the track) to be 8 Myr, which is considerably greater than that of 2 – 3 Myr for Cyg OB2 (Massey et al., 2001; Hanson, 2003). Since the observational evidence now confirms that NML Cyg is associated with Cyg OB2, they are probably about the same age. If so, the stellar evolutionary model cannot be appropriate for NML Cyg.
NML Cyg’s stellar size of 16.2 mas from Blöcker et al. (2001) was derived using the Stepan-Boltzmann law, adopting = 2500 K and a distance of 1.74 kpc. Rescaling this stellar diameter with our distance of 1.61 kpc gives 15.0 mas. For the radio photosphere, we fitted a round-disk model with a diameter of mas and flux density of mJy using the AIPS task OMFIT, and we calculate a (Rayleigh-Jeans) between 100 K and 6000 K (i.e., ). Clearly more observations are needed to improve this temperature constraint.
4.3 Maser distribution relative to radio photosphere
Richards et al. (1996) proposed a bipolar H2O maser outflow and suggested the central star is located close to the prominent H2O maser cluster at about km s-1 in the irregular ring, assuming the NW and SE feature lie approximately symmetrically about the star. Based on high-resolution HST observations, Schuster et al. (2006) find that the circumstellar material of NML Cyg shows an “arc-like” shape with a line of symmetry and an axis facing toward Cyg OB2, which is coincident with the H2O maser (Richards et al., 1996) and ground state SiO distribution (Boboltz & Claussen, 2004) around NML Cyg. They assumed the star is near the peak intensity in the optical images and coincident with the position of the strongest H2O maser feature, then the maser shows an one-sided distribution within NML Cyg’s nebula. This led to the suggestions that the masers are protected by the star’s envelope from Cyg OB2’s radiation and the arc-like shape of circumstellar material is the result of the interaction between the molecular outflow from NML Cyg and the near-UV continuum flux from Cyg OB2 (Schuster et al., 2009). Nagayama et al. (2008) presented three-dimensional kinematic data for H2O maser features from multi-epoch VLBI observations and suggested an expanding outflow with the central star at the dynamical center.
However, after registering the radio photosphere to the SiO maser and then to the H2O maser, we find that both the SiO maser and H2O maser are highly asymmetrically distributed around the NML Cyg’s central star, which is located at southwest side of both the H2O and SiO maser distribution, and there are H2O and SiO masers located north-west of the central star. This is inconsistent with the model suggested by Schuster et al. (2006, 2009) based on the one-side H2O maser distribution, since there are no masers located north-west of the central star. And the central star is not near the center of the two prominent maser clusters at of about and 5 km s-1 as Nagayama et al. (2008) suggested, but is closer to the maser cluster at of about km s-1, which is coincident with that suggested by Richards et al. (1996). Considering that kinematic models for maser features are highly dependent on maser positions and motions respective to the central star, our direct determination of positions relative to the central star presents a crucial constraint for understanding the properties of the circumstellar material surrounding NML Cyg.
5 Conclusions
We have measured the trigonometric parallax and proper motion of NML Cyg from multiple epoch VLBA observations of the circumstellar H2O and SiO masers. Both the distance and proper motion of NML Cyg are consistent with those of the Cyg OB2 association within their joint uncertainties, confirming that NML Cyg is associated with Cyg OB2. We revised the stellar luminosity using the accurate distance from a trigonometric parallax measurement, suggesting that the location of NML Cyg on the HR diagram is consistent with the evolutionary track of an evolved star with an initial mass of 25 . However, the derived age of 8 Myr for NML Cyg from the evolutionary track is much larger than that 2–3 Myr of Cyg OB2, suggesting that the evolutionary track might not be appropriate to NML Cyg.
After registering the radio photosphere to the H2O and SiO maser, we find the central star is located close to a prominent H2O maser cluster towards the north-west edge of the maser distribution. This is inconsistent with the model that the masers are off to one-side of the star and also the model for an expanding outflow with the star in the middle of two prominent H2O maser clusters as previously suggested.
Acknowledgements.
We would like to thank the referee for very detailed and helpful comments. B. Zhang was supported by the National Science Foundation of China under grant 11073046, 11133008. A. Brunthaler was supported by a Marie Curie Outgoing International Fellowship (FP7) of the European Union (project number 275596).References
- Abbott et al. (1981) Abbott, D. C., Bieging, J. H., & Churchwell, E. 1981, ApJ, 250, 645
- Asaki et al. (2010) Asaki, Y., Deguchi, S., Imai, H., et al. 2010, ApJ, 721, 267
- Blöcker et al. (2001) Blöcker, T., Balega, Y., Hofmann, K.-H., & Weigelt, G. 2001, A&A, 369, 142
- Boboltz & Claussen (2004) Boboltz, D. A. & Claussen, M. J. 2004, ApJ, 608, 480
- Boboltz & Marvel (2000) Boboltz, D. A. & Marvel, K. B. 2000, ApJ, 545, L149
- Brunthaler et al. (2011) Brunthaler, A., Reid, M. J., Menten, K. M., et al. 2011, Astronomische Nachrichten, 332, 461
- Choi et al. (2008) Choi, Y. K., Hirota, T., Honma, M., et al. 2008, PASJ, 60, 1007
- Danchi et al. (2001) Danchi, W. C., Green, W. H., Hale, D. D. S., et al. 2001, ApJ, 555, 405
- Denisenkova et al. (1988) Denisenkova, S. N., Larionova, L. V., & Khozov, G. V. 1988, Peremennye Zvezdy, 22, 882
- Etoka & Diamond (2004) Etoka, S. & Diamond, P. 2004, MNRAS, 348, 34
- Habing et al. (1982) Habing, H. J., Goss, W. M., & Winnberg, A. 1982, A&A, 108, 412
- Hanson (2003) Hanson, M. M. 2003, ApJ, 597, 957
- Johnson (1967) Johnson, H. L. 1967, ApJ, 149, 345
- Johnson & Morgan (1954) Johnson, H. L. & Morgan, W. W. 1954, ApJ, 119, 344
- Johnston et al. (1985) Johnston, K. J., Spencer, J. H., & Bowers, P. F. 1985, ApJ, 290, 660
- Kemper et al. (2003) Kemper, F., Stark, R., Justtanont, K., et al. 2003, A&A, 407, 609
- Kharchenko et al. (2005) Kharchenko, N. V., Piskunov, A. E., Röser, S., Schilbach, E., & Scholz, R.-D. 2005, A&A, 438, 1163
- Kiminki et al. (2007) Kiminki, D. C., Kobulnicky, H. A., Kinemuchi, K., et al. 2007, ApJ, 664, 1102
- Kiminki et al. (2008) Kiminki, D. C., Kobulnicky, H. A., Kinemuchi, K., et al. 2008, ApJ, 681, 735
- Knödlseder (2000) Knödlseder, J. 2000, A&A, 360, 539
- Knödlseder (2003) Knödlseder, J. 2003, in IAU Symposium, Vol. 212, A Massive Star Odyssey: From Main Sequence to Supernova, ed. K. van der Hucht, A. Herrero, & C. Esteban, 505
- Kovalev et al. (2007) Kovalev, Y. Y., Petrov, L., Fomalont, E. B., & Gordon, D. 2007, AJ, 133, 1236
- Marvel (1996) Marvel, K. B. 1996, PhD thesis, , New Mexico State Univ., (1996)
- Massey et al. (2001) Massey, P., DeGioia-Eastwood, K., & Waterhouse, E. 2001, AJ, 121, 1050
- Massey & Thompson (1991) Massey, P. & Thompson, A. B. 1991, AJ, 101, 1408
- Menten et al. (2006) Menten, K. M., Philipp, S. D., Güsten, R., et al. 2006, A&A, 454, L107
- Meynet & Maeder (2003) Meynet, G. & Maeder, A. 2003, A&A, 404, 975
- Monnier et al. (1997) Monnier, J. D., Bester, M., Danchi, W. C., et al. 1997, ApJ, 481, 420
- Morris & Jura (1983) Morris, M. & Jura, M. 1983, ApJ, 267, 179
- Motte et al. (2007) Motte, F., Bontemps, S., Schilke, P., et al. 2007, A&A, 476, 1243
- Nagayama et al. (2008) Nagayama, T., Takeda, K., Omodaka, T., et al. 2008, PASJ, 60, 1069
- Reddish et al. (1966) Reddish, V. C., Lawrence, L. C., & Pratt, N. M. 1966, Publications of the Royal Observatory of Edinburgh, 5, 111
- Reid & Menten (1990) Reid, M. J. & Menten, K. M. 1990, ApJ, 360, L51
- Reid & Menten (1997) Reid, M. J. & Menten, K. M. 1997, ApJ, 476, 327
- Reid & Menten (2007) Reid, M. J. & Menten, K. M. 2007, ApJ, 671, 2068
- Reid et al. (2009a) Reid, M. J., Menten, K. M., Brunthaler, A., et al. 2009a, ApJ, 693, 397
- Reid et al. (2009b) Reid, M. J., Menten, K. M., Zheng, X. W., et al. 2009b, ApJ, 700, 137
- Richards et al. (1996) Richards, A. M. S., Yates, J. A., & Cohen, R. J. 1996, MNRAS, 282, 665
- Ridgway et al. (1986) Ridgway, S. T., Joyce, R. R., Connors, D., Pipher, J. L., & Dainty, C. 1986, ApJ, 302, 662
- Rowan-Robinson & Harris (1983) Rowan-Robinson, M. & Harris, S. 1983, MNRAS, 202, 767
- Rygl et al. (2012) Rygl, K. L. J., Brunthaler, A., Sanna, A., et al. 2012, A&A, 539, A79
- Schönrich et al. (2010) Schönrich, R., Binney, J., & Dehnen, W. 2010, MNRAS, 403, 1829
- Schuster et al. (2006) Schuster, M. T., Humphreys, R. M., & Marengo, M. 2006, AJ, 131, 603
- Schuster et al. (2009) Schuster, M. T., Marengo, M., Hora, J. L., et al. 2009, ApJ, 699, 1423
- Shintani et al. (2008) Shintani, M., Imai, H., Ando, K., et al. 2008, PASJ, 60, 1077
- Skrutskie et al. (2006) Skrutskie, M. F., Cutri, R. M., Stiening, R., et al. 2006, AJ, 131, 1163
- Teyssier et al. (in prep.) Teyssier, D., Quintana-Lacaci, G., Marston, A. P., et al., 2012, A&A, submitted
- Torres-Dodgen et al. (1991) Torres-Dodgen, A. V., Carroll, M., & Tapia, M. 1991, MNRAS, 249, 1
- Walborn (1973) Walborn, N. R. 1973, ApJ, 180, L35
- Yates & Cohen (1994) Yates, J. A. & Cohen, R. J. 1994, MNRAS, 270, 958
- Zhang et al. (2012) Zhang, B., Reid, M. J., Menten, K. M., & Zheng, X. W. 2012, ApJ, 744, 23
- Zubko et al. (2004) Zubko, V., Li, D., Lim, T., Feuchtgruber, H., & Harwit, M. 2004, ApJ, 610, 427
|
|
|
|
|
|
|
|
||||||||||||||
|---|---|---|---|---|---|---|---|---|---|---|---|---|---|---|---|---|---|---|---|---|---|
| J20444005 | B | 6.48 | 0.68 0.10 | 1.66 0.58 | 4.53 0.19 | 0.44 0.19 | 2.19 0.06 | ||||||||||||||
| B | 6.06 | 0.72 0.10 | 1.70 0.52 | 4.33 0.19 | 0.37 0.17 | 2.09 0.05 | |||||||||||||||
| B | 5.64 | 0.70 0.09 | 1.59 0.48 | 4.47 0.18 | 0.50 0.16 | 2.18 0.05 | |||||||||||||||
| B | 5.22 | 0.70 0.08 | 1.68 0.44 | 4.55 0.15 | 0.63 0.15 | 2.29 0.04 | |||||||||||||||
| B | 4.80 | 0.69 0.06 | 1.31 0.47 | 4.73 0.12 | 0.90 0.16 | 2.55 0.03 | |||||||||||||||
| B | 4.37 | 0.55 0.06 | 1.85 0.18 | 5.50 0.15 | 0.66 0.06 | 3.10 0.04 | |||||||||||||||
| B | 3.95 | 0.73 0.07 | 1.08 0.52 | 4.59 0.14 | 0.25 0.17 | 3.80 0.04 | |||||||||||||||
| F | 18.80 | 0.69 0.10 | 1.81 0.43 | 5.25 0.20 | 85.02 0.14 | 0.71 0.06 | |||||||||||||||
| F | 19.22 | 0.65 0.12 | 1.90 0.39 | 5.43 0.25 | 84.93 0.13 | 0.94 0.08 | |||||||||||||||
| F | 19.64 | 0.88 0.21 | 3.34 0.93 | 5.01 0.41 | 83.88 0.31 | 6.87 0.12 | |||||||||||||||
| G | 20.06 | 0.59 0.12 | 1.28 0.33 | 4.37 0.32 | 83.05 0.11 | 6.98 0.10 | |||||||||||||||
| A | 20.48 | 0.66 0.09 | 1.99 0.36 | 4.85 0.18 | 83.15 0.12 | 6.99 0.05 | |||||||||||||||
| A | 20.90 | 0.73 0.10 | 2.25 0.45 | 4.98 0.19 | 83.20 0.15 | 6.96 0.05 | |||||||||||||||
| A | 21.32 | 0.66 0.09 | 1.24 0.33 | 5.06 0.20 | 76.67 0.11 | 5.59 0.06 | |||||||||||||||
| A | 21.75 | 0.66 0.10 | 1.31 0.32 | 4.99 0.22 | 76.78 0.11 | 5.63 0.07 | |||||||||||||||
| A | 22.17 | 0.75 0.07 | 2.23 0.62 | 5.15 0.14 | 84.58 0.20 | 4.52 0.04 | |||||||||||||||
| A | 22.59 | 0.75 0.08 | 2.06 0.54 | 5.15 0.14 | 84.71 0.18 | 4.50 0.04 | |||||||||||||||
| A | 23.01 | 0.70 0.09 | 2.12 0.42 | 5.17 0.17 | 84.77 0.14 | 4.46 0.05 | |||||||||||||||
| R | 24.27 | 0.71 0.06 | 0.63 0.53 | 3.88 0.12 | 41.28 0.18 | 33.57 0.03 | |||||||||||||||
| J20464106 | B | 6.48 | 0.63 0.05 | 1.56 0.13 | 4.29 0.13 | 0.23 0.05 | 2.73 0.04 | ||||||||||||||
| B | 6.06 | 0.62 0.01 | 1.59 0.02 | 4.12 0.16 | 0.16 0.01 | 2.64 0.05 | |||||||||||||||
| B | 5.64 | 0.64 0.01 | 1.50 0.02 | 4.24 0.15 | 0.29 0.01 | 2.72 0.05 | |||||||||||||||
| B | 5.22 | 0.69 0.01 | 1.60 0.02 | 4.27 0.17 | 0.42 0.01 | 2.83 0.06 | |||||||||||||||
| B | 4.80 | 0.61 0.01 | 1.21 0.02 | 4.53 0.22 | 0.68 0.01 | 3.10 0.07 | |||||||||||||||
| B | 4.37 | 0.57 0.09 | 1.77 0.26 | 5.20 0.22 | 0.46 0.09 | 3.64 0.07 | |||||||||||||||
| B | 3.95 | 0.56 0.03 | 0.96 0.06 | 4.46 0.25 | 0.02 0.02 | 4.36 0.08 | |||||||||||||||
| F | 18.80 | 0.62 0.03 | 1.72 0.08 | 5.03 0.18 | 84.81 0.03 | 1.26 0.06 | |||||||||||||||
| F | 19.22 | 0.64 0.03 | 1.82 0.07 | 5.14 0.07 | 84.73 0.02 | 1.49 0.02 | |||||||||||||||
| F | 19.64 | 0.81 0.20 | 3.24 0.50 | 4.77 0.59 | 83.67 0.17 | 7.42 0.19 | |||||||||||||||
| G | 20.06 | 0.61 0.10 | 1.21 0.28 | 4.04 0.26 | 82.85 0.09 | 7.52 0.08 | |||||||||||||||
| A | 20.48 | 0.65 0.04 | 1.91 0.11 | 4.57 0.15 | 82.94 0.04 | 7.54 0.05 | |||||||||||||||
| A | 20.90 | 0.67 0.02 | 2.15 0.04 | 4.75 0.17 | 82.99 0.02 | 7.51 0.06 | |||||||||||||||
| A | 21.32 | 0.64 0.04 | 1.16 0.10 | 4.78 0.21 | 76.47 0.03 | 6.14 0.07 | |||||||||||||||
| A | 21.75 | 0.64 0.05 | 1.23 0.11 | 4.71 0.19 | 76.57 0.04 | 6.17 0.06 | |||||||||||||||
| A | 22.17 | 0.53 0.01 | 2.10 0.02 | 5.07 0.20 | 84.34 0.01 | 5.08 0.06 | |||||||||||||||
| A | 22.59 | 0.58 0.01 | 1.95 0.02 | 5.02 0.18 | 84.48 0.01 | 5.05 0.06 | |||||||||||||||
| A | 23.01 | 0.63 0.09 | 2.03 0.38 | 4.94 0.17 | 84.56 0.13 | 5.01 0.05 | |||||||||||||||
| R | 24.27 | 0.54 0.02 | 0.52 0.05 | 3.75 0.28 | 41.05 0.02 | 34.13 0.09 | |||||||||||||||
| J20494118 | B | 6.48 | 0.62 0.02 | 1.48 0.07 | 4.03 0.05 | 0.13 0.02 | 2.15 0.02 | ||||||||||||||
| B | 6.06 | 0.63 0.03 | 1.52 0.08 | 3.82 0.13 | 0.20 0.03 | 2.05 0.04 | |||||||||||||||
| B | 5.64 | 0.64 0.04 | 1.42 0.10 | 3.95 0.12 | 0.07 0.03 | 2.13 0.04 | |||||||||||||||
| B | 5.22 | 0.68 0.05 | 1.52 0.11 | 3.99 0.16 | 0.06 0.04 | 2.24 0.05 | |||||||||||||||
| B | 4.80 | 0.62 0.04 | 1.14 0.09 | 4.23 0.18 | 0.33 0.03 | 2.51 0.06 | |||||||||||||||
| B | 4.37 | 0.52 0.07 | 1.68 0.35 | 4.95 0.14 | 0.09 0.11 | 3.06 0.04 | |||||||||||||||
| B | 3.95 | 0.59 0.06 | 0.89 0.15 | 4.14 0.19 | 0.33 0.05 | 3.77 0.06 | |||||||||||||||
| F | 18.80 | 0.64 0.06 | 1.64 0.17 | 4.72 0.13 | 84.45 0.06 | 0.67 0.04 | |||||||||||||||
| F | 19.22 | 0.62 0.01 | 1.73 0.13 | 4.86 0.03 | 84.37 0.04 | 0.90 0.01 | |||||||||||||||
| F | 19.64 | 0.81 0.17 | 3.17 0.42 | 4.47 0.53 | 83.31 0.14 | 6.83 0.17 | |||||||||||||||
| G | 20.06 | 0.62 0.10 | 1.13 0.27 | 3.74 0.26 | 82.49 0.09 | 6.93 0.08 | |||||||||||||||
| A | 20.48 | 0.62 0.04 | 1.83 0.16 | 4.32 0.08 | 82.58 0.05 | 6.95 0.02 | |||||||||||||||
| A | 20.90 | 0.67 0.04 | 2.08 0.10 | 4.45 0.12 | 82.63 0.03 | 6.92 0.04 | |||||||||||||||
| A | 21.32 | 0.64 0.06 | 1.08 0.15 | 4.49 0.15 | 76.11 0.05 | 5.55 0.05 | |||||||||||||||
| A | 21.75 | 0.65 0.06 | 1.15 0.17 | 4.41 0.14 | 76.21 0.06 | 5.58 0.04 | |||||||||||||||
| A | 22.17 | 0.55 0.05 | 2.03 0.11 | 4.76 0.21 | 83.99 0.04 | 4.49 0.07 | |||||||||||||||
| A | 22.59 | 0.60 0.05 | 1.87 0.10 | 4.70 0.18 | 84.13 0.04 | 4.46 0.06 | |||||||||||||||
| A | 23.01 | 0.65 0.05 | 1.95 0.47 | 4.64 0.09 | 84.20 0.15 | 4.42 0.03 | |||||||||||||||
| R | 24.27 | 0.56 0.06 | 0.44 0.13 | 3.44 0.22 | 40.70 0.05 | 33.54 0.07 | |||||||||||||||
| Combined | |||||||||||||||||||||
| B | 6.48 | 1.56 0.13 | 4.29 0.11 | ||||||||||||||||||
| B | 6.06 | 1.59 0.13 | 4.11 0.11 | ||||||||||||||||||
| B | 5.64 | 1.49 0.13 | 4.24 0.11 | ||||||||||||||||||
| B | 5.22 | 1.58 0.13 | 4.33 0.11 | ||||||||||||||||||
| B | 4.80 | 1.21 0.13 | 4.50 0.11 | ||||||||||||||||||
| B | 4.37 | 1.78 0.13 | 5.14 0.11 | ||||||||||||||||||
| B | 3.95 | 0.97 0.13 | 4.39 0.11 | ||||||||||||||||||
| F | 18.80 | 1.71 0.13 | 5.02 0.11 | ||||||||||||||||||
| F | 19.22 | 1.81 0.13 | 5.14 0.11 | ||||||||||||||||||
| G | 20.06 | 1.21 0.13 | 4.02 0.11 | ||||||||||||||||||
| A | 20.48 | 1.90 0.13 | 4.59 0.11 | ||||||||||||||||||
| A | 20.90 | 2.14 0.13 | 4.78 0.11 | ||||||||||||||||||
| A | 21.32 | 1.15 0.13 | 4.79 0.11 | ||||||||||||||||||
| A | 21.75 | 1.22 0.13 | 4.71 0.11 | ||||||||||||||||||
| A | 22.17 | 2.11 0.13 | 4.98 0.11 | ||||||||||||||||||
| A | 22.59 | 1.95 0.13 | 4.97 0.11 | ||||||||||||||||||
| A | 23.01 | 2.03 0.13 | 4.94 0.11 | ||||||||||||||||||
| R | 24.27 | 0.53 0.13 | 3.66 0.11 | ||||||||||||||||||
| 0.620 0.047 |