A study of the environments of large radio galaxies using SDSS
Abstract
The distributions of galaxies in the environments of 16 large radio sources have been examined using the Sloan Digital Sky Survey. In the giant radio galaxy J1552+2005 (3C326) which has the highest arm-length ratio, the shorter arm is found to interact with a group of galaxies which forms part of a filamentary structure. Although most large sources occur in regions of low galaxy density, the shorter arm is brighter in most cases suggesting asymmetries in the intergalactic medium which may not be apparent in the distribution of galaxies. In two cases with strong and variable cores, J0313+4120 and J1147+3501, the large flux density asymmetries are possibly also caused by the effects of relativistic motion.
keywords:
galaxies: jets – intergalactic medium – large scale structure of Universe – galaxies: groups: general – radio continuum: galaxies – cosmology: observations1 Introduction
Large radio galaxies can be valuable probes of the intergalactic medium (IGM) and large-scale structures of the Universe. While the structures of the compact steep spectrum and giga-Hertz peaked spectrum sources of subgalactic dimensions may be affected by interactions with clouds in the interstellar medium of the host galaxies, radio sources in clusters are affected by intracluster winds and peculiar velocities of galaxies, giving rise to a wide variety of shapes such as the tailed radio sources (e.g. Owen & Rudnick 1976; Blanton et al. 2003; Giacintucci & Venturi 2009; Mao et al. 2010). The structures of large radio sources, on the other hand, could be affected by the filaments, sheets and voids which make up the large-scale structure of our Universe.
Amongst large radio sources, the giant radio galaxies (GRGs) which are defined to be 1 Mpc (Ho=71 km s-1 Mpc-1, =0.27, =0.73, Spergel et al. 2003) are the largest single objects in the Universe. The effect of galaxy distributions on the structures of individual GRGs has been studied by a number of authors over the years, but these have been limited to only a handful of sources. The sources studied include B0503286 (Saripalli et al. 1986), MSH 0522 (Subrahmanyan et al. 2008), B0319454 (Safouris et al. 2009), DA240 (Peng et al. 2004; Chen et al. 2011a), NGC6251 (Chen et al. 2011b) and NGC315 (Chen et al. 2012). Chen et al. have studied the properties of the groups associated with NGC315 and NGC6251, and also highlighted a number of galaxies along the radio axis in DA240. Assuming that the galaxies trace the ambient IGM, Saripalli et al. (1986), Subrahmanyan et al. (2008) and Safouris et al. (2009) have explored and found evidence of anisotropies in the medium affecting the radio structures.
In this paper we explore this theme for a sample of 16 large radio galaxies which range from 700 to 4200 kpc using data from the Sloan Digital Sky Survey (SDSS) Data Release 8 (DR8).
2 Sample and galaxy counts
For this study we have considered all large sources (700 kpc) listed by Ishwara-Chandra & Saikia (1999), Lara et al. (2001), Machalski et al. (2001) and Schoenmakers et al. (2000) which are within the area covered by SDSS DR8 and with the r-band magnitude of the host galaxy being 18. Since radio galaxies are usually associated with the brightest galaxy in a group or cluster, this should help us identify most of the associated members. For making a detailed multi-frequency study of these sources, we have also chosen them to have an integrated flux density at 1.4 GHz 100 mJy. We have excluded a couple of sources being studied independently from a sample compiled by Jamrozy et al. (in preparation). This gives us a total of 16 sources (Table 1).
| Source | Alt. Name | RA(J2000.0) | DEC(J2000.0) | z | LAS | l | S1.4 | r-mag | P1.4 | Ref. |
|---|---|---|---|---|---|---|---|---|---|---|
| (hh mm ss) | (dd mm ss) | (′′) | (kpc) | (mJy) | (W/Hz) | |||||
| J0313+4120 | B0309+411 | 03:13:01.95 | +41:20:01.21 | 0.1340 | 532 | 1251 | 518 | 16.96 | 25.29 | S00 |
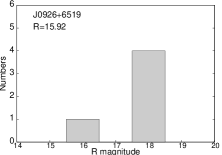
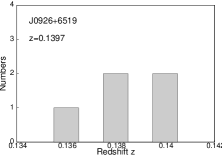
| J0926+6519 | 09:26:00.82 | +65:19:23.00 | 0.1397 | 276 | 672 | 102 | 15.92 | 24.63 | L01 | |
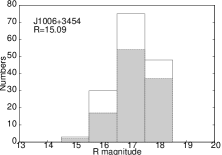
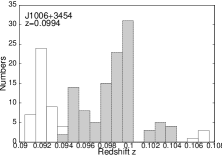
| J1006+3454 | 3C236 | 10:06:01.73 | +34:54:10.52 | 0.0994 | 2302 | 4174 | 4516 | 15.09 | 25.97 | I99 |
| J1113+4017 | 11:13:05.54 | +40:17:29.84 | 0.0745 | 637 | 891 | 240 | 15.01 | 24.45 | M01 | |
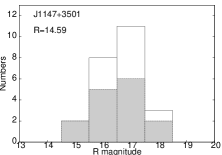
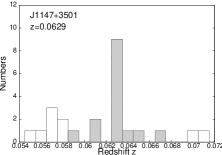
| J1147+3501 | 1144+352 | 11:47:22.13 | +35:01:07.54 | 0.0629 | 708 | 847 | 877 | 14.59 | 24.88 | I99 |
| J1220+6341 | 12:20:36.41 | +63:41:44.48 | 0.1876 | 250 | 777 | 260 | 17.25 | 25.41 | L01 | |
| J1247+6723 | VII Zw 485 | 12:47:33.31 | +67:23:16.72 | 0.1072 | 634 | 1229 | 393 | 16.03 | 24.98 | L01 |
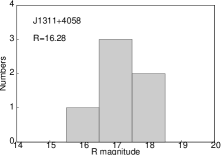
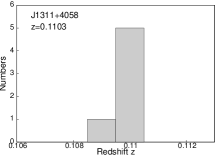
| J1311+4058 | B1309+412 | 13:11:43.08 | +40:58:59.78 | 0.1103 | 368 | 731 | 596 | 16.28 | 25.18 | S00 |
| J13280307 | 13:28:34.36 | 03:07:44.78 | 0.0853 | 818 | 1293 | 218 | 16.70 | 24.51 | M01 | |
| J1342+3758 | 13:42:54.51 | +37:58:18.81 | 0.2270 | 657 | 2369 | 141 | 17.86 | 25.16 | M01 | |
| J1345+3952 | B1342+401 | 13:45:03.57 | +39:52:31.42 | 0.1612 | 307 | 843 | 178 | 17.24 | 24.96 | M01 |
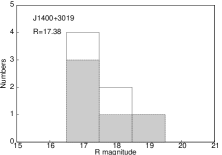
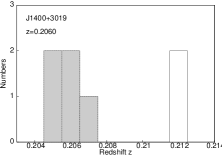
| J1400+3019 | B1358+305 | 14:00:43.43 | +30:19:18.59 | 0.2060 | 542 | 1813 | 449 | 17.38 | 25.57 | S00 |
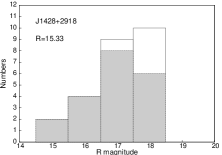
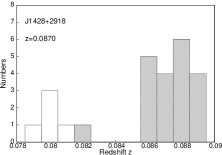
| J1428+2918 | B1426+295 | 14:28:19.23 | +29:18:44.19 | 0.0870 | 850 | 1368 | 437 | 15.33 | 24.83 | M01 |
| J1453+3308 | 4C +33.33 | 14:53:02.86 | +33:08:42.41 | 0.2481 | 361 | 1391 | 459 | 17.74 | 25.74 | M01 |
| J1552+2005 | 3C326 | 15:52:09.11 | +20:05:48.17 | 0.0898 | 964 | 1595 | 2347 | 15.88 | 25.59 | I99 |
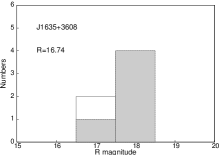
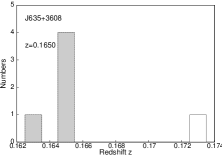
| J1635+3608 | 16:35:22.54 | +36:08:04.99 | 0.1650 | 385 | 1078 | 100 | 16.74 | 24.76 | M01 |
References: S00: Schoenmakers et al. 2000; L01: Lara et al. 2001; I99: Ishwara-Chandra et al. 1999;
M01: Machalski et al. 2001
Using SDSS DR8 data of the Baryon Oscillation Spectroscopic Survey or BOSS (Aihara et al. 2011), we have initially identified all the galaxies within a box of 6 times the source size centred on the identified galaxy, and up to 5 mag fainter than the host galaxy. The box widths and the number of galaxies within them are listed in Table 2. Almost all these galaxies have a spectroscopic redshift in SDSS DR8. We have used these to estimate the recession velocity, , and identify all the galaxies which are within 1500 and 2500 km s-1 of the host galaxy. Since interacting clusters may sometimes have large velocity dispersion (e.g. Mao et al. 2010), we have considered values as large as 2500 km s-1. The number of galaxies within these limits is also listed in Table 2. We have also estimated the separation and flux density ratios of the outer lobes for these sources (Table 3).
| Source | width | width | N | N | N |
|---|---|---|---|---|---|
| (′′) | (kpc) | ||||
| (1) | (2) | (3) | (4) | (5) | (6) |
| J0313+4120 | 3192 | 7504 | 3 | 2 | 2 |
| J0926+6519 | 1656 | 4034 | 9 | 5 | 5 |
| J1006+3454 | 13812 | 25041 | 1053 | 110 | 156 |
| J1113+4017 | 3822 | 5343 | 231 | 158 | 167 |
| J1147+3501 | 4248 | 5081 | 118 | 15 | 24 |
| J1220+6341 | 1500 | 4659 | 10 | 1 | 1 |
| J1247+6723 | 3804 | 7372 | 28 | 2 | 2 |
| J1311+4058 | 2208 | 4387 | 26 | 6 | 6 |
| J13280307 | 4908 | 7760 | 130 | 20 | 22 |
| J1342+3758 | 3942 | 14211 | 17 | 1 | 1 |
| J1345+3952 | 1842 | 5058 | 14 | 2 | 2 |
| J1400+3019 | 3252 | 10875 | 40 | 5 | 7 |
| J1428+2918 | 5100 | 8206 | 142 | 20 | 25 |
| J1453+3308 | 2166 | 8348 | 9 | 1 | 1 |
| J1552+2005 | 5784 | 9573 | 258 | 45 | 60 |
| J1635+3608 | 2310 | 6466 | 29 | 5 | 6 |


| Source Name | Rθ | R | lobe | fc | Ref. |
|---|---|---|---|---|---|
| (1) | (2) | (3) | (4) | (5) | (6) |
| J0313+4120 | 1.67 | 0.16 | SW | 0.709 | dB89, S00 |
| J0926+6519 | 1.01 | 0.91 | SW | 0.090 | NVSS |
| J1006+3454 | 1.61 | 0.58 | SE | 0.725 | S80 |
| J1113+4017 | 1.16 | 0.69 | SW | 0.045 | NVSS |
| J1147+3501 | 1.20 | 2.09 | E | 0.698 | S99 |
| J1220+6341 | 1.40 | 0.96 | SE | 0.012 | NVSS |
| J1247+6723 | 1.07 | 0.90 | SE | 0.654 | NVSS |
| J1311+4058 | 1.01 | 0.73 | S | 0.001 | V89, NVSS |
| J13280307 | 1.15 | 0.50 | NE | 0.040 | M99, NVSS |
| J1342+3758 | 1.38 | 0.69 | NE | 0.009 | J05 |
| J1345+3952 | 1.16 | 0.83 | E | 0.027 | NVSS |
| J1400+3019 | 2.47 | 0.46 | S | 0.004 | P96 |
| J1428+2918 | 1.31 | 0.96 | SW | 0.028 | S00, NVSS |
| J1453+3308 | 1.31 | 0.59 | S | 0.009 | K06 |
| J1552+2005 | 3.10 | 0.53 | W | 0.002 | M97 |
| J1635+3608 | 2.04 | 0.74 | SW | 0.039 | NVSS |
References: dB89: de Bruyn 1989; S00: Schoenmakers et al. 2000; NVSS: NVSS survey;
S80: Strom & Willis 1980; S99: Schoenmakers et al. 1999; V89: Vigotti et al. 1989;
M99: Machalski & Condon 1999; J05: Jamrozy et al. 2005; P96: Parma et al. 1996;
K06: Konar et al. 2006; M97: Mack et al. 1997


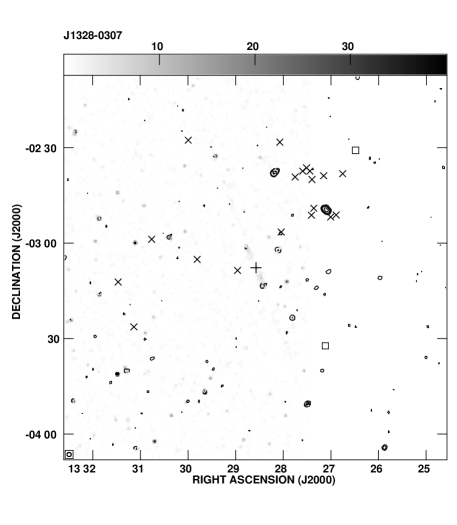
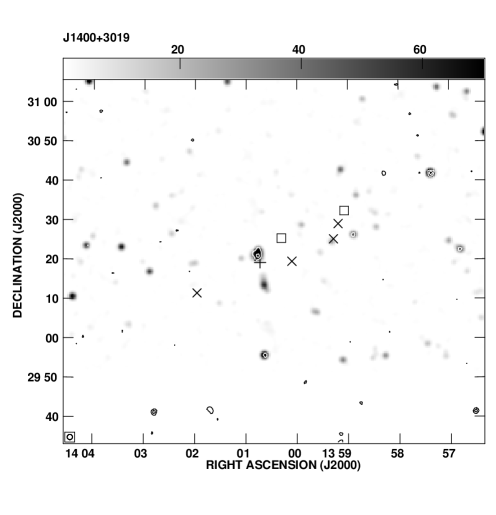


Radio images towards J13280307, J14003019, J14282918 and J16353608. For images towards J13280307 and J14003019, the grey scale represents the NVSS and the contours represent the VLSS images, while for J14282918 and J16353608 the images are from NVSS. The symbols have the same meaning as in Fig. 1.
3 Results and Discussion
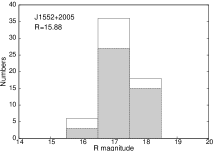
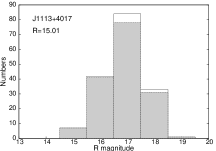
Almost all the giant radio sources, except for J1113+4017 which is associated with Abell 1203 of richness class 0 (Abell, Corwin & Olowin 1989), are either in poor groups or are relatively isolated, consistent with earlier studies. We first focus on the two sources J11134017 and J15522005 which either exhibit some evidence of filamentary-like structure in the distribution of galaxies or a higher projected density of galaxies (Fig. 1). We consider the galaxy distributions to form a coherent filamentary-like structure if it is at least 5 Mpc long, with the ratio of the length to width being 5. Within this structure, the surface density of galaxies should be 2 Mpc-2 and the surface density contrast with the rest of the field should be 10.
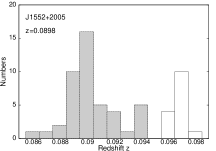
In the GRG J1552+2005 (3C326) the galaxies within 1500 km s-1 form a filamentary structure. There is a concentration of galaxies on the outer side of the eastern lobe, which is both closer and brighter, demonstrating that the radio structure has been influenced by interaction with this large-scale structure. It has the largest arm-length ratio (Rθ=3.10) amongst our sample of sources, and as expected from interaction of the radio jet with the cluster of galaxies, the nearer lobe is brighter (see Eilek & Shore 1989; Jeyakumar et al. 2005). The galaxies with relative velocities of 1500 km s-1 to 2500 km s-1 appear quite distinct in the velocity distribution of the galaxies, and could be part of a background structure.
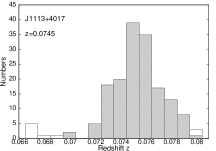
Although J1113+4017 occurs in a rich cluster of galaxies, there is no concentration of galaxies in the immediate vicinity of the radio lobes, and the source appears reasonably symmetric with arm-length and flux density ratios of the lobes being 1.5. We have examined the distribution of galaxies in different velocity slices to examine possible evidence of filamentary structures, but do not find evidence of any feature that meets our criteria.
Fig. 2 shows the radio contour images of eight sources along with the positions of the galaxies within 2500 km s-1. Six radio sources which occur in environments of very low galaxy density with 2 optical galaxies in the field (see Table 2) are not shown here. While visually examining the distributions of galaxies there appeared to be coherent structures in a few cases, such as J1006+3454, J1400+3019 and J1635+3608, but these did not satisfy our criteria for classifying these as filamentary-like structures.
Of the sources in our sample, the most asymmetric source is J0313+4120, which exhibits the highest degree of flux density asymmetry. This source is in a low-density environment with only one galaxy within 2500 km s-1 and located 2.7 Mpc from the parent galaxy. However, it has a strong and variable radio core, and its observed asymmetry is likely to be significantly influenced by relativistic motion. This may also be the case for J1147+3501, where most of the galaxies which are within 1500 km s-1 of the identified GRG lie in the vicinity of the radio source. It has been suggested by Schoenmakers et al. (1999) that there are two radio sources in the centre of the field, with the two components on the north-western side forming an independent source, J1147+3503, with a linear size of 153 kpc. The GRG is reasonably symmetric in the location of the lobes (Rθ=1.20), although the flux density ratio is 2.09. A variable and prominent core (Schoenmakers et al. 1999; see also Table 3) suggests that the flux density asymmetry could be due to effects of relativistic motion. There is no concentration of galaxies in the outer extremities of the lobes.
Besides J0313+4120 and J1147+3501, the two other sources with prominent central components are J1006+3454 and J1247+6723. However high-resolution observations show the latter two to be rejuvenated radio sources with compact inner doubles (see Saikia & Jamrozy 2009, and references therein). In all the sources, except for J1147+3501, the nearer component tends to be brighter. Assuming that the oppositely-directed jets are intrinsically symmetric, this suggests that although these sources are often in regions of low galaxy density, the source asymmetries are affected by density asymmetries of the IGM on these scales.
4 Concluding remarks
The most significant finding of this study is that in the GRG J1552+2005 (3C326) which has the largest arm-length ratio of 3.10, the shorter arm is interacting with a group of galaxies which forms part of a filamentary structure. Except for one source, J1113+4017, which occurs in a cluster of galaxies of Abell richness class 0, most occur in regions of low galaxy density. However, in these sources too the shorter arm tends to be brighter suggesting that these are affected by IGM density asymmetries which are not apparent in density counts of galaxies. In two cases, J0313+4120 and J1147+3501, which have prominent and variable radio cores, the observed flux density ratios are also likely to be influenced by the effects of relativistic motion. It would be useful to extend such studies to a larger sample of sources and also probe their environments via sensitive X-ray observations.
Acknowledgments
We thank the reviewer for detailed comments and a careful reading of the manuscript which have helped improve the paper, and Tirthankar Roy Choudhury for useful discussions. AP thanks NCRA, TIFR for hospitality during the course of this work. SDSS-III is managed by the Astrophysical Research Consortium for the Participating Institutions of the SDSS-III Collaboration. Funding for SDSS-III has been provided by the Alfred P. Sloan Foundation, the Participating Institutions, the National Science Foundation, and the U.S. Department of Energy Office of Science. This research has made use of the NASA/IPAC extragalactic database (NED) which is operated by the Jet Propulsion Laboratory, Caltech, under contract with the National Aeronautics and Space Administration. We thank numerous contributors to the GNU/Linux group. This research has made use of NASA’s Astrophysics Data System.
References
- [] Abell G.O., Corwin H.G. Jr., Olowin P., 1989, ApJS, 70, 1
- [] Aihara H. et al., 2011, ApJS, 193, 29
- [] Blanton E.L., Gregg M.D., Helfand D.J., Becker R.H., White R.L., 2003, AJ, 125, 1635
- [] Chen R., Peng B., Strom R.G., Wei J., 2011a, MNRAS, 412, 2433
- [] Chen R., Peng B., Strom R.G., Wei J., Zhao Y., 2011b, A&A, 529, 5
- [] Chen R., Peng B., Strom R.G., Wei J., 2012, MNRAS, 420, 2715
- [] Cohen A.S., Lane W.M., Cotton W.D., Kassim N.E., Lazio T.J.W., Perley R.A., Condon J.J., Erickson W.C., 2007, AJ, 134, 1245
- [] Condon J.J., Cotton W.D., Greisen E.W., Yin Q.F., Perley R.A., Taylor G.B., Broderick J.J., 1998, AJ, 115, 1693
- [] de Bruyn A.G., 1989, A&A, 226, 13
- [] Eilek J.A., Shore S.N., 1989, ApJ, 342, 187
- [] Giacintucci S., Venturi T., 2009, A&A, 505, 55
- [] Ishwara-Chandra C.H., Saikia D.J., 1999, MNRAS, 309, 100
- [] Jamrozy M., Machalski J., Mack K.-H., Klein U., 2005, A&A, 433, 467
- [] Jeyakumar S., Wiita P.J., Saikia D.J., Hooda J.S., 2005, A&A, 432, 823
- [] Konar C., Saikia D.J., Jamrozy M., Machalski J., 2006, MNRAS, 372, 693
- [] Lara L., Cotton W.D., Feretti L., Giovannini G., Marcaide J.M., Màrquez I., Venturi T., 2001, A&A, 370, 409
- [] Machalski J., Condon J.J., 1999, ApJS, 123, 41
- [] Machalski J., Jamrozy M., Zola S., 2001, A&A, 371, 445
- [] Mack K.-H., Klein U., O’Dea C.P., Willis A.G., 1997, A&AS, 123, 423
- [] Mao M.Y., Sharp R., Saikia D.J., Norris R.P., Johnston-Hollitt M., Middelberg E., Lovell J.E.J, 2010, MNRAS, 406, 2578
- [] Owen F.N., Rudnick L., 1976, ApJ, 205L, 1
- [] Parma P., de Ruiter H.R., Mack K.-H., van Breugel W., Dey A., Fanti R., Klein U., 1996, A&A, 311, 49
- [] Peng B., Strom R.G., Wei J., Zhao Y.H., 2004, A&A, 415, 487
- [] Safouris V., Subrahmanyan R., Bicknell G.V., Saripalli L., 2009, MNRAS, 393, 2
- [] Saikia D.J., Jamrozy M., 2009, BASI, 37, 63
- [] Saripalli L., Gopal-Krishna, Reich W., Kühr H., 1986, A&A, 170, 20
- [] Schoenmakers A.P., de Bruyn A.G., Röttgering H.J.A., van der Laan H., 1999, A&A, 341, 44
- [] Schoenmakers A.P., Mack K.-H., de Bruyn A.G., Röttgering H.J.A., Klein U., van der Laan H., 2000, A&AS, 146, 293
- [] Spergel D.N. et al., 2003, ApJS, 148, 175
- [] Strom R.G., Willis A.G., 1980, A&A, 85, 36
- [] Subrahmanyan R., Saripalli L., Safouris V., Hunstead R.W., 2008 ApJ, 677, 63
- [] Vigotti M., Grueff G., Perley R., Clark B.G., Bridle A.H., 1989, AJ, 98, 419