Breath Figures: Nucleation, Growth, Coalescence,
and the Size Distribution of Droplets
Abstract
The analysis of the size distribution of droplets condensing on a substrate (breath figures) is a test ground for scaling theories. Here, we show that a faithful description of these distributions must explicitly deal with the growth mechanisms of the droplets. This finding establishes a gateway connecting nucleation and growth of the smallest droplets on surfaces to gross features of the evolution of the droplet size distribution.
pacs:
05.65.+b,89.75.Da,68.43.JkClassical questions regarding breath figures involve the influence of material defects and impurities on the droplet patterns Rayleigh (1911); Baker (1922); Lopez et al. (1993); Lepopoldes and Damman (2006); Sikarwar et al. (2011). Presently, they are used as self-assembling templates in micro-fabrication Böker et al. (2004); Haupt et al. (2004); Lepopoldes and Damman (2006); Wang et al. (2007); Rykaczewski et al. (2011); Samuel et al. (2011), as highly efficient means for heat exchange in cooling systems Mei et al. (2011); Sikarwar et al. (2011); Leach et al. (2006); Rose and Glicksman (1973), and they are promising candidates for water recovery in (semi-)arid regions Lekouch et al. (2011); Nikolayev et al. (1996). For these applications a detailed knowledge of the droplet size distribution and the average droplet growth speed is vital. Here, we demonstrate that the state of the art scaling theory Beysens et al. (1991); Meakin (1992); Viovy et al. (1988); Family and Meakin (1989); Blackman and Brochard (2000) fails to describe data from simulations111Full details on the numerical method as well as raw data and a [MOVIE] of the evolution are provided in the [SUPPLEMENTARY MATERIAL]. and laboratory experiments 222Droplet patterns are obtained from water droplets suspended from a polyethylene film covering a glass plate kept at a temperature of which is placed about cm atop a water bath with a temperature of . Details on the experimental method as well as raw data and a [MOVIE] of the evolution are provided in the [SUPPLEMENTARY MATERIAL]., Fig. 1. A faithful description must therefore explicitly address the microscopic growth mechanisms of droplets.
Classical scaling Beysens et al. (1991); Meakin (1992) asserts that on clean surfaces the coagulation of droplets organizes the systems into a state where the number of droplets, , per unit droplet volume and surface area takes a universal scaling form,
| (1a) | |||
| Here denotes the droplet volume, is a scaling exponent, is a dimensionless function, and is the volume of the largest droplets encountered at time , i.e., the average volume of droplets in the bump of the distributions shown in Fig. 1. | |||
Since has a dimension of length to the power the exponent must be set to a value of Viovy et al. (1988); Family and Meakin (1989); Meakin (1992). The time evolution of is found by observing that the total volume of all droplets grows linearly in time when a constant volume flux impinges onto the surface. In agreement with experimental and numerical observation Viovy et al. (1988); Family and Meakin (1989); Meakin (1992) this entails . Moreover, a lower cutoff to the scaling at a scale has been accounted for by a polydispersity exponent Cueille and Sire (1997). For our numerical scheme, where the mass flux onto the surface is implemented as sustained addition of droplets of size to random positions of the surface and where overlapping droplets are subsequently merged Note (2), it was predicted Blackman and Brochard (2000) to be
| (1b) |
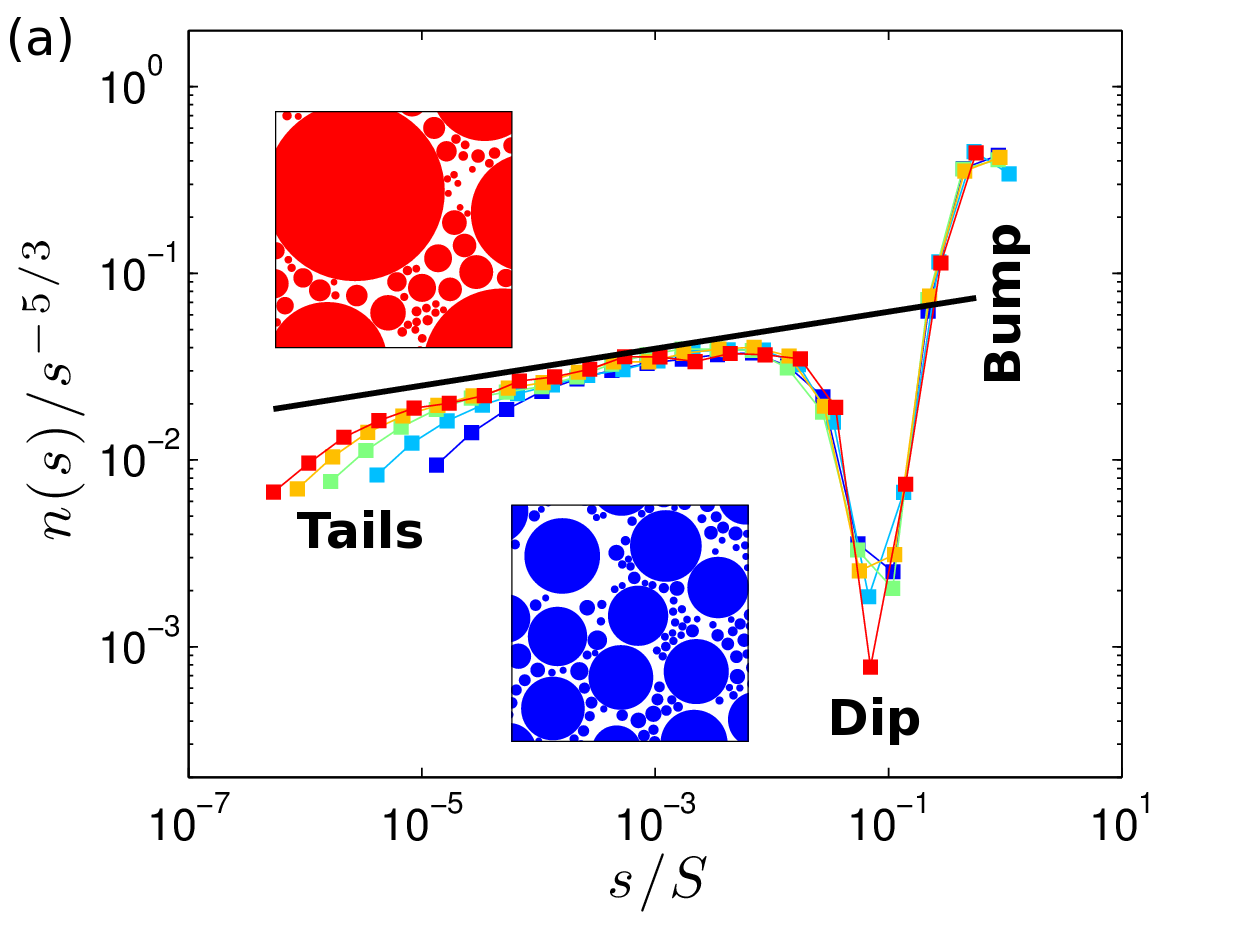
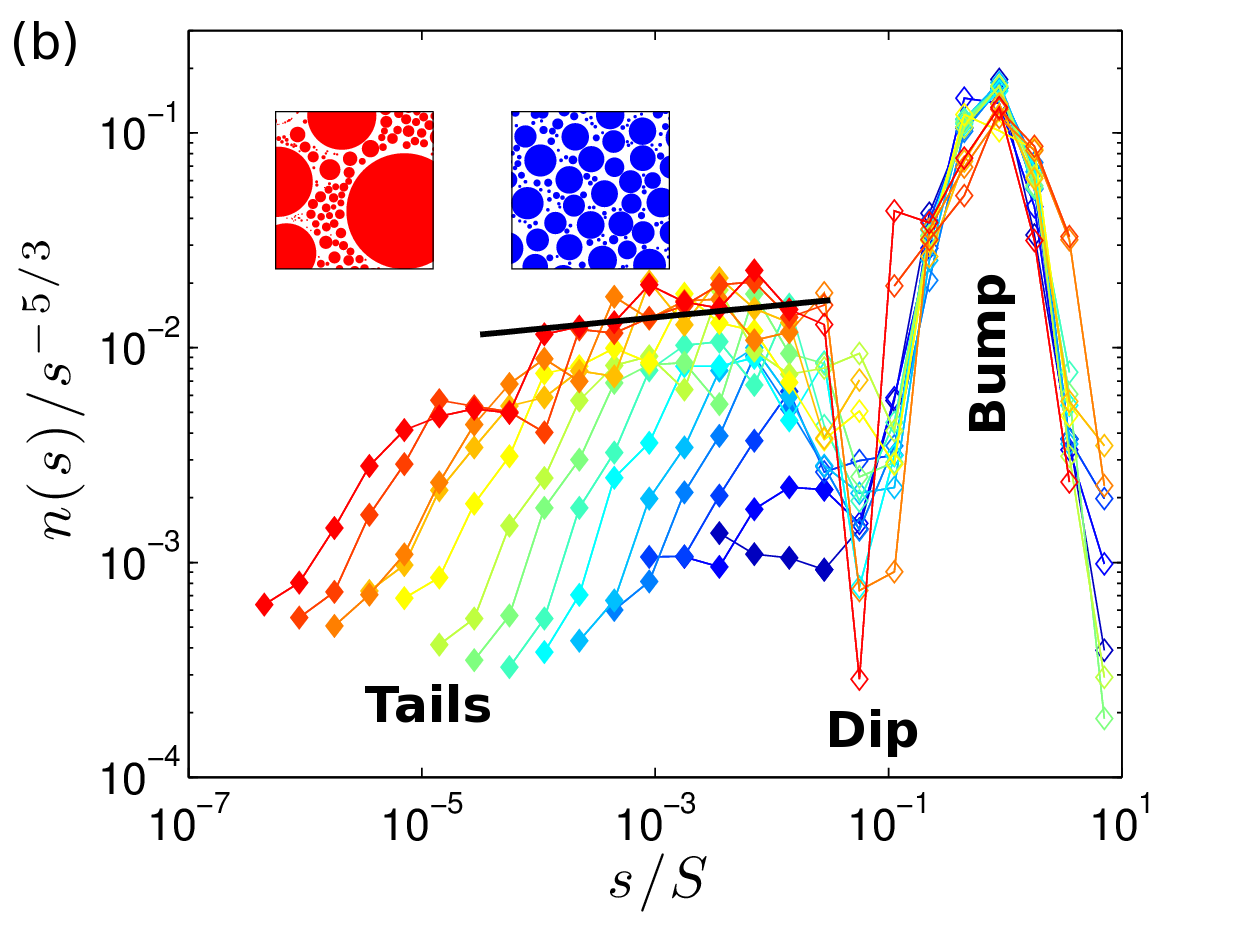
The scaling, Eq. (1a), provides an excellent data collapse of the bump and the dip of the numerical, Fig. 1(a), and the experimental data, Fig. 1(b). Beyond the dip one can discern a self-similar scaling regime, Eq. (1b), in the numerical data, and in only those experimental data with the vastest range of droplet sizes. On the other hand, in either case — and particularly pronounced in the experimental data — noticeable deviations, tails, from the scaling prediction arise for small values of .
In the following, we show that these deviations result from features of droplet growth at the small length scale, . Similar to the approaches in the theory of critical phenomena Kadanoff et al. (1967); Hilfer (1992) or of the effect of rough boundaries in turbulent flows Barenblatt and Chorin (2004); Goldenfeld (2006), scaling will be recovered by asymptotic analysis Barenblatt (2003), which allows us to explicitly account for different growth mechanisms of small droplets. Universal and non-universal features of the asymptotic droplet density distribution will be disentangled by discussing the consequences of the different growth mechanisms for the small droplets in the numerical and experimental setting, respectively.
Relation to fractal packings.—
To explore the role of the lower cutoff of scaling we consider the droplet arrangement in breath figures as an example of a fractal packing of disks (see Herrmann et al (1991–2012); Amirjanov and Sobolev (2006); Varratoa and Foffia (2011) for recent applications in other fields), and adopt scaling arguments developed to characterize (disordered) fractal structures to the problem at hand: We assert that in the scale-separation limit, , the free surface area, i.e., the area not covered by droplets, approaches a fractal with a fractal dimension . Self-similarity with fractal dimension amounts then to the statement that in an area of size a number
| (2) |
of regions of size are required to cover the complement of the surface area covered by all droplets larger than . The fraction of this area in the considered domain of size amounts to
| (3) |
Following Herrmann et al (1991–2012) we denote the surface area not covered by droplets as porosity, . It is obtained by evaluating Eq. (3) for the size characterizing the small scale cutoff of the fractal, .
By its definition the porosity is related the area covered by droplets in a region of area via : when the surface area in between droplets approaches a fractal of zero measure one obtains
where denotes the area covered by droplets of size . Using Eq. (1b) with , Eq. (1b), , and introducing one obtains
| (4) | |||||
and comparing Eqs. (4) and (3) yields
| (5) |
Hence, the nontrivial scaling, Eq. (1b), of for small reflects the fractality of the arrangements of droplets in breath figures with a large scale separation , that can faithfully be regarded as a fractal.
This provides an independent, more accurate, means to test the polydispersity exponent: For and , Eq. (4) implies Remarkably, none of our data follow this prediction [Figs. 1(b) and 5(b) in the supplementary material]: Rather than we find for the numerical, and for the experimental data.
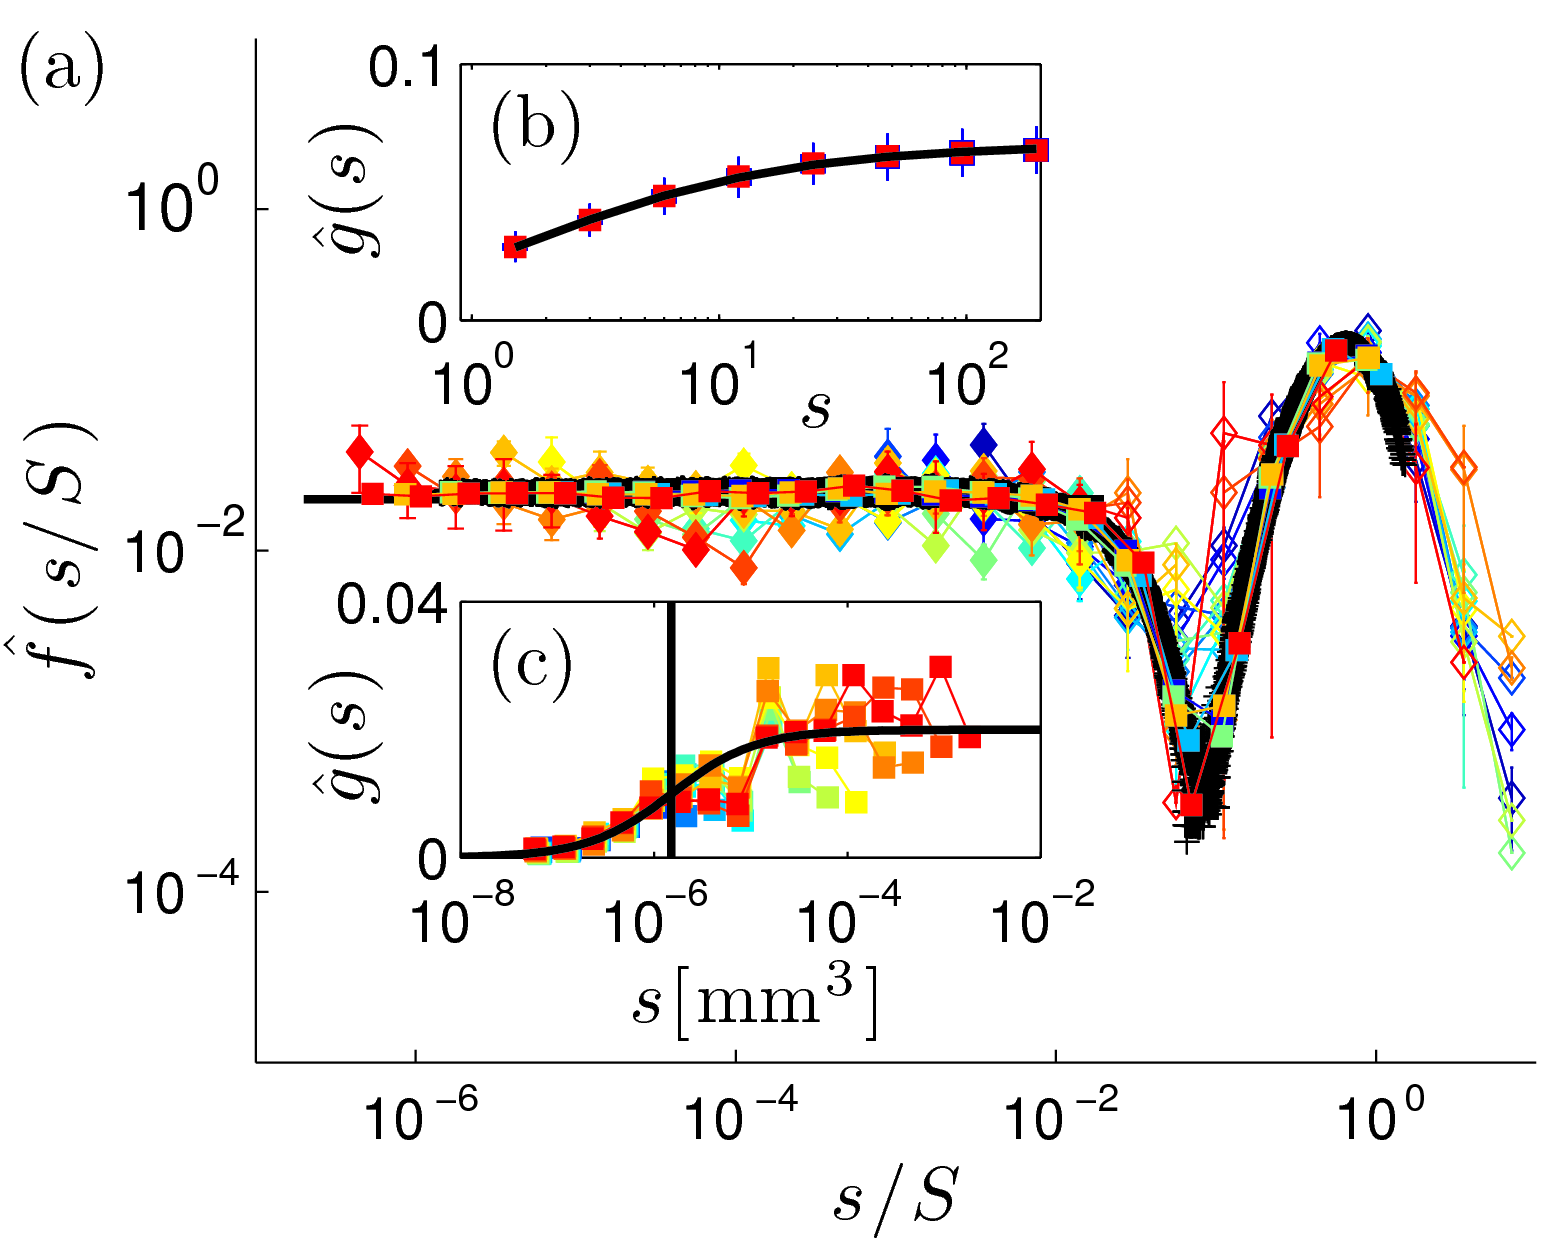
Hence, the different microphysics of droplet growth and merging leads to (slightly) different fractal dimensions and a different small-scale cutoff of scaling. To disentangle the intermediate self-similar scaling regime from the large scale (arising from the first generation of droplets, cf. Fritter et al. (1991)) and the small scale physics we introduce cutoff functions and for large and small droplets, respectively: takes a constant value for , and it accounts for the dip and the bump in for . Similarly, accounts for the tails of . As shown in the insets of Fig. 2 it approaches constant values for , and it takes a scaling form for all times. To arrive at a complete description of the droplet size distribution we further discuss now this lower cutoff.
Incorporating the lower cutoff.—
We start by writing the total volume of droplets of size per unit volume and unit surface area in the form
| (6) |
This expression states that in the scaling regime the overall volume of droplets of size on an area of size is proportional to the number of droplets, Eq. (2), of the considered size.
In equation (6) the fractal dimension and the function are not universal. We henceforth adopt the values for determined by fitting the porosity, and we follow the evolution of droplets smaller than over a small time interval from to in order to relate the form of to different nucleation and growth mechanisms of small droplets. Let the considered area on the substrate and the time interval be chosen such that this growth is not influenced by the merging of droplets larger than . When is so small that takes the constant value , Eq. (6) entails
In order to determine we observe that the volume density of the droplets smaller than amounts to the cumulative distribution
| (7) | |||||
For values of in the scaling regime the increase of volume is accounted for by increasing the integral domain. Therefore, an infinitesimal increase of to in the time interval amounts to an increase of the volume density of droplets,
| (8a) | |||||
| On the other hand, this change must be due to the volume flux onto the fraction of area covered by droplets, | |||||
| (8b) | |||||
Equating the expressions for , Eqs. (8b), and dropping the subscript , one hence obtains
| (9) |
This expression provides the desired connection of the average speed of the growth of droplets of size to the form of the small-scale cutoff of : it explains how different microscopic droplet growth laws give rise to different non-universal cutoff functions , and how the universal scaling is recovered for . After all, the volume growth of large droplets in breath figures is always proportional to the area exposed to the surface flux Beysens et al. (1991); Meakin (1992); Blackman and Brochard (2000), . Equation (9) allows us to disentangle universal and non-universal contributions to . This major finding of our theoretical treatment is now substantiated by working out the multiscaling predictions for the data shown in Fig. 1.
Scaling numerical data.—
When a small droplet, of size , is been added to the surface, it is merged with a droplet on the surface when the droplets overlap. As a consequence, a droplet of radius will capture small droplets of radius , that are added in a distance smaller than from its center. In the absence of other droplets, this growth amounts to
The term in square brackets accounts for an enhanced growth of small droplets , which ceases rapidly for increasing . In practice the decay is even faster since the capture regions of neighboring droplets overlap. To fit the simulation data, Fig. 2(b), one therefore needs a non-trivial prefactor and an exponent close to rather than ,
| (10) |
Using Eq. (6) and this provides a perfect data collapse of all numerical data, Fig. 2(a).
Scaling experimental data.—
In the experimental setting, the growth rate of the droplets has two contributions. For small droplets, growth is limited by the diffusion of water molecules on the substrate towards the contact line of the droplet. As derived in Rogers et al. (1988) and observed in the experiments of Fritter et al. (1991), the radius of small droplets grows then like , such that For larger droplets, the volume flux from the vapor phase onto the droplets is again proportional to the exposed droplet surface, such that These growth contributions combine to
| (11) |
where is the crossover size scale and is a normalization constant. Inserting Eq. (11) into Eq. (9) provides an excellent prediction for , Fig. 2(c). Also for the experimentally measured droplet size distributions one hence obtains a perfect data collapse of the appropriately scaled droplet number density for all different times, Fig. 2(a).
Discussion.—
For the numerical data, amounts to the volume of the smallest droplets in the system, Fig. 2(b), and for the experimental data it is about one order of magnitude larger than the smallest observed droplets, Fig. 2(c). In either case saturates for . On the other hand the scaling behavior Eq. (1b) is only accessible for values of below the dip of the distribution, i.e., for . It can hence only be resolved in simulations where , resulting in the observed scaling regime of about – decades, in the numerical data, Fig. 1(a), and in the experimental data with the largest accessible scale separation, Fig. 1(b).
Due to the relatively small scaling range the droplet size distribution of breath figures can not merely be idealized as a self-similar process with a single relevant length scale Viovy et al. (1988); Family and Meakin (1989); Beysens et al. (1991); Meakin (1992). Rather one explicitly has to cope with the growth law of the smallest droplets in the system. Via its (slight) effect on the fractal dimension characterizing the free space in between the droplets, Eq. (5), it sets the value of the polydispersity exponent , and it leads to massively different cutoff functions , Fig. 2(b,c), that can completely dominate the shape of the droplet size distribution, Fig. 1(b).
When both the large scale and the small scale cutoffs are properly accounted for via Eqs. (10) and (11), a remarkable data collapse of all experimental and numerical data into a single plot is achieved, Fig. 2(a). This recovery of scaling, establishes a novel gateway connecting features of the microscopic droplet growth on surfaces to gross features of the evolution of the droplet size distribution.
Acknowledgements.
We are grateful to Bruno Eckhardt, Jens Eggers, Franziska Glaßmeier, Walter Goldburg, Siegfried Großmann, Andrew Scullion, and Stephan Herminghaus for valuable discussions, and to our referee for very valuable feedback on the manuscript.References
- Rayleigh (1911) Rayleigh, Nature 86 (1911); J. Aitken, Nature 90 (1913).
- Baker (1922) T. Baker, Phil. Mag. Ser. 6 44, 752 (1922).
- Lopez et al. (1993) G. P. Lopez, H. A. Biebuyck, C. D. Frisbie, and G. M. Whitesides, Science 260, 647 (1993).
- Lepopoldes and Damman (2006) J. Lepopoldes and P. Damman, Nature Mat. 5, 957 (2006).
- Sikarwar et al. (2011) B. S. Sikarwar, N. K. Battoo, S. Khandekar, and K. Muralidhar, J. Heat Transfer 133, 021501 (2011).
- Böker et al. (2004) A. Böker, et al., Nature Mat. 3, 302 (2004).
- Haupt et al. (2004) M. Haupt, S. Miller, R. Sauer, K. Thonke, A. Mourran, and M. Moeller, J. Appl. Phys. 96, 3065 (2004).
- Wang et al. (2007) Y. Wang, A. S. Özcan, C. Sanborn, K. F. Ludwig, and A. Bhattacharyya, J. Appl. Phys. 102, 073522 (2007).
- Rykaczewski et al. (2011) K. Rykaczewski, J. Chinn, M. L. Walker, J. H. J. Scott, A. Chinn, and W. Jones, ACS Nano 5, 9746 (2011).
- Samuel et al. (2011) A. Z. Samuel, S. Umapathy, and S. Ramakrishnan, ACS Applied Materials and Interfaces 3, 3293 (2011).
- Mei et al. (2011) M. Mei, B. Yu, M. Zou, and L. Luo, Int. J. Heat Mass Transf. 54, 2004 (2011).
- Leach et al. (2006) R. N. Leach, F. Stevens, S. C. Langford, and J. T. Dickinson, Langmuir 22, 8864 (2006).
- Rose and Glicksman (1973) J. W. Rose and L. R. Glicksman, Int. J. Heat Mass Transf. 16, 411 (1973).
- Lekouch et al. (2011) I. Lekouch, et al., Energy 36, 2257 (2011).
- Nikolayev et al. (1996) V. Nikolayev, et al., J. Hydrology 182, 19 (1996).
- Beysens et al. (1991) D. Beysens, A. Steyer, P. Guenoun, D. Fritter, and C. Knobler, Phase Transitions 31, 219 (1991).
- Meakin (1992) P. Meakin, Rep. Prog. Phys. 55, 157 (1992).
- Viovy et al. (1988) J. L. Viovy, D. Beysens, and C. M. Knobler, Phys. Rev. A 37, 4965 (1988).
- Family and Meakin (1989) F. Family and P. Meakin, Phys. Rev. A 40, 3836 (1989).
- Blackman and Brochard (2000) J. A. Blackman and S. Brochard, Phys. Rev. Lett. 84, 4409 (2000).
- Note (2) Full details on the numerical method as well as raw data and a [MOVIE] of the evolution are provided in the [SUPPLEMENTARY MATERIAL].
- Note (1) Droplet patterns are obtained from water droplets suspended from a polyethylene film covering a glass plate kept at a temperature of which is placed about cm atop a water bath with a temperature of . Details on the experimental method as well as raw data and a [MOVIE] of the evolution are provided in the [SUPPLEMENTARY MATERIAL].
- Cueille and Sire (1997) S. Cueille and C. Sire, Phys. Rev. E 55, 5465 (1997).
- Kadanoff et al. (1967) L. P. Kadanoff, et al., Rev. Mod. Phys. 39, 395 (1967).
- Hilfer (1992) R. Hilfer, Phys. Rev. Lett. 68, 190 (1992).
- Barenblatt and Chorin (2004) G. I. Barenblatt and A. J. Chorin, PNAS 101 (2004).
- Goldenfeld (2006) N. Goldenfeld, Phys. Rev. Lett. 96, 044503 (2006).
- Barenblatt (2003) G. I. Barenblatt, Scaling (Cambridge UP, 2003).
- Herrmann et al (1991–2012) H. J. Herrmann, G. Mantica, and D. Bessis, Phys. Rev. Lett. 65, 3223 (1990); S. S. Manna and H. J. Herrmann, J. Phys. A: Math. Gen. 24, L481 (1991); S. D. S. Reis, N. A. M. Araújo, J. S. Andrade jr., and H. J. Herrmann, EPL 97, 18004 (2012).
- Amirjanov and Sobolev (2006) A. Amirjanov and K. Sobolev, Modelling and Simulation in Materials Science and Engineering 14, 789 (2006).
- Varratoa and Foffia (2011) F. Varratoa and G. Foffia, Mol. Phys. 109, 2663 (2011).
- Fritter et al. (1991) D. Fritter, C. M. Knobler, and D. A. Beysens, Phys. Rev. A 43, 2858 (1991).
- Rogers et al. (1988) T. M. Rogers, K. R. Elder, and R. C. Desai, Phys. Rev. A 38, 5303 (1988).