11email: lorenzo.morelli@unipd.it 22institutetext: INAF-Osservatorio Astronomico di Padova, vicolo dell’Osservatorio 2, I-35122 Padova, Italy
33institutetext: Space Telescope Science Institute, 3700 San Martin Drive, Baltimore, MD 21218, USA
Gas-phase metallicity of 27 galaxies at intermediate redshift††thanks: Based on observations made with ESO Telescopes at the La Silla-Paranal Observatory under programmes 075.B-0794 and 077.B-0767.
Abstract
Aims. The purpose of this work is to make available new gas-phase oxygen abundance measurements for a serendipitous sample of 27 galaxies with redshifts .
Methods. We measured the equivalent widths of the [O ii], , and [O iii] emission lines observed in the galaxy spectra obtained with the Visible Multi-Object Spectrograph mounted at the Very Large Telescope. For each galaxy, we derived the metallicity-sensitive emission-lines ratio R23, ionization-sensitive emission-lines ratio O32, and gas-phase oxygen abundance .
Results. The values of the gas-phase oxygen abundance that we obtained for all the sample galaxies are consistent with previous findings for galaxies at intermediate redshift.
Key Words.:
Galaxies: distances and redshifts – Galaxies: evolution – Galaxies: formation – Galaxies: fundamental parameters – Galaxies: ISM1 Introduction
The gas-phase metallicity is one of the most important observational diagnostics of the current evolutionary state of galaxies. Accurate gas-phase metallicity measurements are crucial for investigating the interplay between fundamental processes, such as star formation, gas accretion, gas flows, and supernova-driven winds occurring during the life of galaxies (e.g., Moustakas et al., 2011; Cresci et al., 2012; Sommariva et al., 2012).
The galaxy gas-phase metallicity correlates with many properties, such as the star formation rate (Mannucci et al., 2010; Lara-López et al., 2010), morphological type (Edmunds & Pagel, 1984), surface mass density (Ryder, 1995; Garnett et al., 1997), and maximum rotation velocity (Dalcanton, 2007). In particular, the metallicity most strongly correlates with the mass and -band luminosity of the galaxy (McClure & van den Bergh, 1968; Skillman et al., 1989; Richer & McCall, 1995). Adopting the Sloan Digital Sky Survey (SDSS, Abazajian et al. 2009), Tremonti et al. (2004) and Gallazzi et al. (2005) derived the and relations in the local Universe for a large sample of galaxies on the basis of the gas-phase metallicity. These relations are very tight with a scatter of less than 0.1 dex and show that the more luminous galaxies have higher gas metallicities than their fainter counterparts, which has a great impact on the theoretical models of galaxy formation.
Another crucial piece of information to help us to understand the assembly history of galaxies comes from the study of the evolution of the and relations across cosmic time.
This topic has been investigated by measuring the gas-phase metallicity of galaxies as a function of redshift up to . While these relations show clear evidence of galactic evolution at high , because at a given mass higher- galaxies have lower metallicities (Shapley et al., 2004; Erb et al., 2006; Maiolino et al., 2008; Mannucci et al., 2009; Rodrigues et al., 2012), at intermediate redshift () it is still debated whether there has been any evolution. Carollo & Lilly (2001) and Kobulnicky & Kewley (2004) found that the relation at intermediate redshift is consistent with the local one. In contrast, Maier et al. (2005), Savaglio et al. (2005), and Zahid et al. (2011) measured lower metallicities for intermediate-redshift objects than for local galaxies, supporting a scenario in which the and relations also evolve over the range of redshifts between and .
In this research note, we therefore present new measurements of the equivalent widths for the [O ii], , [O iii], and [O iii] emission-lines and present our derived metallicity-sensitive emission lines ratios R23, ionization-sensitive emission-lines ratios O32, and gas-phase oxygen abundances for 27 intermediate-redshift () galaxies. The data that we analised for all the sample galaxies are available from the SDSS archive, hence our measurements are a valuable supplementary resource for the astronomical community.
2 Observations and data reduction
As often happens, the data acquired for a particular aim can potentially contain information useful for different purposes. For this work, we used observations carried out in 2006 at the Very Large Telescope (VLT) of the European Southern Observatory (ESO) at Paranal Observatory using the VIsible Multi-Object Spectrograph (VIMOS). The main goal of these observations was to find satellites in the region of surrounding seven nearby isolated spiral galaxies (Yegorova et al., 2011).
VIMOS was used in Multi Object Spectroscopy (MOS) mode with the grism “HR orange” and the order sorting-filter GG435. The grism is characterized by a reciprocal dispersion of and a spectral resolution of for the adopted slit. In the high-resolution configuration that we used for the observations, the spectral range strongly depends on the position of the slit in the field of view varying from to . The full dataset includes MOS observations of 7 different fields for a total exposure time of hours. This granted a typical exposure time of hours for each target field. Each of the four quadrants of VIMOS observed objects so as to have galaxies within each field of view of .
The observed sample consists of 1450 objects with SDSS band magnitudes ranging from 17 mag to 24 mag and a modal value of 22 mag. As expected, only a small fraction of the target galaxies were found to be satellites. We focused on the remaining 1347 background and foreground objects to measure their gas-phase metallicities. Their spectra were bias-subtracted, corrected for flat-field effect, cleaned of cosmic rays, and wavelength-calibrated by means of the ESO VIMOS data reduction pipeline. A more detailed description of the data reduction is reported in Yegorova et al. (2011).
3 Sample selection
To estimate the gas-phase metallicity, it is necessary to know the electron temperature provided by the comparison between auroral and nebular emission lines (Osterbrock, 1989). However, since auroral lines are generally weak, it is difficult to observe them in distant galaxies. To overcome this issue, empirical relations between the intensity of the nebular lines and metallicity have been used to derive the gas-phase metallicity. The most widely used metallicity indicator is the R23 emission lines ratio parameter (Pagel et al., 1979) defined as
| (1) |
For our analysed dataset the signal-to-noise ratio () of the spectra allowed us to measure redshifts for only 571 objects out of the observed 1347 galaxies. We fitted all the available emission lines with Gaussians. The [O ii] doublet was modelled with two Gaussians of the same full width at half maximum. The galaxy redshift was computed as the average of the redshifts derived from the central wavelengths of the measured emission lines.
We detected 177 galaxies in the redshift range between and . However, most of their spectra did not map all the [O ii], , and [O iii] emission-lines we needed to compute the metallicity-sensitive emission-lines ratio R23, ionization-sensitive emission lines ratio O32, and gas-phase oxygen abundance , because of their actual position in the VIMOS field of view. All the relevant emission lines fall in the observed spectral range only for 27 objects, which represent our final sample of galaxies. They are listed in Table LABEL:tab:values and the distribution of their measured redshifts is shown in Figure 1.

| Galaxy name | [O ii] | [O iii] | [O iii] | ||
|---|---|---|---|---|---|
| SDSS | [] | [] | [] | [] | |
| (1) | (2) | (3) | (4) | (5) | (6) |
| J003845.31+000006.8 | |||||
| J003838.68+000225.1 | |||||
| J003806.59+000421.9 | |||||
| J134235.94+014424.1 | |||||
| J134229.37+015244.5 | |||||
| J134156.84+014241.0 | |||||
| J145221.51+043448.8 | |||||
| J145150.75+044111.6 | |||||
| J145147.24+043654.2 | |||||
| J145156.20+043321.7 | |||||
| J145147.77+043244.5 | |||||
| J145149.20+043501.6 | |||||
| J152638.18+034353.8 | |||||
| J152630.18+035110.8 | |||||
| J152559.83+035249.3 | |||||
| J152606.03+034530.7 | |||||
| J154933.50-004255.0 | |||||
| J154931.48-003406.1 | |||||
| J154925.24-003717.8 | |||||
| J154914.49-004010.2 | |||||
| J154925.12-003645.4 | |||||
| J222013.98-074355.8 | |||||
| J222014.86-073333.7 | |||||
| J221934.90-073825.9 | |||||
| J221941.85-074703.8 | |||||
| J221939.28-074744.5 | |||||
| J221941.90-074825.7 |
NOTES: Col. (1): SDSS name of the galaxy. Col.(2-5): Equivalent widths of the [O ii], , [O iii], and [O iii] emission lines, respectively. Col.(6): Measured redshift.
4 Data analysis and gas-phase metallicity
The apparent -band Petrosian magnitudes of the sample galaxies range between and , as they were derived from the SDSS DR7. Since the of the spectra was too low to derive the radial distribution of the gas metallicity, we rebinned the spectra along the spatial direction to obtain a per resolution element.
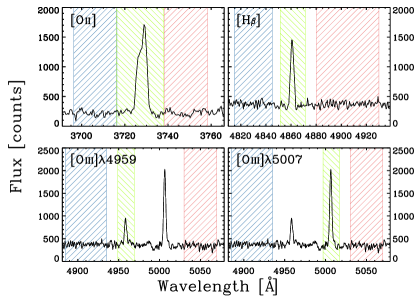
Since no spectrophotometric standard star had been observed, the galaxy spectra were not flux-calibrated. Furthermore, the observed spectral range does not include the emission line and thus a reliable reddening estimation was not possible. For the above reasons, we followed the approach suggested by Kobulnicky & Phillips (2003) by replacing the flux of the emission-lines with their equivalent width when measuring the gas-phase metallicity. This method does not need flux-calibrated spectra and has the further advantage of being insensitive to reddening. In addition, Kobulnicky & Phillips (2003) verified that the error associated with the use of the emission-line equivalent widths is smaller than both the typical error in the flux measurement and systematic error in the R23 and calibrations. Thus, we measured the equivalent widths of the [O ii], , and [O iii] emission lines in the-rest frame spectra. For each emission line, we considered a central bandpass covering the feature of interest and two adjacent bandpasses, at the red and blue side, tracing the local continuum. The continuum level underlying the emission line was estimated by interpolating a straight line in the continuum bandpasses. The bandpasses were defined following Fisher et al. (1998) for [O ii] and Gonzalez (1993) for , [O iii], and [O iii]. The bandpasses are listed in Table LABEL:tab:ewregions and shown in Figure 2. The errors associated with the measured equivalent widths were derived from photon statistics and CCD read-out noise, and calibrated by means of Monte Carlo simulations.
A well-known problem in measuring the equivalent width of the emission line in galaxies is the contamination by the absorption line. We tried to address this issue by using GANDALF (Gas AND Absorption Line fitting; Sarzi et al. 2006) to fit the galaxy spectra with synthetic stellar population models, as done by Morelli et al. (2008, 2012). A linear combination of template stellar spectra from the ELODIE library by Prugniel & Soubiran (2001) was convolved with the line-of-sight velocity distribution and fitted to the observed galaxy spectrum by minimization in pixel space. However, the low of the stellar continuum of the galaxy spectra prevented us from deriving a reliable combination of stellar templates to fit the galaxy stellar component. Therefore, to account for the absorption-line contamination we followed Kobulnicky & Kewley (2004) by applying a correction of 2 (Kobulnicky & Phillips, 2003) to the measured equivalent width of the emission line used to derive the gas-phase metallicity.
All the equivalent widths measured for the galaxies in our sample are reported in Table LABEL:tab:values. They were used to compute the metallicity-sensitive emission-line ratio R23, as well as the emission-line ratio O32 defined by Kobulnicky & Kewley (2004) as
| (2) |
which is mostly sensitive to the ionization (Nagao et al., 2006). All the values of log(R23) and log(O32) are listed in Table LABEL:tab:values_met.
For the sample galaxies, we could not derive the [N ii] ratio, thus it was impossible to break the R23 degeneracy. Following Kobulnicky & Zaritsky (1999) and Kobulnicky et al. (2003), we assumed that all the galaxies lie in the upper branch () of the R23-O/H relation. We then checked the consistency of this assumption by adopting the [O iii]/[O ii] diagnostic lines ratio as proposed by Maiolino et al. (2008). As done by Kobulnicky & Kewley (2004), we derived the gas-phase oxygen abundance by averaging the values obtained from the calibrations for the upper branch given in McGaugh (1991) and Kewley & Dopita (2002). The values of and their uncertainties, owing to the statistical measurement errors in the equivalent widths, are listed in Table LABEL:tab:values_met. The systematic errors due to the uncertainties in the photoionization models ( dex; Kennicutt et al., 2003; Garnett et al., 2004) were not taken into account.
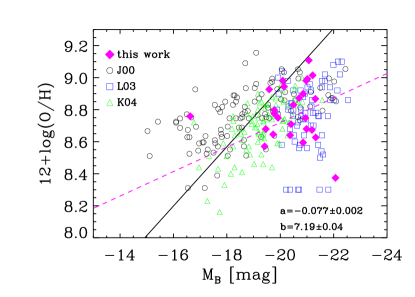
In Figure 3, we plot the oxygen abundance as a function of the absolute magnitude in the -band for the sample galaxies. We derived from the rest-frame -band Petrosian magnitude given in the SDSS DR7, using the transformation (Chonis & Gaskell, 2008). The resulting values are given in Table LABEL:tab:values_met. We also plotted the data for local (Nearby Field Galaxy Sample, Jansen et al. 2000; SDSS, Tremonti et al. 2004) and intermediate-redshift galaxies (Canada-France Redshift Survey, Lilly et al. 2003; GOODS-North Field, Kobulnicky & Kewley 2004).
The dashed magenta line in Figure 3 represents the linear fit to the sample galaxies. J154925.24-003717.8 and J003806.59+000421.9 are two outliers in the distribution. The most prominent outlier is the faintest galaxy of the sample, for which the assumption of an upper R23-O/H branch could be incorrect (Skillman et al., 1989). Adopting the calibration of Kewley & Dopita (2002) for the lower branch, we obtained a value of . However only the measurement of the [N ii] ratio could firmly help us to discriminate between the two branches. The second outlier has an extremely low value of the gas-phase metallicity. This is probably due to an underestimation of the absorption-line correction. The slope and zero-point of the fitted relation to our data points (calculated after excluding the two outliers) are consistent within the errors with the slope and zero-point obtained by Kobulnicky & Kewley (2004) for their sample of galaxies in the redshift range . This was expected since 23 of our 27 galaxies have a redshift in the range , and confirms their findings of an evolution in the relation since intermediate redshift.
Finally, we estimated the star formation rate (SFR) of the sample galaxies from their band absolute magnitudes and equivalent widths according to the relations of Kennicutt et al. (2003) and Kobulnicky & Kewley (2004)
| (3) |
The derived SFRs are reported in Table LABEL:tab:values_met.
| Galaxy name | log(R23) | log(O32) | SFR | ||
|---|---|---|---|---|---|
| SDSS | [mag] | [M⊙ yr-1] | |||
| (1) | (2) | (3) | (4) | (5) | (6) |
| J003845.31+000006.8 | |||||
| J003838.68+000225.1 | |||||
| J003806.59+000421.9 | |||||
| J134235.94+014424.1 | |||||
| J134229.37+015244.5 | |||||
| J134156.84+014241.0 | |||||
| J145221.51+043448.8 | |||||
| J145150.75+044111.6 | |||||
| J145147.24+043654.2 | |||||
| J145156.20+043321.7 | |||||
| J145147.77+043244.5 | |||||
| J145149.20+043501.6 | |||||
| J152638.18+034353.8 | |||||
| J152630.18+035110.8 | |||||
| J152559.83+035249.3 | |||||
| J152606.03+034530.7 | |||||
| J154933.50-004255.0 | |||||
| J154931.48-003406.1 | |||||
| J154925.24-003717.8 | |||||
| J154914.49-004010.2 | |||||
| J154925.12-003645.4 | |||||
| J222013.98-074355.8 | |||||
| J222014.86-073333.7 | |||||
| J221934.90-073825.9 | |||||
| J221941.85-074703.8 | |||||
| J221939.28-074744.5 | |||||
| J221941.90-074825.7 |
NOTES:Col.(2): Absolute -band magnitude from SDSS DR7 derived adopting the measured redshift. Col.(3): Metallicity-sensitive R23 parameter. Col.(4): Ionization-sensitive O32 parameter. Col.(5): Gas-phase oxygen abundance. Col.(6): Star formation rate as derived using the uncorrected for stellar absorption line.
5 Conclusion
Our original purpose was to explore the evolution of the relation of Tremonti et al. (2004) to the intermediate-redshift range using a large number of background galaxies in very deep VIMOS data. After combining all the constraints needed to perform our analysis, the number of objects dramatically decreased from 1347 to 27, preventing us from being able to draw any conclusion about the possible evolution of the relation with redshift. Here, we have reported the measured equivalent widths of the [O ii], , [O iii], and [O iii] emission lines, the values of the metallicity-sensitive emission-line ratio R23, the ionization-sensitive emission-line ratio O32, and the gas-phase oxygen abundances derived for the serendipitous sample of 27 galaxies with the aim of making them available to the community. Our measurements are consistent with those of Lilly et al. (2003) and Kobulnicky & Kewley (2004) for galaxies in the redshift range .
Acknowledgements.
We thank the anonymous referee for comments that improved the completeness of this paper. This work was supported by Padua University through the grants CPDA089220/08, 60A02-5934/09, and 60A02-1283/10 and by the Italian Space Agency through the grant ASI-INAF I/009/10/0. L.M. acknowledges financial support from Padua University grant CPS0204. V. C. is grateful to STScI for hospitality during the preparation of this paper.References
- Abazajian et al. (2009) Abazajian, K. N., Adelman-McCarthy, J. K., Agüeros, M. A., et al. 2009, ApJS, 182, 543
- Carollo & Lilly (2001) Carollo, C. M. & Lilly, S. J. 2001, ApJ, 548, L153
- Chonis & Gaskell (2008) Chonis, T. S. & Gaskell, C. M. 2008, AJ, 135, 264
- Cresci et al. (2012) Cresci, G., Mannucci, F., Sommariva, V., et al. 2012, MNRAS, 421, 262
- Dalcanton (2007) Dalcanton, J. J. 2007, ApJ, 658, 941
- Edmunds & Pagel (1984) Edmunds, M. G. & Pagel, B. E. J. 1984, MNRAS, 211, 507
- Erb et al. (2006) Erb, D. K., Shapley, A. E., Pettini, M., et al. 2006, ApJ, 644, 813
- Fisher et al. (1998) Fisher, D., Fabricant, D., Franx, M., & van Dokkum, P. 1998, ApJ, 498, 195
- Gallazzi et al. (2005) Gallazzi, A., Charlot, S., Brinchmann, J., White, S. D. M., & Tremonti, C. A. 2005, MNRAS, 362, 41
- Garnett et al. (2004) Garnett, D. R., Kennicutt, Jr., R. C., & Bresolin, F. 2004, ApJ, 607, L21
- Garnett et al. (1997) Garnett, D. R., Shields, G. A., Skillman, E. D., Sagan, S. P., & Dufour, R. J. 1997, ApJ, 489, 63
- Gonzalez (1993) Gonzalez, J. J. 1993, PhD thesis, Univ. California, Santa Cruz
- Jansen et al. (2000) Jansen, R. A., Fabricant, D., Franx, M., & Caldwell, N. 2000, ApJS, 126, 331
- Kennicutt et al. (2003) Kennicutt, Jr., R. C., Bresolin, F., & Garnett, D. R. 2003, ApJ, 591, 801
- Kewley & Dopita (2002) Kewley, L. J. & Dopita, M. A. 2002, ApJS, 142, 35
- Kobulnicky & Kewley (2004) Kobulnicky, H. A. & Kewley, L. J. 2004, ApJ, 617, 240
- Kobulnicky & Phillips (2003) Kobulnicky, H. A. & Phillips, A. C. 2003, ApJ, 599, 1031
- Kobulnicky et al. (2003) Kobulnicky, H. A., Willmer, C. N. A., Phillips, A. C., et al. 2003, ApJ, 599, 1006
- Kobulnicky & Zaritsky (1999) Kobulnicky, H. A. & Zaritsky, D. 1999, ApJ, 511, 118
- Lara-López et al. (2010) Lara-López, M. A., Bongiovanni, A., Cepa, J., et al. 2010, A&A, 519, A31
- Lilly et al. (2003) Lilly, S. J., Carollo, C. M., & Stockton, A. N. 2003, ApJ, 597, 730
- Maier et al. (2005) Maier, C., Lilly, S. J., Carollo, C. M., Stockton, A., & Brodwin, M. 2005, ApJ, 634, 849
- Maiolino et al. (2008) Maiolino, R., Nagao, T., Grazian, A., et al. 2008, A&A, 488, 463
- Mannucci et al. (2010) Mannucci, F., Cresci, G., Maiolino, R., Marconi, A., & Gnerucci, A. 2010, MNRAS, 408, 2115
- Mannucci et al. (2009) Mannucci, F., Cresci, G., Maiolino, R., et al. 2009, MNRAS, 398, 1915
- McClure & van den Bergh (1968) McClure, R. D. & van den Bergh, S. 1968, AJ, 73, 1008
- McGaugh (1991) McGaugh, S. S. 1991, ApJ, 380, 140
- Morelli et al. (2012) Morelli, L., Corsini, E. M., Pizzella, A., et al. 2012, MNRAS, 423, 962
- Morelli et al. (2008) Morelli, L., Pompei, E., Pizzella, A., et al. 2008, MNRAS, 389, 341
- Moustakas et al. (2011) Moustakas, J., Zaritsky, D., Brown, M., et al. 2011, ArXiv e-prints 1112.3300
- Nagao et al. (2006) Nagao, T., Maiolino, R., & Marconi, A. 2006, A&A, 459, 85
- Osterbrock (1989) Osterbrock. 1989, Astrophysics of Gaseous Nebulae and Active Galactic Nuclei (Mill Valley: University Science Books)
- Pagel et al. (1979) Pagel, B. E. J., Edmunds, M. G., Blackwell, D. E., Chun, M. S., & Smith, G. 1979, MNRAS, 189, 95
- Prugniel & Soubiran (2001) Prugniel, P. & Soubiran, C. 2001, A&A, 369, 1048
- Richer & McCall (1995) Richer, M. G. & McCall, M. L. 1995, ApJ, 445, 642
- Rodrigues et al. (2012) Rodrigues, M., Puech, M., Hammer, F., Rothberg, B., & Flores, H. 2012, MNRAS, 421, 2888
- Ryder (1995) Ryder, S. D. 1995, ApJ, 444, 610
- Sarzi et al. (2006) Sarzi, M., Falcón-Barroso, J., Davies, R. L., et al. 2006, MNRAS, 366, 1151
- Savaglio et al. (2005) Savaglio, S., Glazebrook, K., Le Borgne, D., et al. 2005, ApJ, 635, 260
- Shapley et al. (2004) Shapley, A. E., Erb, D. K., Pettini, M., Steidel, C. C., & Adelberger, K. L. 2004, ApJ, 612, 108
- Skillman et al. (1989) Skillman, E. D., Kennicutt, R. C., & Hodge, P. W. 1989, ApJ, 347, 875
- Sommariva et al. (2012) Sommariva, V., Mannucci, F., Cresci, G., et al. 2012, A&A, 539, A136
- Tremonti et al. (2004) Tremonti, C. A., Heckman, T. M., Kauffmann, G., et al. 2004, ApJ, 613, 898
- Yegorova et al. (2011) Yegorova, I. A., Pizzella, A., & Salucci, P. 2011, A&A, 532, A105
- Zahid et al. (2011) Zahid, H. J., Kewley, L. J., & Bresolin, F. 2011, ApJ, 730, 137