A study of strong pulses detected from PSR B0656+14 using Urumqi 25-m radio telescope at 1540 MHz
Abstract
We report on the properties of strong pulses from PSR B0656+14 by analyzing the data obtained using Urumqi 25-m radio telescope at 1540 MHz from August 2007 to September 2010. In 44 hrs of observational data, a total of 67 pulses with signal-to-noise ratios above a 5- threshold were detected. The peak flux densities of these pulses are 58 to 194 times that of the average profile, and the pulse energies of them are 3 to 68 times that of the average pulse. These pulses are clustered around phases about 5 degrees ahead of the peak of the average profile. Comparing with the width of the average profile, they are relatively narrow, with the full widths at half-maximum range from 0.28 to 1.78 degrees. The distribution of pulse-energies of the pulses follows a lognormal distribution. These sporadic strong pulses detected from PSR B0656+14 are different in character from the typical giant pulses, and from its regular pulses.
keywords:
stars: neutron-pulsars; individual: B0656+141 Introduction
The PSR B0656+14 was firstly detected in radio band by Manchester et al. (1978). The pulsar has a period of 0.3849s. The average pulse flux density of the pulsar is 3.7 mJy at 1.4 GHz (Lorimer et al., 1995), and its dispersion measure (DM) is 13.977 pc cm-3. The distance inferred from the DM using the free electron density model of Cordes & Lazio (2002) is 0.76 kpc, with a typical error of 20 percent, while interpretation of X-ray data gives d = 0.2-0.5 kpc. The average profile of the pulsar present three components, and the radiation of the main pulse component is almost completely linearly polarized while two weak components, leading and following the main, present low-polarization, and are more apparent at low frequencies (Gould & Lyne, 1998; Weisberg et al., 2004; Hankins & Rankin, 2010). PSR B0656+14 is an interesting object from which the pulsed emission has been detected in radio, optical, soft ultraviolet, X-ray, and gamma-ray range of the spectrum.
Recently, very strong individual pulses have been detected from PSR B0656+14. Kuzmin & Ershov (2006) detected 52 strong individual pulses with signal-to-noise ratios (hereafter, SNR) above 5- detection threshold during approximately 4.8 hrs of observations at 111 MHz, and the peak flux of the brightest pulse they noted was up to 640 times that of the average pulse. Weltevrede et al. (2006b) also detected strong pulse from the pulsar at 327 MHz, and the highest peak flux among these strong pulses was 420 times that of the average pulse. Based on this brightest burst, Weltevrede et al. (2006a) assumed that if PSR B0656+14 were located at a suitable distance, it could have been classified as a Rotating Radio Transient.
The individual pulse intensities of most radio pulsars normally fluctuate several times that of average pulse (Ritchings, 1976; Kramer et al., 2003). However, the intensities of typical giant pulses (GPs) can exceed hundreds and even thousands times that of regular pulses (Staelin & Reifenstein, 1968; Cairns, 2004; Knight et al., 2005). The duration of GPs are very short with timescales down to nano-seconds (Hankins et al., 2003). Unlike the GPs, the strong pulses detected from PSR B0656+14 are broad (Weltevrede et al., 2006a, b). The essential nature of the pulsar’s strong pulses need to be investigated.
To study the prominent strong pulses of bursts from B0656+14, we have been monitoring the pulsar at a higher observing frequency of 1540 MHz since August 2007 . In § 2, the observations are described in detail. In § 3, the data analysis procedure and the results are presented. In § 4, we discuss the results. This work is summarized in § 5.
2 Observations
The observations were carried out using the Urumqi 25-m radio telescope. The telescope has a dual-channel cryogenic receiver that receives orthogonal linear polarizations at the central observing frequency of 1540 MHz. The receiver noise temperature is less than 10 K. Each polarization channel is comprised of 128 sub-channels of bandwidth 2.5 MHz, yielding a total bandwidth of 320 MHz. The data from each sub-channel are recorded to hard disk with 1-bit sampling at 0.25 ms intervals for subsequent off-line processing (Wang et al., 2001). The minimum detected flux density of 4.8 Jy at the 5- threshold is given by
where = 5 is the SNR, = is a loss factor due to one-bit digitization, is the Boltzmann constant, = 32 K (in which , , are the receiver, spillover and the the sky noise temperatures, respectively), is the telescope efficiency at 1540 MHz, = 490.87 m2 is the telescope area, is the number of polarizations channels, = 0.25 ms is the sampling interval, and = 320 MHz is the total observing bandwidth of each channel (Esamdin et al., 2008). The average pulse flux density of PSR B0656+14 is 3.7 mJy at 1.4 GHz, so we should note that only very strong single pulses (if exist) of the pulsar can be detected using the Nanshan 25-m radio telescope.
From August 2007 to September 2010, 44 hours of data were collected in 23 observing sessions. For each observation, the sampling interval was 0.25 ms, and the time-span lasted about 2 hrs.
3 Data Analysis and Results
3.1 Data Analysis
Since the group velocities of radio waves are frequency dependent in the propagation medium, the pulsed radio radiation from pulsar is dispersed in the ionized plasma of the interstellar medium. Therefore, the high frequency components of the radio pulse arrive earlier than those at lower frequencies. These dispersion delays must be removed in order to obtain the real profile of a pulse. The time difference (in ms) between arrivals of two components at different frequencies is given by
in which DM is the dispersion measure in pc cm-3, and and (in GHz) represent the values of the lower and higher frequencies, respectively. The time delay was calculated using this equation for each of the 128 observing channels of each polarization.
The data were de-dispersed by delaying successive channels relative to the nominal dispersion measure DM = 13.977 pc cm-3, of the pulsar. Then, all pulsed signals above the 5- threshold were identified as the pulses candidates. And then, in order to distinguish instrumental signals or impulsive terrestrial Radio Frequency Interference (RFI) from the strong pulses of PSR B0656+14, the de-dispersion procedure was applied from 0.977 to 30.977 pc cm-3 at intervals of 0.1 pc cm-3. The details of the pulse-identify process see Esamdin et al. (2008).
A total of 67 pulses were detected through the process mentioned above from the 44 hours of data. Approximately 1 pulse was detected for every 6100 rotation periods of the pulsar. Phases of these individual pulses were calculated by
where =83.23 degrees is the rotational phase at time (MJD 54934.3278), is the observation time of the strong individual pulse, =2.59796969281 Hz is the rotating frequency of the pulsar, =-3.709653 is the frequency derivative, =1.03 is the frequency second derivative, and all quantities were defined at the time which was obtained by a observation with average profile of the highest SNR on 13 April 2009.
We investigated the phases of these single pulses by comparing the residuals of the pulse arrival times obtained using the single-pulse timing method. In order to compare the phases of the single pulses with that of the average pulse profile of this pulsar, the average pulse profile of each observation was generated by folding all successive individual pulses. Then, we matched the profiles that were in phase during the complete observation period with the profile of the highest SNR obtained on 13 April 2009.
3.2 Results


The bottom panel of Figure 1 shows the normalized peak flux densities of the pulses versus their phases (i.e. the peak flux densities of these pulses are normalized to the average peak flux densities ). The peak flux densities of the pulses are above 58 , and the brightest burst is about 194 times stronger than the average pulse. These pulses are indeed very strong comparing with the average pulse of the pulsar. We also compare the phases of the strong pulses with the radiation window of the pulsar by plotting the average profile (dotted line) in the bottom panel of Figure 1, and where the peak of the average profile set as the phase of 0 degrees. The top panel of Figure 1 presents the histogram of the phases of the detected strong pulses. The strong pulses are distributed over a broad pulse window with the phase range from -30 to 11.5 degrees. However, most of the pulses are clustered around a phase about 5 degrees earlier than the phase of the average-profile peak.
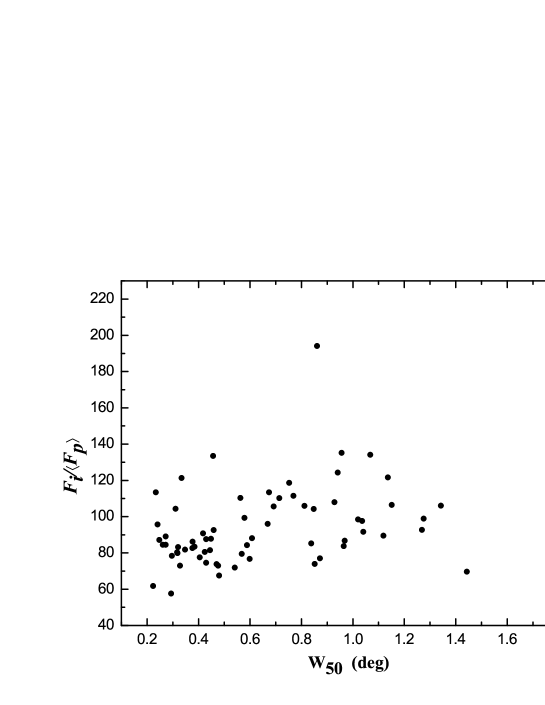
Figure 2 shows the normalized peak-flux densities versus full widths at half maximum (FWHM, W50) of the 67 detected pulses. The W50 of these pulses ranged from 0.28 to 1.78 degrees. Most of the strong pulses are single-peaked. Comparing with the width of the average profile, these pulses are narrow.
Figure 3 presents the pulse-energy distribution of the 67 strong pulses. The pulse energies are normalized to that of the average profile. Here, the peak of each pulse was arranged to lie in the 512th of 1024 bins. A set of 300 consecutive bins, from the 362nd to 661st, was selected as the pulse window, and 300 consecutive bins of the remaining bins, which were far away from the peak of each pulse, were used to remove a baseline from the pulse window. Then, the energies of each pulse, E, were obtained. The energies of the average profiles (E) were obtained in the same way. The energies of all single pulses were normalized to the average pulse-energy (E) of the pulsar. The histogram of pulse energy is presented in Figure 3. The energies of the pulses range from 3E to 68E.
As shown in Figure 3, the pulse-energy distribution is probably best represented by a lognormal distribution. The equation is given by
where our best fitting parameters are = 0.62, = 317.35, = 2.16 and = 0.66, respectively.
4 Discussion
By analyzing observation data at 111MHz, Kuzmin & Ershov (2006) suggested that PSR B0656+14 belongs to a group of pulsars which emit giant pulses. They noted that the pulse-energy distribution follows a power law, and that those so-called giant pulses are clustered in a narrow pulse-longitude range (Kuzmin & Ershov, 2006). The typical GPs are very narrow with timescales down to nanoseconds (Hankins et al., 2003; Knight et al., 2006), and their energy can easily exceed 10 times that of the average pulse. The GP phenomenon has only been detected in two young pulsars: Crab pulsar and PSR B0540-69 (Staelin & Reifenstein, 1968; Wolszczan et al., 1984), and in five millisecond pulsars (Romani & Johnston, 2001; Johnston & Romani, 2003; Joshi et al., 2004; Knight et al., 2005). Although these seven pulsars have very different rotation rates, all of them have strong magnetic fields at the light cylinder, B gauss. It is suggested that GPs are inherent in pulsars with extremely strong magnetic fields at the light cylinder, and that they may originate near the light cylinder region (Lyutikov, 2007).
The magnetic field of PSR B0656+14 at the light cylinder is 766 gauss, which is much lower than those of the classical GP emitters (B gauss). The pulse energy of most pulses we detected exceed 10E, which are within the range of GP energies. However, these pulses are much broader than GPs, and distributed over a wide pulse window. Furthermore, the strong pulses from PSR B0656+14 showed a lognormal pulse-energy distribution rather than a power law of GPs. However, due to the small number of strong pulses we observed, more data are required to confirm whether the distribution is intrinsically lognormal. Our results are similar to that presented by Weltevrede et al. (2006a, b). The sporadic strong pulses of the pulsar are so strong that are hardly explained as the high end of intrinsical intensity-modulation of it’s regular pulses, and by the interstellar scintillation considering the timescales of the bursts of pulses and the broad observing band.
While the intensities of regular single pulses from PSR B0656+14 can vary at random with values reaching several times the average, are far below the intensities of observed strong pulses. Furthermore, the phase distribution of the strong pulses are cluster 5 degree earlier in longitude than the peak of the average profile of the pulsar. These may suggest the difference in origin between the strong pulses detected from the pulsar and its regular pulses. It may be possible that the sporadic strong pulses and the regular pulses of PSR B0656+14 represent two different emission modes, i.e. the strong and weak (normal) modes, with the duration of the strong mode less than one pulse period. Further studies of the pulsar are necessary.
5 Summary and Conclusion
We have presented an analysis of the 67 strong pulses detected from PSR B0656+14 at 1540 MHz using Urumqi 25 m radio telescope. The peak flux densities of these pulses are 58 to 194 times of that of the average pulse, and the pulse energies of them are 3 to 68 times that of the average pulse. The durations of the strong pulses are relatively short, ranging from 0.28 to 1.78 degrees. By covering about 41.5 degrees of phase range, the strong pulses occurred over a broad range of the emission window. However, they are mainly clustered around phase about 5 degrees earlier than that of the average-profile peak. The sporadic strong pulses detected from PSR B0656+14 are different in character from the typical GPs emitted by some other pulsars, and may also be different in character from its regular pulses.
Acknowledgements.
We thank the referee for helpful comments on the paper. This work was funded by the National Natural Science Foundation of China under grant 10973026.References
- Cairns (2004) Cairns, I. H. 2004, ApJ, 610, 948
- Cordes & Lazio (2002) Cordes, J. M., & Lazio, T. J. W. 2002, ArXiv Astrophysics e-prints
- Esamdin et al. (2008) Esamdin, A., Zhao, C. S., Yan, Y., et al. 2008, MNRAS, 389, 1399
- Gould & Lyne (1998) Gould, D. M., & Lyne, A. G. 1998, MNRAS, 301, 235
- Hankins et al. (2003) Hankins, T. H., Kern, J. S., Weatherall, J. C., & Eilek, J. A. 2003, Nature, 422, 141
- Hankins & Rankin (2010) Hankins, T. H., & Rankin, J. M. 2010, AJ, 139, 168
- Johnston & Romani (2003) Johnston, S., & Romani, R. W. 2003, ApJ, 590, L95
- Joshi et al. (2004) Joshi, B. C., Kramer, M., Lyne, A. G., McLaughlin, M. A., & Stairs, I. H. 2004, in Young Neutron Stars and Their Environments, IAU Symposium, vol. 218, edited by F. Camilo & B. M. Gaensler, 319–+
- Knight et al. (2005) Knight, H. S., Bailes, M., Manchester, R. N., & Ord, S. M. 2005, ApJ, 625, 951
- Knight et al. (2006) Knight, H. S., Bailes, M., Manchester, R. N., Ord, S. M., & Jacoby, B. A. 2006, ApJ, 640, 941
- Kramer et al. (2003) Kramer, M., Karastergiou, A., Gupta, Y., et al. 2003, A&A, 407, 655
- Kuzmin & Ershov (2006) Kuzmin, A. D., & Ershov, A. A. 2006, Astronomy Letters, 32, 583
- Lorimer et al. (1995) Lorimer, D. R., Yates, J. A., Lyne, A. G., & Gould, D. M. 1995, MNRAS, 273, 411
- Lyutikov (2007) Lyutikov, M. 2007, MNRAS, 381, 1190
- Manchester et al. (1978) Manchester, R. N., Lyne, A. G., Taylor, J. H., et al. 1978, MNRAS, 185, 409
- Ritchings (1976) Ritchings, R. T. 1976, MNRAS, 176, 249
- Romani & Johnston (2001) Romani, R. W., & Johnston, S. 2001, ApJ, 557, L93
- Staelin & Reifenstein (1968) Staelin, D. H., & Reifenstein, E. C., III 1968, Science, 162, 1481
- Wang et al. (2001) Wang, N., Manchester, R. N., Zhang, J., et al. 2001, MNRAS, 328, 855
- Weisberg et al. (2004) Weisberg, J. M., Cordes, J. M., Kuan, B., et al. 2004, ApJS, 150, 317
- Weltevrede et al. (2006a) Weltevrede, P., Stappers, B. W., Rankin, J. M., & Wright, G. A. E. 2006a, ApJ, 645, L149
- Weltevrede et al. (2006b) Weltevrede, P., Wright, G. A. E., Stappers, B. W., & Rankin, J. M. 2006b, A&A, 458, 269
- Wolszczan et al. (1984) Wolszczan, A., Cordes, J., & Stinebring, D. 1984, in Birth and Evolution of Neutron Stars: Issues Raised by Millisecond Pulsars, edited by S. P. Reynolds & D. R. Stinebring, 63