Compact radio sources in M17
Abstract
The classic HII region M17 is one of the best studied across the electromagnetic spectrum. We present sensitive, high angular resolution observations made with the Jansky Very Large Array (JVLA) at 4.96 and 8.46 GHz that reveal the presence of 38 compact radio sources, in addition to the well known hypercompact cometary HII region M17 UC1. For this last source we find that its spectral index of value 1 is due to a gradient in opacity across its face. Of the 38 compact radio sources detected, 19 have stellar counterparts detected in the infrared, optical, or X-rays. Finally, we discuss the nature of the radio emission from the massive binary system CEN 1a and 1b, concluding that both are most probably non-thermal emitters, although the first is strongly time variable and the second is steady.
1 Introduction
The centimeter continuum radiation from classic HII regions is dominated by strong free-free emission from the extended ionized gas present there. However, when observed with the high angular resolution provided by an interferometer, the extended emission is filtered out and one starts to detect compact sub-arcsecond sources of various natures (see Garay et al. 1987; Churchwell et al. 1987; Felli et al. 1993; Zapata et al. 2004 for the case of Orion A). The brightest of these sources are the hypercompact (HC) HII regions, that trace the ionized gas produced by young OB stars still embedded in dense molecular gas (e.g. Kurtz 2005; Lizano 2008). The externally ionized globules are also sources of free-free radiation and result from the interaction of the UV photons of the OB stars in the region with remaining blobs of neutral gas existing inside the HII region (e.g. Garay et al. 1987). The proplyds (O’Dell et al. 1993) are similar to the externally ionized globules, but in this case the object being ionized is a protoplanetary disk surrounding a young star. The last two known types of free-free emitters are the jets emanating from accreting protostars (Anglada 1996; Eisloffel et al. 2000) and the spherical ionized winds produced by massive stars (e.g. Bieging et al. 1989; Contreras et al. 1996). There are also two types of sources with non-thermal radio continuum emission. Young low-mass stars can have strong magnetospheric activity and emit detectable gyrosynchrotron radiation (André et al. 1988). Finally, there is also strong evidence that systems of massive binary stars can produce synchrotron radiation in the region where their winds collide (e.g. Pittard et al. 2006; Ortiz-León et al. 2011). In Table 1 we present a summary of the characteristics of these different types of compact radio sources.
In this paper we present a sensitive, high angular resolution study made with the Jansky Very Large Array (JVLA) of the National Radio Astronomy Observatory (NRAO)111The NRAO is operated by Associated Universities Inc. under cooperative agreement with the National Science Foundation. toward the classic HII region M17 (the Omega Nebula, NGC 6618, W38, S45). In § 2 we present the observations, while in § 3 we list and briefly discuss the compact radio sources detected. In § 4 we use our data to present an explanation for the spectral index of order 1 observed in the hypercompact HII region M17 UC1. In § 5 we discuss the time variable sources in our sample, while in § 6 we concentrate on CEN 1a and 1b, the members of the massive binary system that ionizes most of M17. In § 7 we try to model the time-variable emission of CEN 1a in terms of a thermal model, concluding that this is not feasible. Finally, § 8 presents a brief discussion on some of the other individual sources and in § 9 we summarize our conclusions.
2 Observations
The JVLA observations were made at 4.96, 8.46 and 22.46 GHz using two intermediate frequency (IF) bandwidths of 128 MHz each, separated by 128 MHz, and containing both circular polarizations. Each IF was split into 64 channels of 2 MHz each. For the continuum images we averaged the central 54 channels, rejecting five channels at each end of the bandwidth. We observed in three epochs during the year 2011: June 16 (2011.46) and 27 (2011.49), and July 28 (2011.57). This cadence was adopted with the purpose of searching for variability at 4.96 and 8.46 GHz in the timescales of about 10, 30, and 40 days. The observations at 22.46 GHz were made only in the second epoch (2011 June 27) with the purpose of determining better spectral indices. In addition to these timescales, we searched for rapid variability (i.e. in timescales of minutes) during the two hours of each individual run. At all 3 epochs, the JVLA was in the highest angular resolution A configuration.
The data reduction was made using the software package AIPS of NRAO, following the recommendations for JVLA data given in Appendix E of its CookBook (that can be found in http://www.aips.nrao.edu/cook.html). The amplitude calibrator was J1331+3030, with adopted flux densities of 7.392, 5.205 and 2.519 Jy at 4.96, 8.46 and 22.46 GHz, respectively. The phase calibrator was J1832-1035, with the bootstrapped flux densities given in Table 2.
The data were self-calibrated in amplitude and phase and we made images using only visibilities with baselines larger than 50 k, suppressing structures larger than . The search for variability within each individual run was made without self-calibration, since this procedure tends to smooth out amplitude variations within the time interval where it is applied. At 4.96 and 8.46 GHz we analyzed regions of in solid angle, while at 22.46 GHz the region analyzed was . At 22.46 GHz our 4- sensitivity at the center of the field was 0.4 mJy beam-1 and the only source detected was M17 UC1, a well-known hypercompact HII region embedded in the molecular cloud adjacent to the SW of the M17 HII region (Felli et al. 1980). At 4.96 and/or 8.46 GHz we detected a total of 38 compact sources, in addition to M17 UC1. These sources are listed in Table 3. The rms noise of the images is not constant across all the solid angle analyzed for two reasons. First, the primary beam response decreases as we move away from the center of the field (e.g. Cotton & Perley 2010). The correction for this effect increases both signal and noise. In addition, in this region there is an arc-shaped ionization front to the east and northeast of M17 UC1 that makes it noisier than expected (Felli et al. 1984; Johnson et al. 1998). This structure most probably traces the interaction of the ionizing photons of NGC 6618, the cluster ionizing M17, with the molecular clump where M17 UC1 is embedded.
Assuming a typical noise of 0.05 mJy beam-1 at the center of the field for the 8.46 GHz observations and following Anglada et al. (1998), we expect to detect only about one background source above 4- over all the solid angle analyzed. We can then conclude that practically all the detected sources are related to M17.
3 Compact radio sources
In Table 3 we list the 38 detected compact radio sources, giving their positions, flux densities at 8.46 and 4.96 GHz, the resulting spectral index, and their angular size. Most of the sources are unresolved (). In Table 4 we list the 19 compact radio sources with reported counterparts at other wavelengths (in all cases, stars detected previously at optical, near-infrared, or X-rays). A counterpart was considered to be associated with the JVLA source if its position coincided within of the radio position. We tried to find systematic differences between the radio sources with and without counterparts by plotting them in a spectral index versus flux density diagram (see Fig. 1). This diagram does not segregate the two classes of source and we tentatively suggest that the radio sources without counterparts are similar to those that have a counterpart, but are very heavily obscured which makes detection difficult at wavelengths other than radio.
4 The origin of the spectral index of the hypercompact HII region M17 UC1
This bright source has an angular size of , that at a distance of 1.98 kpc (Xu et al. 2011) implies a diameter of 0.004 pc, falling in the category of the hypercompact HII regions (Kurtz 2005). Its morphology is cometary. For this source we obtain total flux densities of 44, 107, and 194 mJy at 4.96, 8.46, and 22.46 GHz, respectively. These flux densities indicate a spectral index of (), consistent with the value of typically found in hypercompact HII regions (Hofner et al. 1996; Kurtz 2002; Sewilo et al. 2004). The reason for this intermediate spectral index remains unknown. Homogeneous HII regions are expected to show when optically thick (low frequencies) and when optically thin (high frequencies). In these sources the transition from optically-thick to optically-thin ocurrs in a small frequency range. The indices of observed in hypercompact HII regions cannot be explained as the result of observing this transition region since they extend over at least an order of magnitude in frequency. An alternative explanation is given by the hierarchical clumping model of Ignace & Churchwell (2004), where it is proposed that the radio continuum energy spectrum comes from an ensemble of spherical clumps. In this model, for example, the spectral index of should be detected all across the face of the nebula.
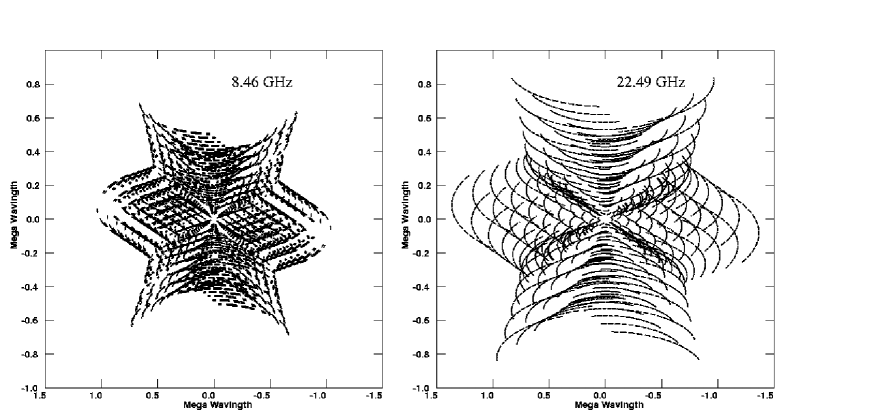
Taking advantage of the excellent quality of our 8.46 GHz data, we derived the spectral index for M17 UC1 as a function of position. Our 4.96 GHz data does not have enough angular resolution to clearly resolve the source and our 22.46 GHz data is centered on the NGC 6618 cluster and M17 UC1 is located too far from the phase center and the integration is relatively short (a total of 20 minutes on-source). We then used for the comparison with our 8.46 GHz JVLA data, archive VLA data taken at 22.49 GHz in 1982 March 20 under project FELL. For these archive VLA observations the amplitude calibrator was 1331+305, with an adopted flux density of 2.52 Jy and the phase calibrator was 1730130, with a bootstrapped flux density of 4.860.01 Jy. To obtain a reliable astrometry, the position of 1730130 was updated to the most recently improved value provided by the JVLA Calibrator Manual. Both the 8.46 and 22.46 GHz observations were made in the A configuration. To obtain comparable (u,v) coverage at both frequencies we did not include the two inner antennas at each arm for the 8.46 GHz observations and the three outer antennas at each arm for the 22.46 GHz observations. The resulting (u,v) coverages are shown in Figure 2. The images at both frequencies were restored using the synthesized beam of the 8.46 GHz observations.
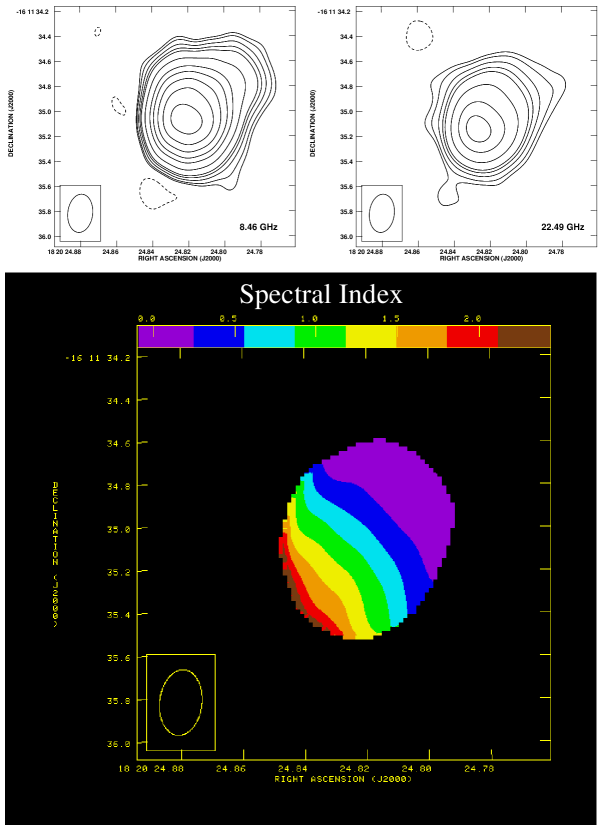
In Figure 3 we show the contour images at 8.46 and 22.49 GHz as well as the derived spectral index from these two images. The spectral index image shows that there is a smooth gradient from values of (optically-thick emission) near the head of the cometary nebula to values of (optically-thin emission) near the tail. This result suggests that, at least in this hypercompact HII region the intermediate value of 1 for the spectral index comes from a gradient in optical depth across the face of the nebula. We speculate that if this is the explanation for the spectral index found in other hypercompact HII regions, they should show a cometary morphology when observed with sufficiently high angular resolution. For this effect to be observable at frequencies similar to those used here, we need objects with large average emission measures, of order cm-6 pc, so that they can present significant optical depths at frequencies of order 15 GHz.
5 Time-variable radio sources
Of the 38 compact sources detected, two of them show large variations between the three observing runs. The first time variable source is CEN 1a, whose flux densities are listed in Table 5. Images at the three epochs are shown in Fig. 4. This source was not detected in the first two epochs but in the last epoch it became quite bright, with a flux density about an order of magnitude larger than the 4- upper limits obtained for the first two epochs. The other variable source was the B1 star NGC 6618 B 159, whose flux densities are given in Table 6.
In addition to possible long term variability between runs, we also searched for short timescale variability within the individual runs. Our procedure to search for such variability was the following. First, images of the source of interest were made with the AIPS task IMAGR for each observation epoch. With the AIPS task JMFIT, the precise position of the primary component was determined. The data were recentered at the position of the main component using the AIPS task UVFIX. With these new data, the real and imaginary parts of the interferometer data were plotted as a function of time, averaged over the plane. The real part gives us information on the flux density of the source and the imaginary part on its position and symmetry. We then averaged over time in bins of approximately 10 minutes. A detailed description of this technique is given by Neria et al. (2010). The flux density as a function of time for the two time variable sources during a given run is shown in Figures 5 (CEN 1a) and 6 (NGC 6618 B 159). No fast variability (hours or less) was detected for these sources.
Finally, of the seven sources detected by Rodríguez et al. (2009), only one is not detected by us. This source is named VLA 2 by Rodríguez et al. (2009) and is located at the position . Rodríguez et al. (2009) reported an 8.46 GHz flux density of 1.30.1 mJy, while from the images made from the concatenated (u,v) data we set a 4- upper limit of 0.07 mJy. As noted before, also CEN 1a is time-variable. The remaining five sources detected by Rodríguez et al. (2009) were detected by us at similar flux densities.
6 CEN 1a and CEN 1b
CEN 1a and CEN 1b are a massive binary system (with angular separation of ; Chini et al. 1980). The O4 V stars that form this binary system are the main ionizing sources of the M17 H II region (e. g. Hoffmeister et al. 2008) and the brightest X-ray objects in the zone (Broos et al. 2007). CEN 1a and CEN 1b were first detected as radio sources by Rodríguez et al. (2009). Our data provides new information on these radio sources. While CEN 1a is strongly time-variable (see Table 4), CEN 1b appears to be a steady source. The flux densities found by us for 2011 June-July are consistent with the flux densities reported by Rodríguez et al. (2009) for 1988 October and 2000 December. The available information suggests that CEN 1b is constant over timescales of decades. Its spectral index, as derived from the 2011 June-July observations is , suggesting optically-thin synchrotron emission.
In constrast, CEN 1a is strongly variable. As noted above, it was detected only in the last epoch of our observations, showing a spectral index of . As was pointed out by Rodríguez et al. (2009), the flux density expected from a stellar wind in a single star scenario is too low ( 0.1 mJy at 8.46 GHz) to account for the relatively large flux density detected (2.6 mJy at 8.46 GHz). This fact and the strong variability observed suggest a binary origin for the source, with the emission arising from a wind-wind colliding region (WCR) between the stars forming the binary system. In this binary scenario, the variability is thought to be the result of an eccentric orbit and/or a high inclination angle of the orbital plane. In this context, the spectral index observed could be compatible with both optically-thin thermal emission (Pittard 2010) and non-thermal (synchrotron) emission (Contreras et al. 1997), arising both from the WCR. Its flat value is in agreement with synchrotron emission being affected by free-free absorption from the unshocked winds, turning the negative value expected from intrinsic optically-thin synchrotron emission into the flat spectrum observed for CEN 1a. The thermal contribution from a WCR is expected to increase the flux density only a factor of a few with respect to that from the single stellar wind (Stevens 1995, Pittard 2010). On the other hand, the non-thermal emission has been observed to increase the flux by more than one order of magnitude with respect to the minimum states of the radio light curves of colliding wind binaries (CWB; e.g. HD 168112; Blomme et al. 2005). Thus, the strong increase in the flux observed in CEN 1a suggests a non-thermal origin for the emission detected.
However, given that the spectral index is consistent with optically-thin free-free emission, we have considered thermal emission models, but cannot find any that are reasonable and match the observations. We conclude that the observed radio emission from CEN 1a most probably has a non-termal nature and that the observed flat spectrum is consistente with a combination of synchrotron emission and free-free absorption, as noted before. Non-thermal emission in massive stars is usually attributed to them being binary systems, with the emission coming from the wind collision region. Alternatively, the radio emission could be coming from Fermi acceleration in wind shocks of a single star due to the radiation-driven instability (Lucy & White 1980; White & Chen 1994). This system provides the opportunity to study simultaneously two stars, a variable one (CEN 1a) and a steady one (CEN 1b) and to try to understand what is the reason for their different behaviours.
7 Notes on individual sources
7.1 JVLA 3
This radio source is within a few arcsec of the bright infrared object KW (Kleinmann & Wright 1973; Povich et al. 2009) and it is probably associated with it.
7.2 JVLA 35
This source is remarkable because it is clearly detected at 8.46 GHz, but not at 4.96 GHz (see Figure 7), resulting in a spectral index of . This spectral index is consistent with optically-thick free-free emission, optically-thick synchrotron or even with optically thin dust emission. The source is arc-shaped (see Figure 7) and could be tracing the edge of a heated dust globule. There are no known counterparts to this source in the SIMBAD database. We also searched unsuccessfully for a counterpart in the GLIMPSE catalog of candidate young stellar objects with a high probability of association with the M17 complex (Povich et al. 2009). Its unusual radio spectrum deserves further study.
8 Conclusions
We presented sensitive, high angular resolution observations made with the Jansky Very Large Array (JVLA) at 4.96 and 8.46 GHz toward the HII region M17. Our main conclusions are listed in what follows.
1. We detected 38 compact radio sources, practically all associated with the region. Only 19 of these sources have counterparts, in all cases stars previously detected at infrared, optical, or X-rays. We argue that the radio sources without counterparts are similar to those with counterparts, but that they are heavily obscured, which makes detection difficult at wavelengths other than radio.
2. We studied the spectral index of the hypercompact HII region M17 UC1, finding that its spectral index of value 1 is due to a gradient in optical depth across its face. We speculate that this type of gradient could explain similar spectral indices detected in other hypercompact HII regions. In this case, all these sources should show a cometary morphology.
3. We discussed the nature of the radio emission from the massive binary system CEN 1a and 1b, concluding that both are most probably non-thermal emitters, although the first one is highly time variable and the second one is steady. Non-thermal emission in massive stars is usually attributed to them being binary systems, with the emission coming from the wind collision region. This system provides the opportunity to study simultaneously two stars, a variable one (CEN 1a) and a steady one (CEN 1b) and to try to understand the reasons for their different behaviours.
References
- André et al. (1988) Andre, P., Montmerle, T., Feigelson, E. D., Stine, P. C., & Klein, K.-L. 1988, ApJ, 335, 940
- Anglada (1996) Anglada, G. 1996, Radio Emission from the Stars and the Sun, 93, 3
- Anglada et al. (1998) Anglada, G., Villuendas, E., Estalella, R., et al. 1998, AJ, 116, 2953
- Bieging et al. (1989) Bieging, J. H., Abbott, D. C., & Churchwell, E. B. 1989, ApJ, 340, 518
- Blomme et al. (2005) Blomme, R., van Loo, S., De Becker, M., et al. 2005, A&A, 436, 1033
- Br (07) Broos, P. S., Feigelson, E. D., Townsley, L. K., Getman, K. V., Wang, J., Garmire, G. P., Jiang, Z., & Tsuboi, Y. 2007, ApJS, 169, 353
- Bu (92) Bumgardner, T. E. 1992, M.S. thesis, Ohio State Univ., Columbus
- Ca (00) Cantó, J., Raga, A. & D’Alessio, P. 2000, MNRAS, 313, 656
- Ch (80) Chini, R., Elsaesser, H., & Neckel, T. 1980, A&A, 91, 186
- Churchwell et al. (1987) Churchwell, E., Felli, M., Wood, D. O. S., & Massi, M. 1987, ApJ, 321, 516
- Contreras et al. (1996) Contreras, M. E., Rodriguez, L. F., Gomez, Y., & Velazquez, A. 1996, ApJ, 469, 329
- Contreras et al. (1997) Contreras, M. E., Rodriguez, L. F., Tapia, M., et al. 1997, ApJ, 488, L153
- CR (10) Cotton, W. D. & Perley, R. 2010, OBIT Development Memo Series No. 17
- Eisloffel et al. (2000) Eisloffel, J., Mundt, R., Ray, T. P., & Rodriguez, L. F. 2000, Protostars and Planets IV, 815
- Felli et al. (1980) Felli, M., Johnston, K. J., & Churchwell, E. 1980, ApJ, 242, L157
- Felli et al. (1984) Felli, M., Churchwell, E., & Massi, M. 1984, A&A, 136, 53
- Felli et al. (1993) Felli, M., Taylor, G. B., Catarzi, M., Churchwell, E., & Kurtz, S. 1993, A&AS, 101, 127
- Garay et al. (1987) Garay, G., Moran, J. M., & Reid, M. J. 1987, ApJ, 314, 535
- H (08) Hoffmeister, V. H., Chini, R., Scheyda, C. M., Schulze, D., Watermann, R., Nürnberger, D., & Vogt, N. 2008, ApJ, 686, 310
- Hofner et al. (1996) Hofner, P., Kurtz, S., Churchwell, E., Walmsley, C. M., & Cesaroni, R. 1996, ApJ, 460, 359
- Ignace & Churchwell (2004) Ignace, R., & Churchwell, E. 2004, ApJ, 610, 351
- Johnson et al. (1998) Johnson, C. O., Depree, C. G., & Goss, W. M. 1998, ApJ, 500, 302
- Kleinmann & Wright (1973) Kleinmann, D. E., & Wright, E. L. 1973, ApJ, 185, L131
- Kurtz (2002) Kurtz, S. 2002, Hot Star Workshop III: The Earliest Phases of Massive Star Birth, 267, 81
- Kurtz (2005) Kurtz, S. 2005, Massive Star Birth: A Crossroads of Astrophysics, 227, 111
- Lizano (2008) Lizano, S. 2008, Massive Star Formation: Observations Confront Theory, 387, 232
- Lucy & White (1980) Lucy, L. B., & White, R. L. 1980, ApJ, 241, 300
- O’Dell et al. (1993) O’Dell, C. R., Wen, Z., & Hu, X. 1993, ApJ, 410, 696
- Ortiz-León et al. (2011) Ortiz-León, G. N., Loinard, L., Rodríguez, L. F., Mioduszewski, A. J., & Dzib, S. A. 2011, ApJ, 737, 30
- Pittard et al. (2006) Pittard, J. M., Dougherty, S. M., Coker, R. F., O’Connor, E., & Bolingbroke, N. J. 2006, A&A, 446, 1001
- Pittard (2010) Pittard, J. M. 2010, MNRAS, 403, 1633
- Povich et al. (2009) Povich, M. S., Churchwell, E., Bieging, J. H., et al. 2009, ApJ, 696, 1278
- ra (90) Raga, A.C., Cantó, J., Binette, L. & Calvet N. 1990, ApJ, 364, 601
- Rodríguez et al. (2009) Rodríguez, L. F., González, R. F., & Montes, G. 2009, Rev. Mexicana Astron. Astrofis., 45, 273
- Sewilo et al. (2004) Sewilo, M., Churchwell, E., Kurtz, S., Goss, W. M., & Hofner, P. 2004, ApJ, 605, 285
- Stevens (1995) Stevens, I. R. 1995, MNRAS, 277, 163
- White & Chen (1994) White, R. L., & Chen, W. 1994, Ap&SS, 221, 295
- Xu et al. (2011) Xu, Y., Moscadelli, L., Reid, M. J., et al. 2011, ApJ, 733, 25
- Zapata et al. (2004) Zapata, L. A., Rodríguez, L. F., Kurtz, S. E., & O’Dell, C. R. 2004, AJ, 127, 2252


| Class of | Emission | Spectral | Time | |||
|---|---|---|---|---|---|---|
| Source | Mechanism | Index | Polarization | Variability | Morphology | Excitation |
| HC HII region | Free-free | 1 | No | No | Various | Internal |
| Ionized globule | Free-free | 0.1 | No | No | Cometary | External |
| Proplyds | Free-free | 0.1 | No | No | Cometary | External |
| Jet | Free-free | 0.6 | No | Yes | Elongated | Internal |
| Spherical wind | Free-free | 0.6 | No | No | Unresolved | Internal |
| Low-mass protostars | Gyrosynchrotron | 2 – +2 | Circular | Yes | Unresolved | Internal |
| Massive binary stars | Synchrotron | 0.7 | Linear | Yes | Cometary | Internal |
| Frequency | 2011 Jun 16 | 2011 Jun 27 | 2011 Jul 28 |
|---|---|---|---|
| (GHz) | (Jy) | (Jy) | (Jy) |
| 4.96 | 1.3590.003 | 1.3150.002 | 1.3140.002 |
| 8.46 | 1.4330.004 | 1.4040.002 | 1.4040.003 |
| 22.46 | — | 1.0720.006 | — |
| JVLA | Positiona | Flux Density(mJy) | Spectral | Angular | |||
|---|---|---|---|---|---|---|---|
| Number | (2000) | (2000) | 8.46 GHz | 4.96 GHz | Index | Sizeb | |
| 1 | 18 20 13.335 | -16 12 50.69 | 0.480.12 | 1.140.10 | 1.60.5 | U | |
| 2 | 18 20 17.575 | -16 12 21.52 | 0.570.11 | 1.630.13 | 2.00.4 | ||
| 3 | 18 20 19.475 | -16 13 29.87 | 0.330.06 | 0.200.05 | +0.90.6 | U | |
| 4 | 18 20 21.435 | -16 12 06.81 | 0.210.05 | 0.450.11 | 1.40.6 | U | |
| 5 | 18 20 21.637 | -16 11 17.91 | 0.660.07 | 0.460.10 | +0.70.5 | U | |
| 6 | 18 20 22.369 | -16 12 04.95 | 0.270.08 | 0.210.09 | +0.51.0 | U | |
| 7 | 18 20 25.317 | -16 11 48.74 | 1.090.14 | 0.600.11 | +1.10.4 | ||
| 8 | 18 20 25.496 | -16 10 53.77 | 0.470.11 | 0.190.07 | +1.70.8 | U | |
| 9 | 18 20 25.297 | -16 11 39.83 | 2.160.32 | 1.700.31 | +0.40.4 | ||
| 10 | 18 20 26.239 | -16 11 15.85 | 0.680.07 | 0.690.09 | +0.00.3 | U | |
| 11 | 18 20 26.745 | -16 07 21.82 | 2.100.22 | 1.660.15 | +0.40.3 | ||
| 12 | 18 20 27.377 | -16 11 38.59 | 0.530.08 | 0.600.10 | 0.20.4 | U | |
| 13 | 18 20 27.855 | -16 09 55.60 | 0.150.03 | 0.240.07 | 0.90.7 | U | |
| 14 | 18 20 28.022 | -16 11 27.00 | 0.360.07 | 0.300.06 | +0.30.5 | U | |
| 15 | 18 20 28.233 | -16 13 17.83 | 0.640.06 | 0.720.09 | 0.20.3 | U | |
| 16 | 18 20 28.283 | -16 11 30.53 | 0.220.05 | 0.240.07 | 0.20.7 | U | |
| 17 | 18 20 28.384 | -16 10 14.13 | 0.330.07 | 0.300.09 | +0.20.7 | U | |
| 18 | 18 20 29.118 | -16 08 58.61 | 2.590.29 | 2.260.19 | +0.30.3 | ||
| 19 | 18 20 29.436 | -16 10 49.84 | 0.510.08 | 0.430.10 | +0.30.5 | U | |
| 20 | 18 20 29.811 | -16 10 45.58 | 0.920.07 | 1.360.09 | 0.70.2 | U | |
| 21c | 18 20 29.897 | -16 10 44.45 | 1.480.07 | 0.960.08 | +0.80.2 | U | |
| 22 | 18 20 30.003 | -16 10 35.26 | 0.810.07 | 0.770.09 | +0.10.3 | U | |
| 23 | 18 20 30.131 | -16 10 39.45 | 0.460.07 | 0.630.11 | 0.60.4 | U | |
| 24 | 18 20 30.323 | -16 10 50.65 | 0.240.06 | 0.350.09 | 0.70.7 | U | |
| 25 | 18 20 30.342 | -16 11 43.67 | 0.260.06 | 0.160.04 | +0.90.6 | U | |
| 26 | 18 20 30.415 | -16 11 03.63 | 0.270.07 | 0.180.06 | +0.80.8 | U | |
| 27 | 18 20 30.442 | -16 10 53.08 | 0.240.06 | 0.480.09 | 1.30.6 | U | |
| 28 | 18 20 30.577 | -16 11 04.13 | 0.800.07 | 0.690.08 | +0.30.3 | U | |
| 29 | 18 20 30.632 | -16 10 28.51 | 0.310.06 | 0.170.05 | +1.10.7 | U | |
| 30 | 18 20 30.777 | -16 10 59.35 | 0.980.08 | 0.740.08 | +0.50.3 | U | |
| 31c | 18 20 31.112 | -16 09 29.83 | 2.020.07 | 1.130.09 | +1.10.2 | U | |
| 32 | 18 20 31.523 | -16 10 32.56 | 0.200.05 | 0.140.05 | +0.70.8 | U | |
| 33 | 18 20 32.981 | -16 11 15.55 | 0.190.04 | 0.130.05 | +0.70.8 | U | |
| 34 | 18 20 33.060 | -16 11 21.59 | 1.080.07 | 1.430.09 | 0.50.2 | U | |
| 35 | 18 20 33.090 | -16 09 40.85 | 0.950.19 | 0.200.05 | 2.90.6 | ||
| 36 | 18 20 33.504 | -16 10 44.57 | 0.490.08 | 0.400.08 | +0.40.5 | U | |
| 37 | 18 20 33.609 | -16 10 21.66 | 0.220.05 | 0.290.06 | 0.50.6 | U | |
| 38 | 18 20 33.767 | -16 10 46.39 | 0.260.06 | 0.270.08 | 0.10.7 | U | |
| JVLA | Positiona | ||
|---|---|---|---|
| Number | Counterpartb | (2000) | (2000) |
| 3 | 2MASS J18201947-1613298 | 18 20 19.472 | -16 13 29.89 |
| 4 | Cl* NGC 6618 B 335 | 18 20 21.435 | -16 12 06.85 |
| 5 | Cl* NGC 6618 B 331 | 18 20 21.640 | -16 11 18.00 |
| 8 | Cl* NGC 6618 B 267 | 18 20 25.500 | -16 10 53.77 |
| 13 | Cl* NGC 6618 B 228 | 18 20 27.852 | -16 09 56.04 |
| 15 | [BFT2007] 471 | 18 20 28.260 | -16 13 17.91 |
| 16 | Cl* NGC 6618 B 222 | 18 20 28.300 | -16 11 31.19 |
| 19 | CXOU J182029.4-161050 | 18 20 29.439 | -16 10 50.22 |
| 20 | CEN 1b = [PCB2009] 2 | 18 20 29.811 | -16 10 45.67 |
| 21 | CEN 1a = [PCB2009] 1 | 18 20 29.900 | -16 10 44.40 |
| 22 | CXOU J182030.0-161034 | 18 20 30.030 | -16 10 34.81 |
| 23 | CXOU J182030.0-161039 | 18 20 30.080 | -16 10 39.97 |
| 25 | Cl* NGC 6618 B 179 | 18 20 30.346 | -16 11 43.69 |
| 27 | Cl* NGC 6618 B 174 | 18 20 30.448 | -16 10 53.09 |
| 28 | 2MASS J18203057-1611040 | 18 20 30.578 | -16 11 04.10 |
| 29 | SSTGLMC G015.0618-00.6890 | 18 20 30.649 | -16 10 28.25 |
| 31 | Cl* NGC 6618 B 159 | 18 20 31.115 | -16 09 29.88 |
| 32 | 2MASS J18203152-1610326 | 18 20 31.523 | -16 10 32.61 |
| 34 | Cl* NGC 6618 B 137 | 18 20 33.061 | -16 11 21.56 |
| Frequency | 2011 Jun 16 | 2011 Jun 27 | 2011 Jul 28 | |
|---|---|---|---|---|
| Source | (GHz) | (mJy) | (mJy) | (mJy) |
| CEN 1a | 4.96 | 0.270.09 | 0.210.07 | 2.690.09 |
| CEN 1a | 8.46 | 0.260.05 | 0.240.06 | 2.580.05 |
| CEN 1a | 22.46 | — | 0.420.10 | — |
| CEN 1b | 4.96 | 1.170.10 | 1.170.11 | 1.150.09 |
| CEN 1b | 8.46 | 0.810.05 | 0.660.06 | 0.800.05 |
| CEN 1b | 22.46 | — | 0.420.10 | — |
| Frequency | 2011 Jun 16 | 2011 Jun 27 | 2011 Jul 28 |
|---|---|---|---|
| (GHz) | (mJy) | (mJy) | (mJy) |
| 4.96 | 1.890.09 | 1.670.13 | 0.210.06 |
| 8.46 | 3.820.07 | 1.610.06 | 0.180.04 |
| 22.46 | — | 1.560.42 | — |