Stellar Archaeology in the Galactic halo with Ultra-Faint Dwarfs: VII. Hercules11affiliation: Based on data collected at the 2.5 m Isaac Newton Telescope, La Palma, Canary Island, Spain, at the 4.2 m William Herschel Telescope, Roche de los Muchachos, Canary Islands, Spain, at the 2.2 m ESO/MPI telescope, La Silla, Chile, Proposal 079.D-0587, at the 2 m Liverpool Telescope, Roche de los Muchachos, Canary Islands, Spain, and at the 2 m Faulkes Telescope North, Haleakala Observatory, Hawaii, USA
Abstract
We present the first time-series study of the ultra-faint dwarf galaxy Hercules. Using a variety of telescope/instrument facilities we secured about 50 and 80 epochs. These data allowed us to detect and characterize 10 pulsating variable stars in Hercules. Our final sample includes 6 fundamental-mode (ab-type) and 3 first overtone (c-type) RR Lyrae stars, and one Anomalous Cepheid. The average period of the ab-type RR Lyrae stars, P=0.68 d ( = 0.03 d), places Hercules in the Oosterhoff II group, as found for almost the totality of the ultra-faint dwarf galaxies investigated so far for variability. The RR Lyrae stars were used to obtain independent estimates of the metallicity, reddening and distance to Hercules, for which we find: dex, mag, and mag, in good agreement with the literature values. We have obtained a color-magnitude diagram (CMD) of Hercules that reaches 25 mag and extends beyond the galaxy’s half-light radius over a total area of . The CMD and the RR Lyrae stars indicate the presence of a population as old and metal-poor as (at least) the Galactic globular clusters M68.
1 Introduction
The discovery of a new class of faint dwarf satellites around the Milky Way (MW; see e.g., Belokurov et al. 2006, 2010, and references therein) and the Andromeda galaxies (M31; see e.g., Richardson et al. 2011, and references therein) has opened a new window for the study of the formation history of large spirals.
The new systems show a number of remarkable differences with respect to the “classical” dwarf spheroidals (dSphs) surrounding the MW and M31: i) they have much lower surface brightnesses ( mag), for which they were named “ultra-faint” dwarfs (UFDs); ii) they are very metal poor, with large dispersions and [Fe/H] values as low as dex (see Tolstoy et al., 2009, and references therein). Such extreme abundances are not observed among the classical dSphs where only a few stars with [Fe/H] have been detected (Frebel at al., 2010) compared to the large number found in the MW halo; iii) they generally contain RR Lyrae stars that conform to the subdivision into Oosterhoff types I (Oo I) and II (OoII; Oosterhoff, 1939)111The Galactic globular clusters can be divided into two different groups according to the mean period of their ab-type RR Lyrae stars: Oosterhoff type I (Oo I) clusters have d, whereas type II (Oo II) clusters have d observed for field and cluster MW variables. So far, the only exception among the UFDs is Canes Venatici I (CVn I, Kuehn et al., 2008), the brightest of the MW UFDs, that, like the classical MW dSphs, has instead Oosterhoff-intermediate (Oo-Int) properties (Catelan, 2009; Clementini, 2010, and references therein); and, finally: iv) the UFDs discovered so far outnumber by almost a factor of two the classical dSphs, thus partially reducing the so-called “missing satellites problem” (Moore et al., 1999; Klypin et al., 1999) affecting the -cold-dark-matter (CDM) scenario of galaxy formation. With their properties the UFDs are potentially much better analogues than the classical dSphs of the “building blocks” that contributed to the formation of the two large spirals in the Local Group. They have absolute luminosities similar to the globular clusters (GCs; mag, on average) but they are much more spatially extended than GCs. With typical half-light radii of 100 pc, in fact they equal in size the “classical” dSphs. The UFDs are found in groups on the sky (see e.g. Fig. 1 of Richardson et al., 2011), have small velocity dispersions, and high mass-to-light ratios.
All UFDs host an ancient population around 10 Gyr old. They have GC-like color-magnitude diagrams (CMDs) resembling the CMDs of metal-poor Galactic GCs (GGCs) such as M92 (NGC 6341), M15 (NGC 7078) and M68 (NGC 4590). Some of the MW UFDs have a distorted shape due to the tidal interaction with the MW.
We are carrying out an extensive observational campaign of the new MW and M31 UFDs to study structural parameters and stellar population properties, as well as the variable stars of these systems. We have already published results for Bootes I (Boo I, Dall’Ora et al., 2006), CVn I (Kuehn et al., 2008), Canes Venatici II (CVnII, Greco et al., 2008), Coma (Musella et al., 2009), Leo IV (Moretti et al., 2009), and Ursa Major II (UMaII Dall’Ora et al., 2012) among the MW UFDs. With the only exception of CVn I, all these dwarfs contain RR Lyrae stars with pulsation periods suggesting an Oo II classification. However, only Boo I and CVn I contain sufficiently large numbers of variables to be safely classified into Oosterhoff types. The classification of the other UFDs is less certain given the small numbers of variables they contain. Nevertheless, their few variables clearly tend to have Oosterhoff type II properties. Thus, in terms of stellar metallicity and pulsation properties of the variable stars, systems similar to the UFDs, as they were at earlier times, could resemble the building blocks of the Galactic halo.
In this paper we extend our analysis to the Hercules UFD galaxy (R.A., Decl., J2000.0). The galaxy was discovered by Belokurov et al. (2007) from the analysis of SDSS data. The CMD of Hercules (based on follow-up Isaac Newton Telescope - INT- data) shows besides the red giant branch (RGB), also blue and red horizontal branches (HBs). Belokurov et al. (2007) interpreted this evidence as a possible signature of multiple stellar populations present in the galaxy. A number of studies have been devoted to this galaxy after the discovery paper. CMDs of Hercules reaching well below the galaxy’s main sequence turn-off were published by Coleman et al. (2007, in the and bands) and Sand et al. (2009, in the and bands), based on very wide-field observations obtained with the red and blue channels of the Large Binocular Camera (LBC; Giallongo et al. 2008) of the Large Binocular Telescope (LBT). According to the Sand et al. (2009) recovery of the galaxy’s star formation history (SFH), Hercules is old ( 12 Gyr, with negligible star formation in the last 12 Gyr) and metal-poor ([Fe/H] dex), with an intrinsic spread in metallicity and both [Fe/H] = dex and dex populations contributing to the SFH. In the literature there are several spectroscopic and photometric determinations of the metallicity of Hercules. These studies confirm that Hercules shows a spread in metal abundance, with values of the mean metallicity ranging from about 2.0 to 2.7 dex (Simon & Geha, 2007; Kirby et al., 2008; Koch et al., 2008; Sand et al., 2009; Adén et al., 2009, 2011).
The line of sight towards the Hercules dSph galaxy is heavily contaminated by Galactic foreground stars, making it hard to determine membership from the CMD alone. Even when radial velocities are added the selection remains uncertain, because the mean velocity of the Hercules dSph galaxy coincides with the velocity of the thick disk (Adén et al. 2009). Indeed, in the Adén et al. (2009) CMD, based on Strömgren photometry obtained with the Wide Field Camera of the INT, the RGB of Hercules is not easily identified due to the halo foreground contamination. These authors used the c1 index in the Strömgren system to disentangle the galaxy’s RGB and HB stars from the foreground contamination.
Hercules appears to be highly elongated. The galaxy’s structural parameters were obtained by a number of different authors (Belokurov et al., 2007; Coleman et al., 2007; Martin et al., 2008; Sand et al., 2009) who, fitting different stellar profiles to their independent photometric datasets, found similar values for the galaxy’s central position, position angle (), and ellipticity (), but rather different half-light radii. In a recent analysis, Peñarrubia et al. (2009) suggest that the density profiles of relaxed, tidally stripped dwarf spheroidals like Hercules are better approximated by a Plummer law. Moreover, Sand et al. (2009) clearly point out the need for deep photometry in order to properly constrain the structural parameters of the new faint MW satellites. In the following, we shall adopt the structural parameters obtained by Sand et al. (2009) assuming a Plummer stellar distribution, namely , and . Hercules has no evidence of internal rotation, and a very low velocity dispersion of km s-1 for Simon & Geha (2007) or 3.72 km s-1 for Adén et al. (2009). The explanation of such a large ellipticity in absence of a rotational support might imply that Hercules is not in dynamical equilibrium due to strong tidal distortions (see discussion in Coleman et al., 2007; Martin et al., 2008). The latest studies estimate distances in the range of kpc to kpc (see e.g. Coleman et al., 2007; Sand et al., 2009; Adén et al., 2011) and a total absolute magnitude ranging from mag to mag (see e.g. Sand et al., 2009; Martin et al., 2008).
The study presented in this paper is based on photometric time-series imaging covering a field of view (FOV) of (see Table 1), extending well beyond Hercules’ half-light radius. These data have allowed us to obtain a complete inventory of the variable stars belonging to the galaxy and to trace the corresponding parent stellar populations.
This paper is organized as follows: in Section 2 we present the observations and the data reduction procedures; Section 3 is devoted to the variable stars, whereas the CMDs and the implications for the structure of the Hercules UFD are discussed in Section 4. A new estimate of the distance to Hercules based on the galaxy’s RR Lyrae stars is presented in Section 5. Finally, the summary and conclusions in Section 6 close the paper.
2 Observations and Data Reduction
Time-series observations in and of the Hercules UFD were obtained over the period 2007 April to 2009 June, using a number of different telescopes. The collected data and related telescopes/instrumental set-ups are summarized in Table 1, where and are the number of frames in the and bands, respectively.
Pre-reduction of the images was performed by following standard procedures (bias subtraction and flat-field correction) with IRAF222IRAF is distributed by the National Optical Astronomy Observatories, which are operated by the Association of Universities for Research in Astronomy, Inc., under cooperative agreement with the National Science Foundation, except for the WFI data, for which the pre-reduction was carried out using the VST-Tube pipeline (Grado et al., 2012). We then performed PSF photometry using the DAOPHOT IV/ALLSTAR/ALLFRAME packages (Stetson 1987, 1994). After an accurate evaluation of the PSF of each individual frame, a reference image was built by averaging all the available frames and a source catalogue was extracted from the stacked image. The source list was then passed to ALLFRAME, in order to obtain a homogeneous photometry of all images simultaneously, thus providing and instrumental magnitude catalogues for each telescope. Typical internal errors of the single-frame photometry for stars at the HB magnitude level ( mag) are of about 0.01 mag in both bands.
The absolute photometric calibration was derived using observations of standard stars in the Landolt fields SA 101, SA 107, SA 110 and PG1323 (Landolt, 1992, 2009), as extended by Stetson (2000)333see http://cadcwwwdao.nrc.ca/standards., which were obtained at the INT during the night of 2007 April 22. Errors of the absolute photometric calibration are and mag. As the various telescopes we have used define slightly different photometric systems, each individual dataset was tied to the INT standard calibration independently. The calibrated catalogues were then combined using DAOMASTER (Stetson, 1994) to create a final list containing positions, robust intensity-weighted mean and magnitudes (Stetson, 1994), and weighted average values of the and parameters444In the single frame photometry file, the parameter of each star is a robust estimate of the observed pixel-to-pixel scatter of the fitting residuals to the expected scatter, whereas the parameter is related to the intrinsic angular size of the astronomical objects, and for stellar objects should have a value close to zero (Stetson, 1987). for all objects. We have adopted and to select the stellar-like objects imaged in our total FOV of about . This selection is reliable for magnitudes brighter than 24 mag, while the uncertainty increases at fainter magnitudes.
3 Variable Stars
Variable stars were identified from the and time-series data, separately. First, we calculated the Fourier transforms (in the Schwarzenberg-Czerny 1996 formulation) of the stars having at least 12 measurements in each photometric band, then we averaged these transforms to estimate the noise and calculated the signal-to-noise ratios (S/Ns). Results from the and photometries were cross-correlated, obtaining a list of 860 stars with in both photometric bands (see e.g. Musella et al. 2009). A visual inspection of the light curves allowed us to confirm the variability of 10 of these candidates. We also analyzed in detail all stars falling on the HB, in the region above the HB, where the Anomalous Cepheids are generally located, and in the Blue Straggler region, where one may expect to find variables of the SX Phoenicis type. No further variable stars were identified, thus confirming the reliability of our procedure to identify variable stars. To study the light curves we used the software Graphical Analyzer of Time Series (GRaTiS; see e.g., Clementini et al. 2000) that, beyond confirming the variability for all the 10 candidates, also provided periods accurate to 4-6 decimal places for all of them. The Hercules variables include 1 Anomalous Cepheid (AC) and 9 RR Lyrae stars, of which 6 are fundamental-mode (RRab) and 3 are first-overtone (RRc) pulsators.
Classification and properties of the confirmed variable stars are summarized in Table 2, whereas their light curves are shown in Figs. 1 and 2. We have assigned to the variables increasing numbers starting from the galaxy center that was set at R.A., Decl., J2000.0 (Sand et al., 2009). Time-series data for the variable stars are provided in Table 3. The light curves are very well sampled, and show very little scatter, except for star V10. The star does not appear to be blended with other stars on the images. We suspect that V10 might be affected by the Blazhko effect (Blazhko, 1907).
We note that, according to the period, the AC (star V2) could as well be a fundamental-mode RR Lyrae star. However, the star’s average magnitude is about 0.4-0.5 mag brighter than the HB level. This occurrence, together with a too small amplitude for the star’s short period, suggest that the variable either suffers from blending by a contaminant star or is, perhaps, an AC. The photometric parameters (goodness of the PSF fitting) and (estimate of the object shape) provided for V2 by the ALLFRAME package seem to rule out the presence of detectable companions around the star, thus favoring the AC hypothesis. Another possibility is that V2 could be an overluminous RRc as, for instance, V70 in the M3 GGC. However, the period of V2 (0.53777 d) is definitely longer than that of M3-V70 ( d, Kaluzny et al. 1998, Carretta et al. 1998). On the other hand, the mean magnitude and the period of V2 are in very good agreement with the AC period-luminosity relations by Bersier & Wood (2002, and references therein), Marconi et al. (2004) and Baldacci et al. (2004, and references therein), thus favoring an AC classification for V2. Finally, as described in Section 4, the AC classification is further supported by the comparison with evolutionary tracks.
The AC, all the RRc variables and three of the RRab stars lie inside the half-light radius of the Hercules galaxy. One RRab is just on the border of this region and the remaining two RRab stars lie well outside the half-light radius, with the farthest from the center being confirmed as a member by Adén et al. (2009) on the basis of both radial velocity and Strömgren photometry (see Section 4 and Figs. 4 and 6 for details). All the RR Lyrae stars fall on the HB of the Hercules UFD, and their mean magnitude is consistent, within the errors, with the average luminosity of the HB inferred by fitting the galaxy CMD with the ridge line of the GGC M68 (see section 4 for details).
The mean period of the RRab stars is d (=0.03 d), thus classifying Hercules as an Oosterhoff type-II system. Fig. 3 shows the position of the Hercules RR Lyrae stars on the -band period-amplitude (Bailey) diagram. We have also reported the RR Lyrae stars identified in the other MW UFDs we have studied so far, for comparison. Hercules’ RRab stars (star symbols) lie closer to the loci of the Oo II systems (from Clement & Rowe, 2000, solid line) and the RRc stars fall on the long-period tail of the bell-shaped distribution defined by RRc stars in Oo II systems (see, e.g., Fig. 9 of Di Criscienzo et al. 2011, and Fig. 4 of Cacciari et al. 2005).
3.1 Metallicity and reddening from the RR Lyrae stars
As shown by Jurcsik & Kovács (1996), it is possible to use the shape of an RR Lyrae -band light curve to obtain an estimate of the star’s metallicity. We have performed a Fourier decomposition of the -band light curves of the variables in Hercules and calculated amplitude ratios and phase differences . We list in Table 4 these quantities up to the term . The Fourier parameters were then used along with the formulae provided by Jurcsik & Kovács (1996) and Morgan et al. (2007) for ab- and c-type RR Lyrae stars, respectively, to obtain individual metallicities for the Hercules RR Lyrae stars, except for V10 whose light curve is too noisy for a reliable application of the Jurcsik & Kovacs method. The metallicity estimates obtained with this technique are reported in column 2 of Table 5; they are on the Zinn & West (1984) scale. These individual metallicities were transformed to the Carretta et al. (2009) metallicity scale (using the Kapakos et al. 2011 transformations for the ab-type variables, and the Carretta et al. 2009 recalibration for the c-type RR Lyrae stars, see Column 3 of Table 5). We then averaged these values (weighted average) to obtain our best estimate for the metallicity of Hercules’ old population. Our resultant metallicity is dex.
Literature values for the Hercules UFD’s metal abundance are summarized in Table 6. They were obtained using a variety of different methods and span a rather large range. In particular, we note that the values from Coleman et al. (2007) and Sand et al. (2009) are photometric estimates based on fitting the galaxy’s CMD with evolutionary tracks, while all other entries in the table are spectroscopic determinations. Specifically, the Koch et al. (2008) value is based on abundance analysis of medium-high resolution () spectra of two stars in Hercules. The Simon & Geha (2007) analysis is based on medium-resolution spectra of 30 red giants in Hercules, and the measurement of the equivalent widths of the Ca triplet absorption lines. The Kirby et al. (2008) study is a re-analysis of the Simon & Geha (2007) spectroscopic data, based on an automated spectral synthesis technique. This latter method likely provides systematically lower metallicities (by dex), as discussed by the authors themselves (see Kirby et al., 2009, 2010).
Finally, in a recent study, Adén et al. (2011) confirm that a large metallicity spread ( dex, for an average value of [Fe/H]= dex) exists in Hercules, from the analysis of medium-high resolution () spectra of 11 RGB stars. However, taking into account only the red giants with metallicity measurements based on a significant number of iron lines (; four stars according to Table 6 in Adén et al. 2011), we obtain dex (and a range of ( dex). This value is in excellent agreement with our estimate from the RR Lyrae stars. On this basis, we will adopt the metallicity estimate obtained from the RR Lyrae stars in the following analysis.
Hercules’ reddening can be estimated from the galaxy’s RR Lyrae stars. Using the relation for RRab stars by Piersimoni et al. (2002), that connects the color excess to the star’s B-band amplitude, the logarithm of the period and the metallicity, we obtain a mean color excess mag, where we have adopted the individual metallicities on the Carretta et al. (2009) scale listed in Table 5. We also use the method by Sturch (1966), which is based on the RR Lyrae’s color at minimum light, and obtain mag, by applying the metallicity-dependent relation by Clementini et al. (2003). This estimate is larger than the previous value but, as already pointed out by Walker (1998) and Clementini et al. (2003), Sturch’s method overestimates the color excess by 0.01-0.03 mag. We therefore adopt mag for the reddening. This is in very good agreement with the value of mag derived from the Schlegel et al. (1998) maps.
4 CMD and structure of Hercules
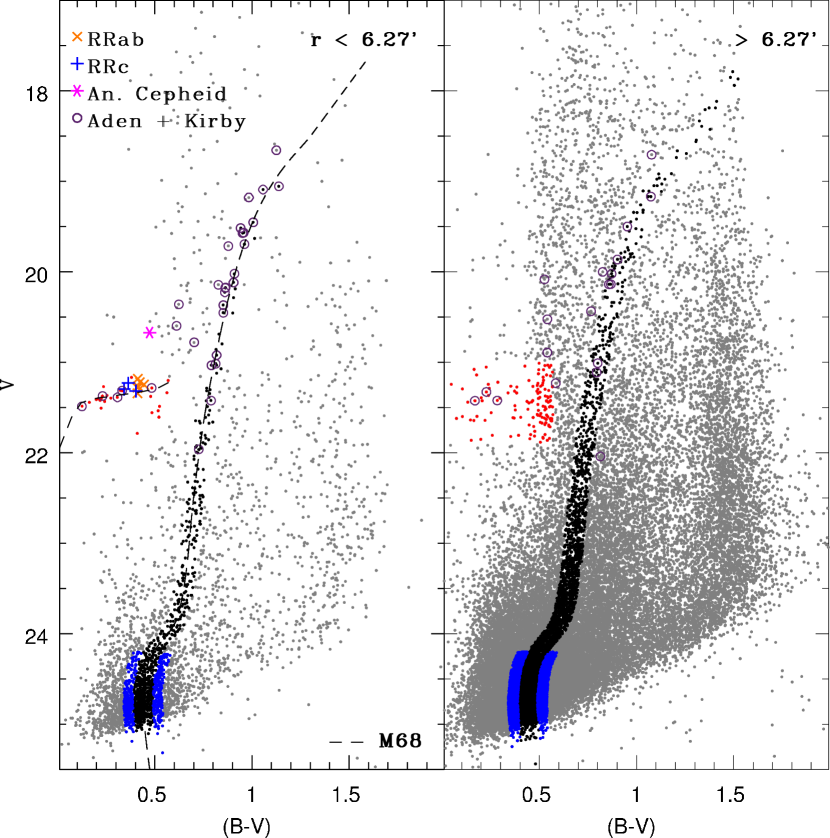
Fig. 4 shows the , CMD of Hercules obtained in the present study. In the left panel we plot stellar-like objects within the galaxy’s half-light radius; in the right panel, instead, we show objects outside this region over our FOV of . All the RR Lyrae stars have been plotted in the left panel of the figure including those falling outside the galaxy half-light radius. The CMD reaches 25 mag and appears to be heavily contaminated at each magnitude level by field objects belonging to the MW halo and disk, as well as by background galaxies. Our photometry reaches a few magnitudes deeper than the SDSS photometry (see Fig. 2 of Belokurov et al. 2007); while it is roughly 1 mag shallower than the photometry obtained using the LBT (Fig. 1 in Coleman et al. 2007, and Fig. 8 in Sand et al. 2009). However, within the errors, it is consistent both in and , with the photometry reported in Table 2 of Sand et al. (2009).
In Fig. 4, the main branches of the Hercules CMD are barely distinguishable due to the overwhelming contamination by the MW field. To identify stars belonging to Hercules we used the method that we have already successfully applied in our previous papers (see e.g., Musella et al. 2009; Moretti et al. 2009). Specifically, we used the mean ridgelines of the GGC M68 (dashed black lines in Figure 4), obtained from Walker (1994) photometry to fit the HB and RGB of the Hercules UFD, by letting the M68 ridgelines vary within the values of the cluster reddening and distance modulus available in the literature. The “by eye” best fit was obtained for a shift of mag in magnitude and mag in color. We adopted M68 for identifying members of the Hercules UFD because, like Hercules, it is very metal-poor. Its metallicity, dex (Carretta et al., 2009), is in very good agreement with the mean metallicity obtained in section 3.1 from the Hercules RR Lyrae stars. Furthermore, the cluster has a well-defined and tight RGB, as well as an extended HB including stars both redder and bluer than the RR Lyrae instability strip (Walker 1994), thus resulting better suited to identify the galaxy’s HB than, for instance, M92, which instead was used as a fiducial by Belokurov et al. (2007). With this procedure we selected as most probable members of the Hercules galaxy the sources lying within mag in from the ridgelines of M68 (black dots in the left panel of Figure 4). To account for the larger photometric errors, below mag we extended this range within mag of the ridgeline of M68 (blue dots) Adopting for M68 a reddening value of mag (Walker, 1994) the color shifts needed to match the HB and RGB of Hercules imply a reddening of mag for the galaxy, in excellent agreement with the value obtained from the RRab stars (see Section 3.1). Totally similar results are obtained using the ridgelines of the GGC M15 that is slightly more metal-poor than M68 and matches equally well the main branches of the Hercules CMD, whereas the ridgeline of the metal-intermediate GC M3 (NGC 5272; Ferraro et al., 1997; Johnson & Bolte, 1998) is too red and would require a negative reddening to match the galaxy RGB.
With the help of M68 ridgelines, it is possible to determine the average luminosity of the Hercules HB in the region of the so-called RR Lyrae gap ( mag), and to locate the galaxy’s main-sequence turnoff at mag.
Our identification of Hercules members is supported by the spectroscopic study of Kirby et al. (2008, 20 stars) and the spectrophotometric analysis of Adén et al. (2009, 47 stars), with membership to the Hercules UFD confirmed by radial velocity measurements and, for Adén et al. (2009)’s sample, also by Strömgren photometry (violet open circles in Fig. 4). The excellent agreement between these studies and our results supports the reliability of the procedure we have used to select Hercules members and to identify the HB.
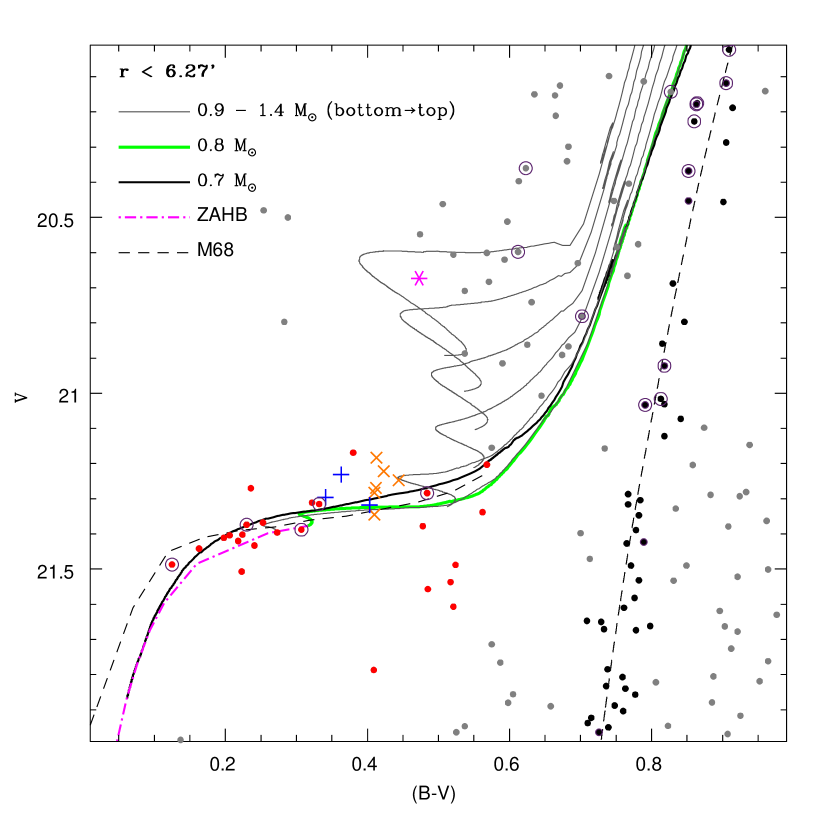
Belokurov et al. (2007) compared the galaxy’s CMD with the ridge-line of the GGC M92 ( dex) and M13 ( dex) and concluded that the morphological features of Hercules CMD are generally well described by the ridge line of the old, metal-poor globular cluster M92. Using suitable metal-poor evolutionary tracks and their deep LBT photometry to recover the galaxy’s SFH, Coleman et al. (2007) and Sand et al. (2009) find that Hercules hosts a single old stellar population ( Gyr), and shows no evidence of significant subsequent star formation events. This is in contrast with the Belokurov et al. (2007) claim that Hercules’ extended HB showing both a blue and a red component might be the signature of possible multiple stellar populations in the galaxy. However, Belokurov et al. (2007)’s argument cannot be considered conclusive, as the morphology of the HB is driven by a complex interplay of different effects, traditionally known in the literature related to GGCs as the “second parameter problem” (see e.g. Lee, Demarque & Zinn, 1994; Buonanno et al., 1997; Catelan, 2009; Gratton et al., 2010, and references therein). On the other hand, in the region of the CMD above the HB ( and mag), there seems to be an overabundance of stars that might represent the signature of an intermediate-age population in Hercules. Unfortunately, the contamination by field stars in this region of the CMD is very high (see right panel of Fig. 4), thus we cannot reach any firm conclusion with our data. An analysis of the existent literature data shows that the HB and the brighter portions of Hercules’ CMD are very poorly populated in the LBT photometry of Coleman et al. (2007) and Sand et al. (2009), likely due to saturation effects, and cannot be used to check the possible existence of such an excess above the HB. However, an overabundance of stars brighter than the HB was observed in Hercules also by Adén et al. (2009), who investigated whether they might be variables, based on the magnitude variation in their few (no more than 3) epoch data for the stars. They provide a list of possible variable stars in their Table 7. Though we note that these candidate variables are not included in the Adén et al. (2009) final list of Hercules members, we checked them in our time series photometry, and do not confirm their variability. However, we have identified an AC variable in this region above the HB, star V2 (asterisk in Fig. 4, see Section 3). In Fig. 5 we show an enlargement of the HB region of the CMD in Fig. 4 (with the same color coding), where we have plotted the helium burning evolutionary tracks of the stellar model database BaSTI555The BaSTI database is available at: http://www.oa-teramo.inaf.it/BASTI (Pietrinferni et al., 2004, 2006), for stellar masses in the range of 0.7 to 1.4 (with a step of 0.1 ) and metal abundance . In particular, the thick (black and green) lines are the HB evolutionary tracks for 0.7 and 0.8 , respectively, whereas the thin (grey) lines are for including the range of masses corresponding to the HB turnover (Caputo & Degl’Innocenti, 1995). The magenta dot-dashed line represents the Zero Age Horizontal Branch (ZAHB) for the same chemical composition. The location of the RR Lyrae stars is consistent with the model predictions and suggests an evolutionary effect for some of them. On the other hand, the AC, star V2, is, as expected, consistent with the evolution of a from the turnover region of the ZAHB. The origin of ACs is still debated (see e.g. Marconi et al., 2004, and references therein) and the most widely accepted interpretations are: (1) they are young ( Gyr) single stars due to recent star formation; (2) they formed from mass transfer in binary systems as old as the other stars in the same stellar system. Our analysis does not allow us to discriminate between these two scenarios, however, we note that, in the first hypothesis, the comparison of V2 with the evolutionary tracks would suggest the existence in Hercules of an intermediate-age population of stars as old as Gyrs.
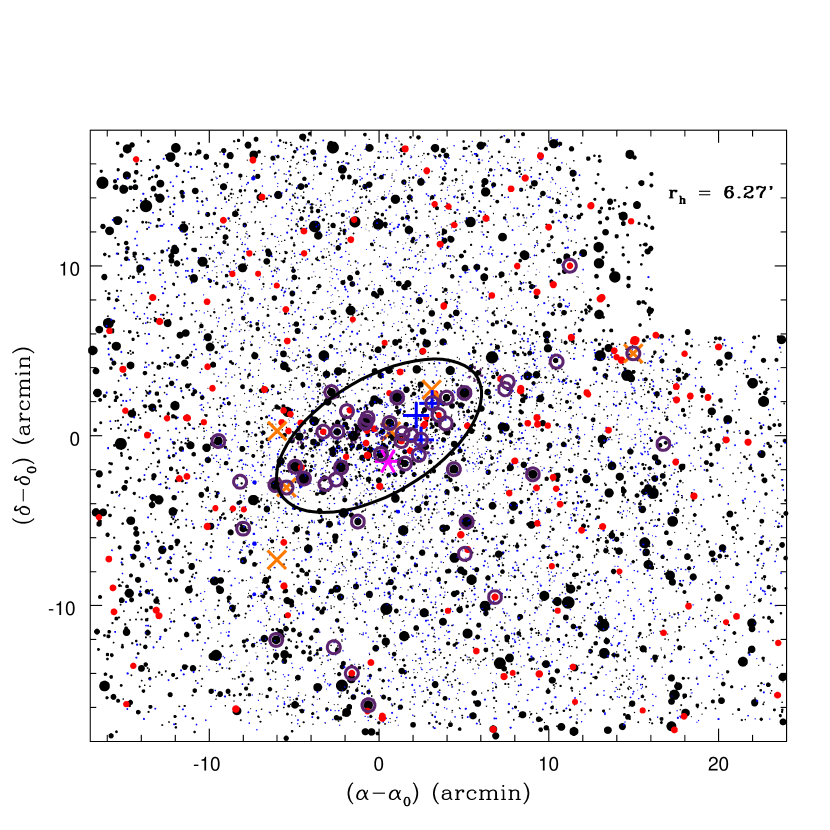
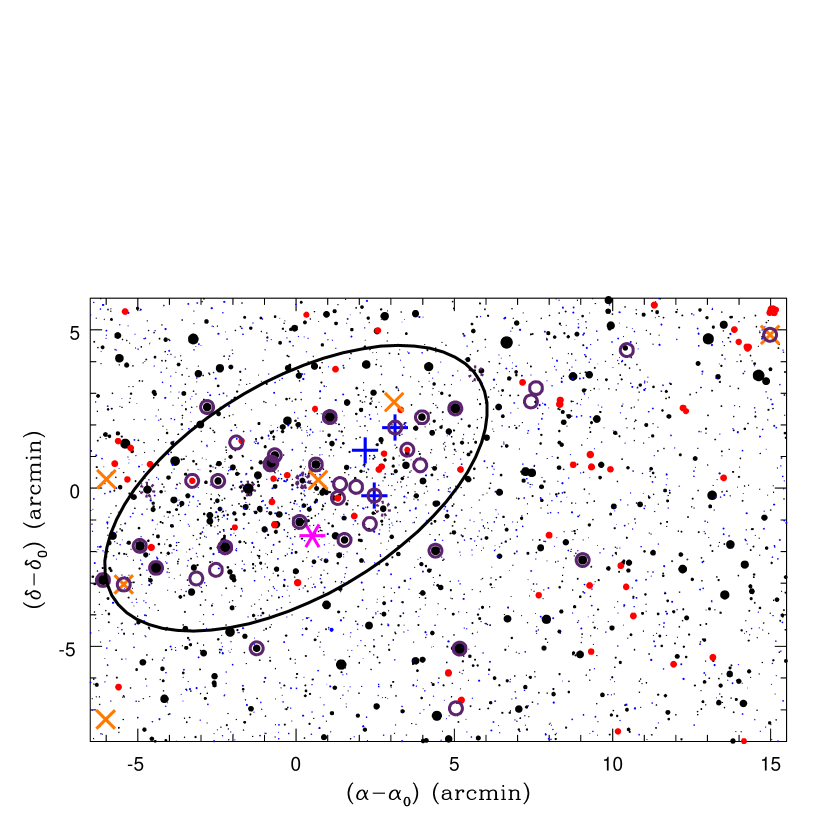
Fig. 6 shows the position of the stars we consider to be members of the Hercules galaxy in our FOV. Symbols and color-coding are the same as in Fig. 4, and the symbol size is inversely proportional to the object’s magnitude. The black ellipse corresponds to the half-light radius, the angle position, and the ellipticity obtained for Hercules by Sand et al. (2009). This map confirms that the galaxy is elongated and has an irregular and extended shape. Likely, Hercules was disrupted due to tidal interaction and is now embedded in the MW halo. Our discovery of two RRab variables outside the half-light radius, together with the spectrophotometric identification in the same external region of some stars with confirmed membership by Adén et al. (2009), support the tidal interaction scenario. Fig. 7 shows an enlargement of the map in Fig. 6 with the galaxy half-light radius region and all the variable stars identified in the present work.
5 A new estimate of the distance to Hercules
The RR Lyrae stars we have detected in Hercules give us the opportunity to estimate the distance to the galaxy using these variables as standard candles.
The position of the Hercules RR Lyrae stars in the CMD is in satisfactory agreement with the fiducial-line HB of M68, although with a significant spread. The most deviating (brightest) of the RR Lyrae variables, star V9, is located well outside the galaxy’s half-light radius (see Figs. 6 and 7). Thus, its high luminosity could be caused by a projection effect. The average magnitude of the RR Lyrae stars lying inside the galaxy’s half-light radius is mag (average on 7 stars), where the error is the standard deviation of the mean. To obtain the absolute visual magnitude of Hercules’ HB stars, we adopt for the slope of the RR Lyrae magnitude-metallicity calibration the value mag dex-1 (Clementini et al., 2003), and consider two different calibrations of the zero point. At [Fe/H]= dex, we adopt: mag, that is based on the Large Magellanic Cloud distance modulus of 18.52 mag of Clementini et al. (2003), and, alternatively, mag, from Benedict et al. (2011). Adopting for metallicity and reddening the values derived in Section 3.1 ( dex, and mag, respectively) we obtain true distance moduli of mag ( kpc), and mag ( kpc), for the Clementini et al. (2003) and Benedict et al. (2011) calibrations, respectively. The errors on the distance values include the contribution of the uncertainties on the metallicity, the reddening, the adopted slope of the relation, and the average apparent visual magnitude of the Hercules RR Lyrae stars.
An additional estimate of the distance, based on the RR Lyrae stars, can be obtained using the theoretical Wesenheit relation in the bands, as defined by Di Criscienzo, Marconi & Caputo (2004), with the assumption of a suitable evolutionary mass for the metallicity of Hercules RR Lyrae stars. The resulting distance modulus of mag is in perfect agreement with . Moreover, a distance of kpc is in excellent agreement with the estimates by Coleman et al. (2007), Martin et al. (2008), Sand et al. (2009), and in statistical agreement with the distance by Belokurov et al. (2007). On the other hand, the distance appears to be only in statistical agreement with all previous determinations. To conclude this discussion, we note that the very long estimate of kpc, obtained by Adén et al. (2009) is likely due to their HB mean magnitude being based on a few stars, of which some are variables observed at random phase, as we have confirmed in our study.
Finally, the apparent distance modulus adopted in Fig. 5, mag, corresponds to a true distance modulus of 20.7 mag. However, we should take into account the theoretical uncertainties on the luminosity of the ZAHB and, in particular, the remark by Cassisi et al. (2007) that, adopting updated conductive opacities, might cause an increase in the of about 0.06 mag at the metallicity of Hercules, and a corresponding decrease in the inferred distance modulus. On this basis, and considering also the results of the theoretical Wesenheit relation, we thus conclude that our most reliable estimate for the distance modulus of Hercules is: mag.
6 SUMMARY AND CONCLUSIONS
In this paper we have presented the first time-series analysis of the Hercules UFD. Using a variety of telescope/instrument facilities we secured 80 and 50 epochs in and . These data allowed us to detect and characterize 9 RR Lyrae stars (6 ab- and 3 c-type, respectively) and one Anomalous Cepheid. The same observations allowed us to build a deep CMD extending well beyond the galaxy’s half-light radius. The main results of this study are listed below:
-
•
The average period of the ab-type RR Lyrae stars, P0.68 d, qualifies Hercules as an Oosterhoff II system, in good agreement with the vast majority of the UFDs investigated so far. This occurrence favors the hypothesis that the UFDs could be the “building blocks” of the Galactic halo, since the pulsation characteristics of their RR Lyrae stars are in agreement with the properties of the MW halo variables.
-
•
Hercules’ CMD is dominated by a stellar population at least as old and metal-poor as the GGC M68. This result is in agreement with previous findings. The HB shows some spread. We also detected an overabundance of stars above the HB, thus confirming the previous finding by Adén et al. (2009). This, along with the detection of an Anomalous Cepheid very likely belonging to Hercules, hints at the possible presence of an intermediate-age population about Gyrs old in Hercules.
-
•
The spatial distribution of Hercules’ stars confirms the elongated shape of this galaxy. The signature that Hercules is undergoing tidal disruption is provided by the absence of a clearcut difference between galaxy and field star properties, and by the presence of two RR Lyrae stars lying well beyond the galaxy’s half-light radius.
-
•
The RR Lyrae variables were used to obtain independent estimates of the metallicity, reddening and distance to Hercules, for which we find [Fe/H]= dex, mag, and mag respectively, in very good agreement with literature values.
References
- Adén et al. (2009) Adén, D., Feltzing, S., Koch, A., et al. 2009, A&A, 506, 1147
- Adén et al. (2011) Adén, D., Eriksson, K., Feltzing, S., et al. 2011, A&A, 525, A153
- Baldacci et al. (2004) Baldacci, L., Clementini, G., Held, E. V., Marconi, M., & Rizzi, L. 2004, Communications in Asteroseismology, 145, 32
- Belokurov et al. (2006) Belokurov, V., Zucker, D. B., Evans, N. W., et al. 2006, ApJ, 647, L111
- Belokurov et al. (2007) Belokurov, V., Zucker, D. B., Evans, N. W., et al. 2007, ApJ, 654, 897
- Belokurov et al. (2010) Belokurov, V., Walker, M. G., Evans, N. W., et al. 2010, ApJ, 712, L103
- Benedict et al. (2011) Benedict, G. F., McArthur, B. E., Feast, M. W., et al. 2011, AJ, 142, 187
- Bersier & Wood (2002) Bersier, D., & Wood, P. R. 2002, AJ, 123, 840
- Blazhko (1907) Blazhko, S., 1907, Astron. Nachr. 175, 325
- Buonanno et al. (1997) Buonanno, R., Corsi, C., Bellazzini, M., Ferraro, F. R., Fusi Pecci, 1997, AJ, 113, 706
- Cacciari et al. (2005) Cacciari, C., Corwin, T. M., & Carney, B. W. 2005, AJ, 129, 267
- Caputo & Degl’Innocenti (1995) Caputo, F., & degl’Innocenti, S. 1995, A&A, 298, 833
- Carretta et al. (1998) Carretta, E., Cacciari, C., Ferraro, F. R., Fusi Pecci, F., & Tessicini, G. 1998, MNRAS, 298, 1005
- Carretta et al. (2009) Carretta, E., Bragaglia, A., Gratton, R., D’Orazi, V., Lucatello, S., 2009, A&A, 508, 695
- Cassisi et al. (2007) Cassisi, S., Potekhin, A. Y., Pietrinferni, A., Catelan, M., & Salaris, M. 2007, ApJ, 661, 1094
- Catelan (2009) Catelan, M., 2009, Ap&SS 320, 261
- Clement & Rowe (2000) Clement & Rowe 2000, AJ, 120, 2579
- Clementini (2010) Clementini, G. 2010, in Variable Stars, the Galactic Halo and Galaxy Formation, Eds. N. Samus, C. Sterken, L. Szabados, Sternberg Astronomical Institute Publications, p. 111, (arXiv:1002.1575)
- Clementini et al. (2000) Clementini, G., et al., 2000, AJ, 120, 2054
- Clementini et al. (2003) Clementini, G., Gratton, R. G., Bragaglia, A., Carretta, E., Di Fabrizio, L., & Maio, M. 2003, AJ, 125, 1309
- Coleman et al. (2007) Coleman, M. G., et al., 2007, AJ, 134, 1938
- Dall’Ora et al. (2006) Dall’Ora, M., et al. 2006, ApJ 653, L109
- Dall’Ora et al. (2012) Dall’Ora, M., et al. 2012, ApJ, accepted, arXiv:1203.5321
- Di Criscienzo et al. (2011) Di Criscienzo, M., Greco, C., Ripepi, V., Clementini, G., Dall’Ora, M., Marconi, M., Musella, I., Federici, L., Di Fabrizio, L. 2011, AJ, 141, 81
- Di Criscienzo, Marconi & Caputo (2004) Di Criscienzo, M., Marconi, M., Caputo, F. 2004, ApJ 612, 1092
- Durrell & Harris (1993) Durrell, P. R., & Harris, W. E. 1993, AJ, 105, 1420
- Ferraro et al. (1997) Ferraro, F. R., Carretta, E., Corsi, C. E., Fusi Pecci, F., Cacciari, C., Buonanno, R., Paltrinieri, B., & Hamilton, D. 1997, A&A, 320, 757
- Frebel at al. (2010) Frebel, A., Kirby, E. N., & Simon, J. D. 2010, Nature, 464, 72
- Giallongo et al. (2008) Giallongo, E., Ragazzoni, R., Grazian, A., et al. 2008, A&A, 482, 349
- Grado et al. (2012) Grado, A., Capaccioli, M., Limatola, L., & Getman, F. 2012, Memorie della Societa Astronomica Italiana Supplementi, 19, 362
- Gratton et al. (2010) Gratton, R. G., Carretta, E., Bragaglia, A., Lucatello, S., D’Orazi, V. 2010, A&A, 517, 81
- Greco et al. (2008) Greco, C., et al. 2008, ApJ 695, L83
- Johnson & Bolte (1998) Johnson, J. A., & Bolte, M. 1998, ApJ, 115, 693
- Jurcsik & Kovács (1996) Jurcsik, J. & Kovács, G. 1996, A&A, 312, 111
- Kaluzny et al. (1998) Kaluzny, J., Hilditch, R. W., Clement, C., & Rucinski, S. M. 1998, MNRAS, 296, 347
- Kapakos et al. (2011) Kapakos, E., Hatzidimitriou, D., & Soszyński, I. 2011, MNRAS, 415, 1366
- Kirby et al. (2008) Kirby, E. N., Simon, J. D., Geha, M., Guhathakurta, P., & Frebel, A. 2008, ApJ, 685, L43
- Kirby et al. (2009) Kirby, E. N., Guhathakurta, P., Bolte, M., Sneden, C., & Geha, M. C. 2009, ApJ, 705, 328
- Kirby et al. (2010) Kirby, E. N., Guhathakurta, P., Simon, J. D., et al. 2010, ApJS, 191, 352
- Klypin et al. (1999) Klypin, A., Kravtsov, A. V., Valenzuela, O., & Prada, F. 1999, ApJ, 522, 82
- Koch et al. (2008) Koch, A., McWilliam, A., Grebel, E. K., Zucker, D. B., & Belokurov, V. 2008, ApJ, 688, L13
- Kuehn et al. (2008) Kuehn, C., et al. 2008, ApJ 674, L1381
- Landolt (1992) Landolt, A. U. 1992, AJ, 104, 340
- Landolt (2009) Landolt, A. U. 2009, AJ, 137, 4186
- Lee, Demarque & Zinn (1994) Lee, Y.-W., Demarque, P., Zinn, R 1994, ApJ, 423, 248
- Marconi et al. (2004) Marconi, M., Fiorentino, G., & Caputo, F. 2004, A&A, 417, 1101
- Martin et al. (2008) Martin, N. F., de Jong, J. T. A., Rix, H.-W. 2008, ApJ 684, 1075
- Moore et al. (1999) Moore, B., Ghigna, S., Governato, F., et al. 1999, ApJ, 524, L19
- Moretti et al. (2009) Moretti, M.I., et al. 2009, ApJ 699, L125
- Morgan et al. (2007) Morgan, S. M., Wahl, J. N., & Wieckhorst, R. M. 2007, MNRAS, 374, 1421
- Musella et al. (2009) Musella, I., et al. 2009, ApJ 675, L73
- Oosterhoff (1939) Oosterhoff, P. T. 1939, The Observatory, 62, 104
- Peñarrubia et al. (2009) Peñarrubia, J., Navarro, J. F., McConnachie, A. W., & Martin, N. F. 2009, ApJ, 698, 222
- Piersimoni et al. (2002) Piersimoni, A. M., Bono, G., & Ripepi, V. 2002, AJ, 124, 1528
- Pietrinferni et al. (2004) Pietrinferni, A., Cassisi, S., Salaris, M., & Castelli, F. 2004, ApJ, 612, 168
- Pietrinferni et al. (2006) Pietrinferni, A., Cassisi, S., Salaris, M., & Castelli, F. 2006, ApJ, 642, 797
- Richardson et al. (2011) Richardson, J.C. et al. 2011, ApJ, 732, 76
- Sand et al. (2009) Sand, D. J., Olszewski, E. W., Willman, B., Zaritsky, D., Seth, A., Harris, J., Piatek, S., Saha, A., 2009, ApJ, 704, 898
- Schlegel et al. (1998) Schlegel, D. J., Finkbeiner, D. P., & Davis, M. 1998, ApJ, 500, 525
- Schwarzenberg-Czerny (1996) Schwarzenberg-Czerny, A. 1996, ApJ, 460, L107
- Simon & Geha (2007) Simon, J. D., & Geha, M. 2007, ApJ, 670, 313
- Stetson (1987) Stetson, P. B. 1987, PASP, 99, 191
- Stetson (1994) Stetson, P. B. 1994, PASP, 106, 250
- Stetson (2000) Stetson, P. B. 2000, PASP, 112, 925
- Sturch (1966) Sturch, C. 1966, ApJ, 143, 774
- Tolstoy et al. (2009) Tolstoy, E., Hill, V., Tosi, M. 2009, ARA&A, 47, 371
- Walker (1994) Walker, A. R. 1994, AJ, 108, 555
- Walker (1998) Walker, A. R. 1998, AJ, 116, 220
- Zinn & West (1984) Zinn, R. & West, M. J. 1984, ApJS, 55, 45


| Dates | Telescope/Instrument | Detector | Resolution | FOV | NB | NV |
|---|---|---|---|---|---|---|
| (pixel) | ( /pixel) | |||||
| Apr. 2007-May2008 | 2.5m INT/Wide Field Camera | 4 of 4k 2k | 0.33 | 34’ 34’ | 52 | 32 |
| May 2007 | 4.2m WHT/Prime Focus Camera | 2 of 2k 4k | 0.24 | 16.2’ 16.2’ | 5 | 4 |
| Jul. 2007 | 2.2m ESO/Wide Field Imager | 8 of 2k 4k | 0.238 | 34’ 33’ | 7 | 7 |
| Jul. 2008 | 2m LT/Ratcam optical CCD camera | 2k 2k | 0.270a | 4.6’ 4.6’ | 24b | 22b |
| Jan-Jun 2009 | 2m Faulkes Telescope North/EM01 | 2k 2k | 0.278a | 4.7’ 4.7’ | 14c | 7d |
a Binning 22
b We covered 6 different fields around the galaxy center published by Belokurov et al. (2007)
c We covered 4 different fields around the galaxy center
d We covered 2 different fields around the galaxy center
| Namea | Type | P | Epochb | ||||||
|---|---|---|---|---|---|---|---|---|---|
| (2000) | (2000) | (days) | (2450000) | (mag) | (mag) | (mag) | (mag) | ||
| V1 | 16:31:02.17 | 12:47:33.7 | RRab | 0.639206 | 4870.149 | 21.27 | 21.68 | 1.06 | 1.16 |
| V2 | 16:31:02.91 | 12:45:48.5 | AC | 0.53777 | 4614.590 | 20.72 | 21.14 | 0.45 | 0.59 |
| V3 | 16:30:54.93 | 12:47:04.2 | RRc | 0.39997 | 4614.6767 | 21.32 | 21.72 | 0.48 | 0.61 |
| V4 | 16:30:56.14 | 12:48:29.2 | RRc | 0.39576 | 4612.5745 | 21.23 | 21.59 | 0.58 | 0.69 |
| V5 | 16:30:52.28 | 12:49:12.0 | RRc | 0.40183 | 4212.699 | 21.30 | 21.64 | 0.47 | 0.61 |
| V6 | 16:30:52.41 | 12:49:60.0 | RRab | 0.69981 | 4232.700 | 21.35 | 21.76 | 0.90 | 1.19 |
| V7 | 16:31:29.48 | 12:47:34.9 | RRab | 0.67799 | 4613.456 | 21.22 | 21.65 | 0.81 | 1.03 |
| V8 | 16:31:27.20 | 12:44:16.7 | RRab | 0.66234 | 4613.497 | 21.25 | 21.69 | 0.90 | 1.09 |
| V9 | 16:31:29.50 | 12:40:03.1 | RRab | 0.72939 | 4214.6101 | 21.18 | 21.60 | 0.80 | 1.00 |
| V10c | 16:30:03.96 | 12:52:06.3 | RRab | 0.6616 | 4210.679 | 21.28 | 21.69 | 1.17 | 1.32 |
a We have named the variable stars with an increasing number starting from Sand et al. (2009) center for Hercules
b Epoch corresponds to the time of maximum light.
c This star has very scattered light curves
| Hercules - Star V8 - RRab | |||||
| HJD | V | HJD | B | ||
| (2454211) | (mag) | (mag) | (2454211) | (mag) | (mag) |
| 0.652005 | 21.26 | 0.02 | 0.640218 | 21.69 | 0.02 |
| 0.676609 | 21.31 | 0.02 | 0.664420 | 21.72 | 0.02 |
| 0.702719 | 21.34 | 0.02 | 0.728613 | 21.89 | 0.02 |
| 0.741483 | 21.42 | 0.02 | 1.682154 | 22.10 | 0.02 |
| 1.693693 | 21.59 | 0.02 | 1.705106 | 22.00 | 0.02 |
| 1.717861 | 21.33 | 0.01 | 1.730836 | 21.49 | 0.01 |
| 2.646191 | 21.27 | 0.01 | 2.634102 | 21.69 | 0.02 |
| 2.686550 | 21.36 | 0.02 | 2.658033 | 21.75 | 0.02 |
| 2.722461 | 21.42 | 0.02 | 2.734216 | 21.94 | 0.02 |
| 3.610141 | 21.48 | 0.02 | 3.621931 | 22.01 | 0.02 |
a We could not estimate metallicity and reddening values for V10, due to the large scatter of the light curves