Measurement of the Capillary Length for the Dendritic Growth of Ammonium Chloride
Abstract
We report the results of a new method of measuring the capillary length for the dendritic crystal growth of non-faceted materials. This method uses a nearly spherical crystal held near unstable equilibrium in an oscillating temperature field. For the growth of ammonium chloride crystals from aqueous solution, previous published estimates of the capillary length varied by over a factor of 20. With this new method, we find the product of the diffusion constant and capillary length to be , similar to that obtained for ammonium bromide crystals.
keywords:
A1. Dendrites , A1. Morphological stability , A1. Interfaces B1. Saltsurl]http://sites.lafayette.edu/doughera
1 Introduction
Dendritic crystal growth is a common form of solidification observed for the diffusion-limited growth of non-faceted materials. It is important technologically because many metals and metal alloys solidify in dendritic patterns, but it is also of more general interest as one of the standard examples of pattern formation in a nonlinear, nonequilibrium system [1]. For reviews, see Boettinger et al. [2], Glicksman and March [3], and Huang and Wang [4],
In the standard model of diffusion limited crystal growth, there are two characteristic length scales [1]. One is the diffusion length , given by , where is the relevant diffusion constant and is interface velocity. The other is the capillary length, , which is related to the energy of the solid-liquid interface. For many theories of dendritic crystal growth [1, 2, 3, 5, 6] the crystal tip growth speed and radius of curvature are related to those length scales by the quantity defined by
Experimental tests of those theories require measurements of the relevant material parameters.
For a pure system, is given by
| (1) |
where is the solid-liquid surface tension, is the melting temperature for a flat interface, is the specific heat per unit volume, and is the latent heat per unit volume.
For growth from solution, is given by
| (2) |
where is the difference in concentration between the solid and liquid phases, and is the chemical potential.
For a few simple pure materials, such as helium [7] or xenon [8], it is possible to measure the materials constants in Eq. 1 directly and thus determine . More commonly, however, must be determined from measurements of the solid-liquid interface shape under well-controlled experimental conditions.
For pure materials, or for dilute solutions, Schaefer, Glicksman, and Ayers [9] showed how to use measurements of the curvature of the solid-liquid interface near a grain boundary to determine , and applied the technique to succinonitrile. Singh and Glicksman [10] applied the same technique to pivalic acid. Similar measurements have been made for xenon [11] and pyrene [12]. Luo, Strachan, and Swift [13] developed a method to use the maximum supercooling obtainable for a pure system to determine the solid-liquid interfacial energy, and applied it to the ice-water system.
For growth from solution, Dougherty and Gollub [14] modeled the shrinking of a nearly spherical crystal of ammonium bromide. Tanaka and Sano [15] and Sawada et al. [16] applied the same technique to ammonium chloride. Gomes, Falcão, and Mesquita [17] used the instability of a cellular interface to measure the capillary length for a nematic-isotropic interface in liquid crystals.
For ammonium bromide, Dougherty and Gollub [14] estimated . For ammonium chloride, Tanaka and Sano [15] estimated a much larger value of , while Sawada et al. [16] estimated a much smaller value of .
In this paper, we extend the method of Ref. [14] to maintain a nearly spherical crystal of ammonium chloride close to a state of unstable equilibrium, and extract a value for the product from the quasistatic growing and shrinking of that crystal. Our final result of , is intermediate between the two previous results, and is also comparable to our previously-reported value for ammonium bromide.
2 Theory
The theory for the diffusion-limited growth of an isotropic spherical crystal in an isothermal solution is developed in Ref. [1]. Briefly, the dimensionless concentration field is presumed to follow the diffusion equation in the quasistatic limit,
For a spherical crystal of radius , the boundary conditions are that , where is the capillary length, and , where is the dimensionless supersaturation, given in Ref. [1] by
The normal velocity of the interface is then given by
where is the diffusion coefficient for NH4Cl in aqueous solution. The final result is that the radial growth velocity, , is given by
| (3) |
This equation can also be used to define the critical radius, . Crystals larger than will grow, while crystals smaller than will shrink.
Equation 3 is valid for an isolated crystal, but in the present experiments, the crystal is denser than the surrounding fluid, and rests against the bottom of the cell. The crystal does not wet the glass—experiments where the crystal rolls show that the crystal remains roughly spherical. (One such event is visible in Fig. 2 around .)
The presence of the boundary does affect the diffusive growth, however. Following Ref. [14], we model the presence of the wall by considering a sphere of radius resting on the bottom of the cell, which is taken as the plane. We then solve the quasistatic diffusion equation for the dimensionless concentration field , subject to the boundary conditions that on the far boundaries of the system, on the surface of the crystal, and the vertical gradient of is zero on the bottom of the cell. We estimate the growth rate by averaging the radial velocity over the surface of the crystal. The result is % of the value obtained without the cell wall at . We model this as an effective diffusion constant , where .
For estimating , since the typical temperature variations are less than in this experiment, we adopt a simple linear model for the product , namely
| (4) |
where is the temperature at which a flat interface would be in equilibrium, and is a proportionality constant to be determined empirically.
The final result is that the radial growth velocity, , is given by
| (5) |
The diffusion coefficient is not independently measured in these experiments, so we instead determine the product .
3 Materials and Methods
The experiments were performed with solutions of ammonium chloride (Fisher Scientific, 99.99%) in water (Fisher Scientific, HPLC grade, filtered through a filter). The concentration was approximately 36% NH4Cl by weight, for a saturation temperature of approximately .
3.1 Temperature control
The solution was placed in a mm3 glass spectrophotometer cell sealed with a Teflon stopper held in place by epoxy. A thermistor was mounted on the cell for direct readings of the temperature near the crystal. The cell was mounted in a massive copper block, surrounded by an insulated outer aluminum block, and placed on a microscope stage. The entire apparatus was enclosed in a temperature-controlled insulated plexiglas box.
Temperatures were all measured with US Sensor PT503J2 thermistors, which have an accuracy of and a sensitivity of in the temperature range of interest. A thermistor was mounted inside the copper block and connected to a Keithley 2000 6 digit multimeter. For heating, a Minco film heater was mounted directly on the block and connected to an HP 6033A power supply. A similar system was connected to the outer aluminum block. The multimeters and power supplies were all connected to the computer over the GPIB bus. The temperature was controlled by a software proportional-integral-derivative controller taking data every 2 seconds, allowing complete programmatic control over the temperature during the course of a run. The rms temperature fluctuation of the copper block around the target temperature was approximately , while the typical fluctuations in the outer aluminum block were less than . The enclosing box was controlled by a separate stand-alone temperature controller to .
3.2 Imaging
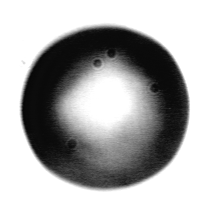
Images were obtained from a charged coupled device (CCD) camera attached to the microscope and acquired directly into the computer via a Data Translation DT3155 frame grabber with a resolution of pixels. The ultimate resolution of the images was . A typical crystal image is shown in Fig. 1.
The interface position and radius of the nearly spherical crystals were measured as in Ref. [18]. To find the interface position, the image intensity was first scanned on horizontal and vertical lines passing through the crystal. The intensity typically dropped rapidly over the span of 4 or 5 pixels heading from outside to inside the crystal. In that transition region, a straight line was fit to the intensity function, and the border was interpolated as the position where that fit intensity equaled the average of the intensity just outside and just inside the crystal. The center of the crystal was then approximated as the average of all the border positions. Since the intensity profile of the interface is more reproducible if the scanline is normal to the interface, a second set of scans was done radially, and the center re-computed. Finally, the radial scan was repeated to get the final estimates of the border positions, which were then converted to polar coordinates around the center. For the nearly spherical crystals used in this work, the estimate of the center position was further adjusted to minimize the amplitude of the first mode in a Fourier Series approximation of .
3.3 Methods
To obtain a single crystal, the solution was heated to dissolve all the NH4Cl, stirred to eliminate concentration gradients, and then cooled to initiate growth. Many crystals would nucleate, but upon warming, most would dissolve. The system was again stirred to bring the largest remaining crystals into the field of view, and an automated process was initiated to acquire images, measure their size, and slowly adjust the temperature until only a single isolated crystal remained.
Specifically, at each time step (typically ) we measured the radius and used it and the preceding 3 measurements to estimate the growth velocity and hence the critical radius . (This required a preliminary estimate of , but the result was not particularly sensitive to the precise value.) Although Eq. 3 is only valid for a single isolated spherical crystal, we found that it provided a workable approximation even for irregularly shaped crystals and even for small collections of crystals, provided the overall velocity was relatively small . For larger velocities, where the calculated values were not reasonable, we made ad-hoc estimates of plausible values. We then compared to and to the desired target size , and adjusted the temperature up or down proportionally to the difference .
This process was continued until the largest crystal was the desired size. Smaller crystals would dissolve, since they all had . Depending on the initial conditions, the whole process typically took about a week. Although such a spherical crystal is in a state of unstable equilibrium, we found it possible to maintain it indefinitely, provided we continually monitored the size and adjusted the temperature accordingly. This isolated, nearly spherical, crystal was allowed to stabilize for several days. An example of a crystal held stable for 4 days is shown in Fig. 1.
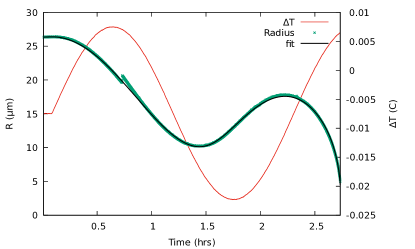
Once a single, stable crystal was obtained, the temperature of the sample was slowly oscillated with an amplitude of and a period of either or . This caused the crystal to alternatively grow and dissolve slowly, but the size and growth rate changed enough that both terms on the right of Eq. 5 were significant.
4 Results
The resulting fit is shown in Fig. 2. The best fit parameters are , , and , where the uncertainties are the standard deviation of the mean over three independent runs.
Comparisons with previous measurements for require an estimate of the diffusion coefficient . For lower concentrations and temperatures, the diffusion coefficient was measured by Lutz and Mendenhall [19] and by Hall, Wishaw, and Stokes [20]. Extrapolating those published values to the temperatures and concentrations used in this work, we estimate , similar to the values of used by Tanaka and Sano [15], and used by Sawada et al. [16]. With this value of , we estimate for NH4Cl. This value is in between the values of and reported in Refs. [15] and [16]. It also compares favorably with the value of previously reported for NH4Br [14],
5 Conclusion
There were two main factors we found to be important in getting consistent results from this experiment. First, control and measurement of the temperature at the sample was critical. In preliminary trials with poorer insulation, or where the outer aluminum block temperature fluctuated more, we were unable to get satisfactory fits to Eq. 5 over long time scales as in Fig. 2.
Second, the oscillating protocol proved a robust probe of Eq. 5. In previous work on slowly dissolving crystals, as in Ref. [14], we typically found that the fitted value for depended very sensitively on the last few data points, where the crystal was shrinking rapidly just before completely dissolving. Small drifts in temperature on the order of could make significant differences in the quality of the fit. In Ref. [15], the fit does not include the last two data points. By contrast, Fig. 2 includes both growing and dissolving segments so that both terms in Eq. 5 were significant, and the fit was well-constrained.
One remaining uncertainty is the possible role of convection in this experiment. The density differences caused by the growth and dissolution of the crystal could drive small convection currents. However, the excellent fit to the data suggests that Eq. 5 still provides an effective model for the growth process.
Acknowledgments
The author thanks F. Scott Stinner for his work on an earlier version of this experiment, and Lafayette College for financial support.
This research did not receive any specific grant from funding agencies in the public, commercial, or not-for-profit sectors.
Data used in this paper is available through Mendeley at https://data.mendeley.com/datasets/kr2mgbymr3/1.
Declarations of interest: none.
References
References
- [1] J. S. Langer, Instabilities and pattern formation in crystal growth, Reviews of Modern Physics 52 (1) (1980) 1–28. doi:10.1103/RevModPhys.52.1.
- [2] W. J. Boettinger, S. R. Coriell, A. L. Greer, A. Karma, W. Kurz, M. Rappaz, R. Trivedi, Solidification microstructures: Recent developments, future directions, Acta Mater. 48 (1) (2000) 43–70. doi:10.1016/S1359-6454(99)00287-6.
- [3] M. E. Glicksman, S. P. March, in: D. J. T. Hurle (Ed.), Handbook of Crystal Growth, Elsevier Science, 1993, p. 1081.
- [4] W. Huang, L. Wang, Solidification researches using transparent model materials — A review, Science China Technological Sciences 55 (2) (2012) 377–386. doi:10.1007/s11431-011-4689-1.
- [5] D. A. Kessler, J. Koplik, H. Levine, Pattern Selection in Fingered Growth Phenomena, Adv. Phys. 37 (3) (1988) 255–339. doi:10.1080/00018738800101379.
- [6] M. Benamar, E. Brener, Theory of Pattern Selection in 3-Dimensional Nonaxisymmetric Dendritic Growth, Phys. Rev. Lett. 71 (4) (1993) 589–592. doi:10.1103/PhysRevLett.71.589.
- [7] E. Rolley, S. Balibar, F. Graner, Growth shape of needle crystals, Phys. Rev. E 49 (1994) 1500–1506. doi:10.1103/PhysRevE.49.1500.
- [8] J. H. Bilgram, E. Hurlimann, Dendritic solidification of rare-gases, Progress in Crystal Growth and Characterization of Materials 26 (1993) 67–86.
- [9] R. Schaefer, M. Glicksman, J. Ayers, High-Confidence Measurement of Solid-Liquid Surface-Energy in a Pure Material, Philosophical Magazine 32 (4) (1975) 725–743. doi:10.1080/14786437508221616.
- [10] N. B. Singh, M. E. Glicksman, Determination of the Mean Solid-Liquid Interface Energy of Pivalic Acid, J. Cryst. Growth 98 (4) (1989) 573–580. doi:10.1016/0022-0248(89)90293-5.
- [11] I. Stalder, J. H. Bilgram, The measurement of the solid-liquid surface free energy of xenon, J. Chem. Phys. 118 (17) (2003) 7981–7984. doi:10.1063/1.1565319.
- [12] S. Akbulut, Y. Ocak, U. Boyuk, M. Erol, K. Keslioglu, N. Marasli, Solid-liquid interfacial energy of pyrene, J. Appl. Phys. 100 (12) (2006) 123505. doi:10.1063/1.2402098.
- [13] S. N. Luo, A. Strachan, D. C. Swift, Deducing solid-liquid interfacial energy from superheating or supercooling: Application to H2O at high pressures, Model. Simul. Mater. Sci. Eng. 13 (3) (2005) 321–328. doi:10.1088/0965-0393/13/3/002.
- [14] A. Dougherty, J. P. Gollub, Steady-state dendritic growth of NH4Br from solution, Physical Review A 38 (6) (1988) 3043–3053. doi:10.1103/PhysRevA.38.3043.
- [15] A. Tanaka, M. Sano, Measurement of the kinetic effect on the concentration field of a growing dendrite, J. Cryst. Growth 125 (1–2) (1992) 59–64. doi:10.1016/0022-0248(92)90320-I.
- [16] T. Sawada, K. Takemura, K. Shigematsu, S. ichi Yoda, K. Kawasaki, Diffusion field around a dendrite growing under microgravity, Phys. Rev. E 51 (1995) R3834–R3837. doi:10.1103/PhysRevE.51.R3834.
- [17] O. A. Gomes, R. C. F. ao, O. N. Mesquita, Anomalous capillary length in cellular nematic-isotropic interfaces, Phys. Rev. Lett. 86 (2001) 2577–2580. doi:10.1103/PhysRevLett.86.2577.
- [18] A. Dougherty, Surface-Tension Anisotropy and the Dendritic Growth of Pivalic Acid, J. Cryst. Growth 110 (3) (1991) 501–508. doi:10.1016/0022-0248(91)90286-E.
- [19] J. L. Lutz, G. D. Mendenhall, Diffusion coefficients by NMR-spin echo methods for the systems water-ammonium chloride, water-succinonitrile, and acetone-succinonitrile, J. Cryst. Growth 217 (1-2) (2000) 183–188. doi:10.1016/S0022-0248(00)00504-2.
- [20] J. R. Hall, B. F. Wishaw, R. H. Stokes, The Diffusion Coefficients of Calcium Chloride and Ammonium Chloride in Concentrated Aqueous Solutions at 25∘, J. Am. Chem. Soc. 75 (7) (1953) 1556–1560. doi:10.1021/ja01103a011.