Anomalous momentum dependence of the multiband electronic structure of FeSe1-xTex superconductors induced by atomic disorder
Abstract
When periodicity of crystal is disturbed by atomic disorder, its electronic state becomes inhomogeneous and band dispersion is obscured. In case of Fe-based superconductors, disorder of chalcogen/pnictogen height causes disorder of Fe 3 level splitting. Here, we report an angle-resolved photoemission spectroscopy study on FeSe1-xTex with the chalcogen height disorder, showing that the disorder affects the Fe 3 band dispersions in an orbital-selective way instead of simple obscuring effect. The reverse of the Fe 3 level splitting due to the chalcogen height difference causes the splitting of the hole band with Fe 3 character around the point.
pacs:
74.25.Jb, 74.70.Xa, 79.60.-i, 74.81.-gThe inhomogeneous distributions of spin, charge, lattice, and gap magnitude discovered in high-Tc cuprates 1 ; 2 ; 3 have inspired tremendous research activities on the relationship between the inhomogeneity and the high- superconductivity. The inhomogeneous electronic state is deeply related to the phase competition or the quantum critical phenomenon which plays a central role for the emergence of high- superconductivity. On the other hand, the discoveries of high- superconductivity in Fe pnictides and chalcogenides have created a new wave of research activities on the high- superconductors. 7 The Fe-based superconductors are based on a multi-orbital system in which several Fermi surfaces with different Fe 3 orbital character are responsible for the superconductivity while the cuprate basically has single Fermi surface mainly derived by the Cu 3 orbital. Therefore, although the competition between the magnetism and superconductivity is commonly seen in the cuprates and the Fe pnictides/chalcogenides, the inhomogeneity discovered in the Fe pnictides/chalcogenides could be different from that in the cuprates due to the multi-orbital character.
-FeSe has the simplest crystal structure (anti-PbO type structure) among the Fe-based superconductors as displayed in Figs. 1(a) and (b)]. While -FeSe shows superconductivity with 8 K, 8 -FeTe is not superconducting and, instead, shows incommensurate spin density wave accompanied by structural transition from tetragonal to orthorhombic phase. 9 The spin density wave of FeTe exhibits a stripe-type spin modulation, the direction of which is different from that of the FeAs-based parent compounds such as LaFeAsO and BaFe2As2. FeSe1-xTex (0 0.7) shows superconductivity with a maximum 15 K. An extended x-ray absorption fine-structure (EXAFS) study has revealed that the Se and Te atoms are distributed with short Fe-Se bonds and long Fe-Te bonds as shown in Fig. 1(b). 10 Since the difference in chalcogen height between FeSe and FeTe reverses Fe 3 orbital levels as displayed in Figs. 1(c) and (d), the Fe-Se/Te bond disorder may result in the Fe 3 orbital disorder in the real space. In this paper, we report an angle-resolved photoemission spectroscopy (ARPES) study on FeSe1-xTex which reveal the impact of ligand field reverse between FeSe and FeTe on the fundamental electronic structure of FeSe1-xTex. In FeSe1-xTex, the distribution of the Fe-Se and Fe-Te bonds in the real space causes the splitting of the hole band with Fe 3 character around the point in the momentum space. Since the hole pocket of the Fe 3 band is expected to play important roles in various proposed paring mechanisms including paring by spin fluctuation Kuroki2008 ; Mazin2008 and paring by orbital fluctuation, Kontani2010 the present study on the orbital-selective band splitting due to the chalcogen height disorder suggests that the inhomogeneity in the orbital channel should be included to describe the Fe-based superconductors.
We have studied single crystals of annealed FeSe1-xTex with = 0.6 and 0.9 which were grown as reported by Noji et al. 11 ARPES measurements were performed at beamline 9A, Hiroshima Synchrotron Radiation Center (HSRC) which has a normal incidence monochromator with off-plane Eagle mounting. The end station is equipped with a SCIENTA R4000 analyzer for angle-resolved photoemission experiments, which is a 200 mm mean radius spectrometer. The helical undulator and the monochromator provides circularly polarized light for the energy range of 4-30 eV. In the present experiment, the photon energy was set to = 17 eV and 23 eV. Total energy resolutions including the monochromator and the electron analyzer were set to 18 meV and 14 meV for = 23 eV and 17 eV, respectively. The base pressure of the spectrometer was Pa range. The single crystals were properly oriented on the sample stage by the standard Laue measurements and were cooled using liquid He refrigerator. We cleaved the single crystals at 14 K under ultrahigh vacuum and took ARPES data at 14 K within four hours after the cleavage.
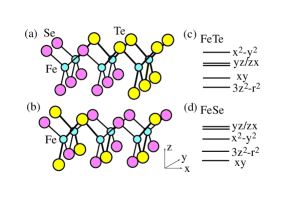

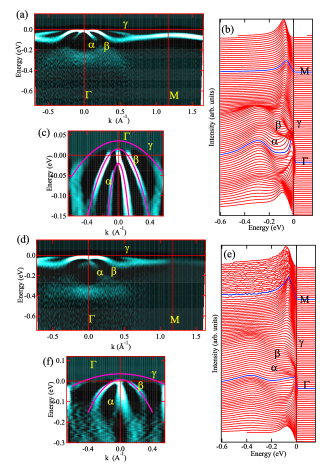
Figure 2 shows Fermi surfaces of annealed FeSe1-xTex with = 0.6 taken at = 17 eV and 23 eV. For the Fermi surface mapping, we used ARPES intensity integrated within an energy window of 5 meV at the Fermi level (). The momentum points where the bands cross can be determined by maximum points in second derivative spectrum of momentum distribution curve (MDC) at . The momentum points thus determined are indicated by the dots, and the Fermi surfaces deduced from the dots are shown in the maps. The cut from (zone center) to M (zone corner) corresponds to the in-plane Fe-Fe direction. As commonly observed in various Fe-based superconductors, the hole-like Fermi surfaces around and the electron-like Fermi surface around M are observed. The area of the outer Fermi surface increases in going from = 17 eV to = 23 eV, indicating that the Fermi surface depends on the momentum perpendicular to the FeSe plane. In the following discussion, we focus on the ARPES data taken at = 23 eV in which the point (zone center) of the two-dimensional Brillouin zone is rather close the Z point of the three-dimensional Brillouin zone, and the hole bands are more clearly observed compared to those at = 17 eV.
Figure 3(a) shows band dispersions along the -M direction of annealed FeSe1-xTex with = 0.6 at = 23 eV. The band dispersions are extracted from the EDC data displayed in Fig. 3(b). Three hole-like bands at the zone center are clearly observed. Among them, two outer hole-like bands cross and the inner hole-like band does not cross with top position at about 20 meV below judging from the energy distribution curve (EDC). (It is very difficult to identify the band top using the second derivative spectrum of MDC since the tail above the band top, which is mainly due to finite energy resolution, appears as a maximum point in MDC.) This is consistent with two hole-like pockets around the zone center ( point) observed in Fig. 2, and is qualitatively consistent with the previous ARPES results on FeSe0.42Te0.58, 12 FeTe, 13 Fe1.03Te0.7Se0.3, 14 and FeSe0.5Te0.5. 15
The present results show that the effect of Fe-Se/Te bond disorder is apparently small in the momentum space. The difference of Fe-Se/Te bond, in particular, Se/Te height from the Fe plane is predicted to give substantial change of the electronic structure between FeSe and FeTe both in the zone center and zone corner. 12 In the case of FeSe, there are the band below and only bands crossing around point, while, in the case of FeTe, there are three bands crossing and () bands have higher (lower) energy around . Although the Fe 3 orbitals are completely disordered due to the bond disorder, the clear band structures survive around the zone center. Here, it should be noted that the Se/Te distribution in FeSe1-xTex becomes more homogeneous or more random by annealing as confirmed by x-ray diffraction analysis and electron probe micro analysis. 16 ; 17
The momentum dependent effect of atomic disorder in random alloys of , 18 in which the local structure around the site is disordered although the end members and possessing perfect crystallographic symmetry, 19 provides a hint to understand the ARPES results of FeSe0.4Te0.6. In the strongly perturbed alloys, the band structure of deviates from the average between those of and due to formation of impurity bands. The specialty of Fe(Se,Te) is that the Fe 3 level splitting is reversed between FeSe and FeTe. The EXAFS results 10 indicate that the Fe 3 orbital splitting locally have FeSe-like orbital state or FeTe-like orbital state instead of the average between them. In such case, the FeSe-like band dispersion and the FeTe-like band dispersion can coexist in the momentum space to be observed by ARPES.
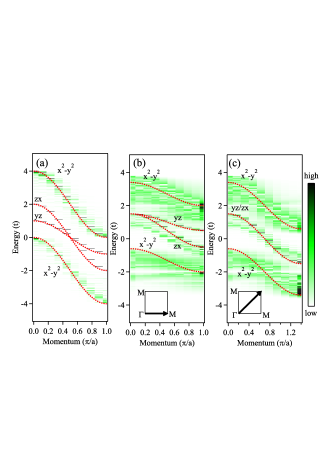
In order to support this scenario on the coexistence of FeSe-like and FeTe-like band dispersions, momentum distribution of single-electron excitation is calculated using a 19-site one-dimensional (1D) model and a 19 19-sites two-dimensional (2D) model with random Fe 3 level splitting. In the present models with Fe 3 , , and orbitals, the energies of , , and are set to -2 (2), 0, 0 at the FeSe-like (FeTe-like) sites to consider the reverse of orbital splitting. In the 1D model with lattice constant , the transfer integrals between the neighboring and orbitals are set to while those between the neighboring orbitals are set to . In the 2D square lattice model with lattice constant , the transfer integrals between the neighboring orbitals are along the x- and y-axes and those between the neighboring () orbitals are and ( and ) along the x- and y-axes respectively. All the configurations for 40% FeSe-like sites and 60% FeTe-like sites are included in the 1D case while 10000 configurations are randomly selected for the 2D case. The calculated momentum distribution for the 1D model is displayed in Fig. 4(a) where the Fe 3 band is split into the two bands which correspond to the FeTe-like and FeSe-like band dispersions (roughly follow as indicated by the dotted curves respectively). The splitting of the Fe 3 band is also reproduced in the 2D model along the (0,0) to (,0) direction [Fig. 4( b)] and along the (0,0) to (,) direction [Fig. 4(c)]. In the 2D case, the band dispersions of the Fe 3 bands are roughly fit to (shown by the dotted curves) indicating that renormalization effect with factor of 0.7. The renormalization effect due to the random orbital distribution could contribute to the enhancement of electronic specific heat in FeSexTe1-x.
The ARPES results of FeSe0.4Te0.6 can be interpreted on the basis of the present calculations. The inner hole band labeled as can be assigned to the band of the FeSe-like orbital state. On the other hand, the outer hole band labeled as is derived from the band of the FeTe-like orbital state. The bands of FeSe- and FeTe-like orbital states, which are almost degenerate in the LDA calculations, 12 can be merged as demonstrated in the above calculations and can be observed as . At = 0.6, the annealing induces small increase of 11 which is probably due to strain relaxing atomic redistribution for the two kinds of orbital states, suppressing the magnetic order of FeTe-like orbital domains (compressive for the one and tensile for the other domains) as happens in various granular superconductors and random alloys. 18 At this point, it is very interesting and important to study = 0.9 in which the as-grown sample is not superconducting and the annealing induces 11 K. 11
Figure 3(d) shows band dispersions of annealed FeSe1-xTex with = 0.9 at = 23 eV. The band dispersions are extracted from the EDC data displayed in Figs. 3(e). At least two hole-like bands at the zone center are observed. The Te rich sample is dominated by the FeTe-like orbital states. Therefore, it is expected that the band (labeled as ) is higher in energy than the band at the zone center and the band is smoothly connected to the flat band at the zone corner. This expectation is consistent with the observed band dispersions shown in Figs. 3(d) and (f). In addition, the width of the outer hole band labeled as is smaller at = 0.9 than = 0.6. Such band structure of FeTe is known to support magnetic state instead of superconductivity. However, at = 0.9, the Se/Te distribution helps to form FeSe-like orbital site where the band (labeled as ) is higher in energy than the band (labeled as ). Here, it should be noted that the intensity of band is very small at = 0.9 compared to that at = 0.6, consistent with the assumption that it is derived from the minor FeSe-like orbital state. At this stage. one can speculate that the superconductivity appears at = 0.9 due to strain relaxing distribution of the domains with different orbital states on annealing.
In conclusion, we have reported an ARPES study on the annealed FeSe1-xTex ( = 0.6 and 0.9). The comparison between the band dispersions at = 0.6 and those at = 0.9 shows that the disorder of Fe 3 level splitting affects the Fe 3 band dispersions in an orbital-selective way. The hole bands at the zone center in FeSe1-xTex can be assigned to the Fe 3 bands from the FeSe-like and the FeTe-like orbital states as supported by the model calculation. At = 0.9, the minor FeSe-like orbital state may induce the superconductivity due to strain relaxing atomic distribution under the atomic disorder.
The synthesis and characterization of the FeSe1-xTex single crystals were supported by a Grant-in-Aid for Scientific Research from the Japan Society for Promotion of Science. The synchrotron radiation experiments have been done with the approval of HSRC (Proposal No. 10-A-10).
References
- (1) J. M. Tranquada, B. J. Sternlieb, J. D. Axe, Y. Nakamura, S. Uchida, Nature 375, 561 (1995).
- (2) A. Bianconi, N. L. Saini, A. Lanzara, M. Missori, T. Rossetti, H. Oyanagi, H. Yamaguchi, K. Oka, T. Ito, Phys. Rev. Lett. 76, 3412 (1996).
- (3) K. M. Lang, V. Madhavan, J. E. Hoffman, E. W. Hudson, H. Eisaki, S. Uchida, Nature 415, 412 (2002).
- (4) Y. Kamihara, T. Watanabe, M. Hirano, and H. Hosono, J. Am. Chem. Soc. 130, 3296 (2008).
- (5) F. C. Hsu, J. Y. Luo, K. W. The, T. K. Chen, T. W. Huang, P. M. Wu, Y. C., Lee, Y. L. Huang, Y. Y. Chu, D. C. Yan, M. K. Wu, Proc. Natl. Acad. Sci. U.S.A. 105, 14262 (2008).
- (6) W. Bao, Y. Qiu, Q. Huang, M. A. Green, P. Zajdel, M. R. Fitzsimmons, M. Zhernenkov, S. Chang, M. Fang, B. Qian, E. K. Vehstedt, J. Yang, H. M. Pham, L. Spinu, Z. Q. Mao, Phys. Rev. Lett. 102, 247001 (2009).
- (7) B. Joseph, A. Iadecola, A. Puri, L. Simonelli, Y. Mizuguchi, Y. Takano, N. L. Saini, Phys. Rev. B 82, 020502 (2010).
- (8) K. Kuroki, S. Onari, R. Arita, H. Usui, Y. Tanaka, H. Kontani, and H. Aoki, Phys. Rev. Lett. 101, 087004 (2008).
- (9) I. I. Mazin, D. J. Singh, M. D. Johannes, and M. H. Du, Phys. Rev. Lett. 101, 057003 (2008).
- (10) H. Kontani and S. Onari, Phys. Rev. Lett. 104, 157001 (2010).
- (11) T. Noji, T. Suzuki, H. Abe, T. Adachi, M. Kato, Y. Koike, J. Phys.Soc. Jpn. 79, 084711 (2010).
- (12) A. Tamai, A. Y. Ganin, E. Rozbicki, J. Bacsa, W. Meevasana, P. D. C. King, M. Caffio, R. Schaub, S. Margadonna, K. Prassides, M. J. Rosseinsky, F. Baumberger, Phys. Rev. Lett. 104, 097002 (2010).
- (13) Y. Xia, D. Qian, L. Wray, D. Hsieh, G. F. Chen, J. L. Luo, N. L. Wang, M. Z. Hasan, Phys. Rev. Lett. 103, 037002 (2009).
- (14) K. Nakayama, T. Sato, P. Richard, T. Kawahara, Y. Sekiba, T. Qian, G. F. Chen, J. L. Luo, N. L. Wang, H. Ding, T. Takahashi, Phys. Rev. Lett. 105, 197001 (2010).
- (15) S.-H. Lee, G. Xu, W. Ku, J. S. Wen, C. C. Lee, N. Katayama, Z. J. Xu, S. Ji, Z. W. Lin, G. D. Gu, H.-B. Yang, P. D. Johnson, Z.-H. Pan, T. Valla, M. Fujita, T. J. Sato, S. Chang, K. Yamada, J. M. Tranquada, Phys. Rev. B 81, 220502(R) (2010).
- (16) M. Imaizumi, T. Noji, T. Adachi, Y. Koike, Physica C 471, 614 (2011).
- (17) T. Taen, Y. Tsuchiya, Y. Nakajima, T. Tamegai, Phys. Rev. B 80, 092502 (2009).
- (18) V. Popescu and A. Zunger, Phys. Rev. Lett. 104, 236403 (2010).
- (19) P. F. Peterson, Th. Proffen, I.-K. Jeong, S. J. L. Billinge, K.-S. Choi, M. G. Kanatzidis, P. G. Radaelli, Phys. Rev. B 63, 165211 (2001).